Click image to see more details
Product Info Summary
| SKU: | RP1080 |
|---|---|
| Size: | 100 μg/vial |
| Reactive Species: | Human, Mouse, Rat |
| Host: | Rabbit |
| Application: | ELISA, WB |
Customers Who Bought This Also Bought

Product info
Product Name
Anti-Osteopontin/SPP1 Antibody Picoband®
SKU/Catalog Number
RP1080
PB0589 is an alternative SKU for this antibody, used in previous lots.
Size
100 μg/vial
Form
Lyophilized
Description
Boster Bio Anti-Osteopontin/SPP1 Antibody catalog # RP1080. Tested in ELISA, WB applications. This antibody reacts with Human, Mouse, Rat. The brand Picoband indicates this is a premium antibody that guarantees superior quality, high affinity, and strong signals with minimal background in Western blot applications. Only our best-performing antibodies are designated as Picoband, ensuring unmatched performance.
Storage & Handling
Store at -20˚C for one year from date of receipt. After reconstitution, at 4˚C for one month. It can also be aliquotted and stored frozen at -20˚C for six months. Avoid repeated freeze-thaw cycles.
Cite This Product
Anti-Osteopontin/SPP1 Antibody Picoband® (Boster Biological Technology, Pleasanton CA, USA, Catalog # RP1080)
Host
Rabbit
Contents
Each vial contains antibody formulated with stabilizing components, 0.9 mg NaCl, 0.2 mg Na2HPO4, and 0.05 mg NaN3.
*This antibody is supplied in a stabilized formulation.
Compatibility with conjugation reactions depends on the chemistry of the conjugation method used.
For conjugation methods that are not compatible with the stabilizing components present in this formulation, a carrier-free antibody format is required.
Clonality
Polyclonal
Isotype
Rabbit IgG
Immunogen
A synthetic peptide corresponding to a sequence at the C-terminus of human Osteopontin, different from the related mouse sequence by eight amino acids, and from the related rat sequence by seven amino acids.
Cross-reactivity
No cross-reactivity with other proteins
Reactive Species
RP1080 is reactive to SPP1 in Human, Mouse, Rat
Observed Molecular Weight
66 kDa, 25-55 kDa
Calculated molecular weight
35.4 kDa
Background of SPP1
Osteopontin (OPN), also known as secreted phosphoprotein 1 (SPP1), is a protein that in humans is encoded by the SPP1 gene (secreted phosphoprotein 1). The protein encoded by this gene is involved in the attachment of osteoclasts to the mineralized bone matrix. And the encoded protein is secreted and binds hydroxyapatite with high affinity. The osteoclast vitronectin receptor is found in the cell membrane and may be involved in the binding to this protein. Also, this protein is a cytokine that upregulates expression of interferon-gamma and interleukin-12. Several transcript variants encoding different isoforms have been found for this gene.
Antibody Validation
Boster validates all antibodies on WB, IHC, ICC, Immunofluorescence, and ELISA with known positive control and negative samples to ensure specificity and high affinity, including thorough antibody incubations.
Application & Images
Applications
RP1080 is guaranteed for ELISA, WB Boster Guarantee
Recommend Dilution
| Application | Dilution | Species |
|---|---|---|
| Western blot | 0.1-0.5μg/ml | Human, Mouse, Rat, - |
| ELISA | 0.1-0.5μg/ml | - |
Tested application
Suggested blocking solution with 5% non-fat milk or BSA; (*)Recommended protein loading: 20-40 µg per lane
Validation Images & Assay Conditions
Click image to see more details
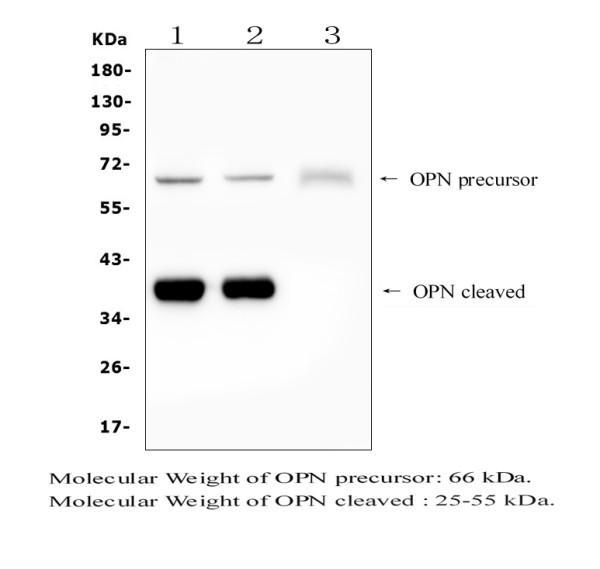
Western blot analysis of Osteopontin using anti-Osteopontin antibody (RP1080).
Electrophoresis was performed on a 5-20% SDS-PAGE gel at 70V (Stacking gel) / 90V (Resolving gel) for 2-3 hours. The sample well of each lane was loaded with 50ug of sample under reducing conditions.
Lane 1: rat brain tissue lysates,
Lane 2: mouse brain tissue lysates,
Lane 3: human SHG-44 whole cell lysates,
After Electrophoresis, proteins were transferred to a Nitrocellulose membrane at 150mA for 50-90 minutes. Blocked the membrane with 5% Non-fat Milk/ TBS for 1.5 hour at RT. The membrane was incubated with rabbit anti-Osteopontin antigen affinity purified polyclonal antibody (Catalog # RP1080) at 0.5 μg/mL overnight at 4°C, then washed with TBS-0.1%Tween 3 times with 5 minutes each and probed with a goat anti-rabbit IgG-HRP secondary antibody at a dilution of 1:10000 for 1.5 hour at RT. The signal is developed using an Enhanced Chemiluminescent detection (ECL) kit (Catalog # EK1002) with Tanon 5200 system. A specific band was detected for Osteopontin at approximately 66,25-55KD. The expected band size for Osteopontin is at 35KD.

Click image to see more details
Spatial co-localization of TAM with FAP + CAF. (A) UMAP shows the distribution of monocyte/macrophage subtypes. (B) Bar plot shows the relative proportions of macrophage subtypes in HCC and ICC samples (left); paired dot plot shows the relative proportions of DAB2 + / SPP1 + TAMs in tumor and adjacent liver paired samples (right). *, P < 0.05; **, P < 0.01; ***, P < 0.001; ****, P < 0.0001. (C) Distribution of DAB2 + TAMs and FAP + CAF in HCC boundary slides, and SPP1 + TAM and FAP + CAF in ICC boundary slides based on CellTrek deconvolution (left); heatmap shows the Kullback-Leibler (KL) divergence of FAP + CAF with different macrophage subtypes in ST slides, with the higher KL divergence representing the greater degree of co-localization of the two cell types (right). (D) Pie plots showing the relative proportions of different macrophage subtypes in the ST slides. (E) Unbiased clustering of ST spots and definition of cell types of each cluster (left); dot plot showing the expression of select marker genes of each cluster (right). (F) Multi-plex immunofluorescence images showing the aggregation of FAP + CAF with DAB2 + TAM at the tumor border in HCC and FAP + CAF with SPP1 + TAM at the tumor border and core in ICC. The scale bar is 200 μm and 100 μm.
Index in PubMed under a CC BY license. PMID: 39239526

Click image to see more details
Mononuclear phagocytic system lineage analysis reveals the potential function of SPP1 + Mac enriched in LFH. (A) UMAP of MPs in human LF tissue, dyed according to the cell types. SPP1 + Mac are circled by the black dotted line. (B) Dot plot displaying marker gene expression in different mononuclear phagocyte subpopulations, with color indicating the scaled mean expression of genes. (C) UMAP of MPs from the non-LFH group and the LFH group, dyed according to the cell types. (D) Bar graph showing the proportion of each mononuclear phagocyte subpopulation in the non-LFH group and the LFH group. (E) Stacked violin plot showing the expression of common markers in SPP1 + Mac and IL1B + Mac, categorized into Mø, M1, and M2 types. (F) Representative IHC images showing the expression of CD86, CD206, and SPP1 in non-LFH and LFH samples. Scale bar, 50 μm. Data quantification results are presented on the right, as mean ± SD, with * p < 0.05, ** p < 0.01, and *** p < 0.001. (G) UMAP plots showing M1 (left) and M2 (right) scoring results for each mononuclear phagocyte cluster, with yellow representing high scores and purple representing low scores. (H) Heatmap revealing GSVA scoring results for each mononuclear phagocyte cluster, with red indicating high scores and blue indicating low scores
Index in PubMed under a CC BY license. PMID: 40001138

Click image to see more details
Deciphering the complex interactions among multiple cell lineages in the fibrotic microenvironment of LFH. (A) Circos plots showing potential interactions between High Ferro-score FB and 15 immune cell clusters in the non-LFH (left) and LFH groups (right). Edge width indicates the number of significant L-R pairs between cell types. (B) Interaction strengths for incoming and outgoing signaling events among all clusters in non-LFH and LFH groups. The horizontal axis represents outgoing interaction strength, while the vertical axis represents incoming interaction strength. (C) Bubble plot illustrating communication probabilities of L-R interactions between SPP1 + Mac or IL1B + Mac subclusters (sending signals) and High Ferro-score FB subcluster (receiving signals) in the up-regulated signaling pathways of the LFH group.Red characters represent ligands, and purple characters represent receptors. Bubble color and size represent calculated communication probabilities and p -values, respectively. (D) Comparison of the number and strength of inferred cellular interactions in the non-LFH and LFH groups. (E) Bubble connectivity plot displaying upregulated receptor-ligand pairs from signaling pathways in the LFH group, and their expression levels in corresponding cell clusters. The color of the bubble reflects the communication probability, and the bubble size indicates the percentage expression of L-R pairs. (F) Circle plot of inferred SPP1 signaling networks among SPP1 + Mac and other cell clusters. (G) Bar graph showing the distribution of L-R pairs between SPP1 + Mac and High Ferro-score FB. (H) Violin plots showing the expression difference of ligand SPP1 between SPP1 + Mac in non-LFH and LFH groups, and of receptor CD44 expression in High Ferro-score FB between non-LFH and LFH groups. **** p < 0.0001. ( I - J ) Representative multiplex immunofluorescent images of LF tissue from non-LFH and LFH groups showing the expression of SPP1 (red), CD44 (green), COL1 (orange), and FTL (purple). Nuclei are labeled with DAPI (blue). Scale bar, left, 100 μm; bottom, 100 μm; right, 20 μm
Index in PubMed under a CC BY license. PMID: 40001138
Specific Publications For Anti-Osteopontin/SPP1 Antibody Picoband® (RP1080)
Loading publications
Recommended Resources
Here are featured tools and databases that you might find useful.
- Boster's Pathways Library
- Protein Databases
- Bioscience Research Protocol Resources
- Data Processing & Analysis Software
- Photo Editing Software
- Scientific Literature Resources
- Research Paper Management Tools
- Molecular Biology Software
- Primer Design Tools
- Bioinformatics Tools
- Phylogenetic Tree Analysis
Customer Reviews
Have you used Anti-Osteopontin/SPP1 Antibody Picoband®?
Share your experimental results or join a short interview to earn up to $1,000 in product credits or other rewards.
0 Reviews For Anti-Osteopontin/SPP1 Antibody Picoband®
Customer Q&As
Have a question?
Find answers in Q&As, reviews.
Can't find your answer?
Submit your question
5 Customer Q&As for Anti-Osteopontin/SPP1 Antibody Picoband®
Question
We have observed staining in rat liver. Are there any suggestions? Is anti-Osteopontin/SPP1 antibody supposed to stain liver positively?
Verified Customer
Verified customer
Asked: 2020-04-03
Answer
From what I have seen in literature liver does express SPP1. From what I have seen in Uniprot.org, SPP1 is expressed in amniotic fluid, liver, brain, kidney subthalamic nucleus, placenta, brain kidney, kidney, milk, pituitary, among other tissues. Regarding which tissues have SPP1 expression, here are a few articles citing expression in various tissues:
Brain, and Kidney, Pubmed ID: 15489334
Kidney, Pubmed ID: 1575754
Kidney, and Subthalamic nucleus, Pubmed ID: 14702039
Liver, Pubmed ID: 7945249, 24275569
Milk, Pubmed ID: 2736258, 15869464
Pituitary, Pubmed ID: 16807684
Placenta, Pubmed ID: 16303743
Boster Scientific Support
Answered: 2020-04-03
Question
We are currently using anti-Osteopontin/SPP1 antibody RP1080 for mouse tissue, and we are happy with the ELISA results. The species of reactivity given in the datasheet says human, mouse, rat. Is it likely that the antibody can work on pig tissues as well?
Verified Customer
Verified customer
Asked: 2019-09-27
Answer
The anti-Osteopontin/SPP1 antibody (RP1080) has not been validated for cross reactivity specifically with pig tissues, but there is a good chance of cross reactivity. We have an innovator award program that if you test this antibody and show it works in pig you can get your next antibody for free. Please contact me if I can help you with anything.
Boster Scientific Support
Answered: 2019-09-27
Question
We have tried in the past anti-Osteopontin/SPP1 antibody for WB on milk in the past. I am using human, and We intend to use the antibody for ELISA next. I am interested in examining milk as well as kidney in our next experiment. Could you please give me some suggestion on which antibody would work the best for ELISA?
Verified Customer
Verified customer
Asked: 2018-08-06
Answer
I took a look at the website and datasheets of our anti-Osteopontin/SPP1 antibody and it seems that RP1080 has been tested on human in both WB and ELISA. Thus RP1080 should work for your application. Our Boster satisfaction guarantee will cover this product for ELISA in human even if the specific tissue type has not been validated. We do have a comprehensive range of products for ELISA detection and you can check out our website bosterbio.com to find out more information about them.
Boster Scientific Support
Answered: 2018-08-06
Question
We are interested in using your anti-Osteopontin/SPP1 antibody for integrin cell surface interactions studies. Has this antibody been tested with western blotting on rat brain tissue? We would like to see some validation images before ordering.
C. Carter
Verified customer
Asked: 2014-02-13
Answer
I appreciate your inquiry. This RP1080 anti-Osteopontin/SPP1 antibody is validated on rat brain tissue, mouse brain. It is guaranteed to work for ELISA, WB in human, mouse, rat. Our Boster guarantee will cover your intended experiment even if the sample type has not been be directly tested.
Boster Scientific Support
Answered: 2014-02-13
Question
My team were well pleased with the WB result of your anti-Osteopontin/SPP1 antibody. However we have been able to see positive staining in amniotic fluid secreted. using this antibody. Is that expected? Could you tell me where is SPP1 supposed to be expressed?
E. Banerjee
Verified customer
Asked: 2013-07-08
Answer
Based on literature, amniotic fluid does express SPP1. Generally SPP1 expresses in secreted. Regarding which tissues have SPP1 expression, here are a few articles citing expression in various tissues:
Brain, and Kidney, Pubmed ID: 15489334
Kidney, Pubmed ID: 1575754
Kidney, and Subthalamic nucleus, Pubmed ID: 14702039
Liver, Pubmed ID: 7945249, 24275569
Milk, Pubmed ID: 2736258, 15869464
Pituitary, Pubmed ID: 16807684
Placenta, Pubmed ID: 16303743
Boster Scientific Support
Answered: 2013-07-08
