Click image to see more details
-

-
-
-
-
+4
Product Info Summary
| SKU: | A02077-1 |
|---|---|
| Size: | 100 μg/vial |
| Reactive Species: | Human, Mouse, Rat |
| Host: | Rabbit |
| Application: | ELISA, WB |
Customers Who Bought This Also Bought

Product info
Product Name
Anti-Sp7/Osterix Antibody Picoband®
SKU/Catalog Number
A02077-1
Size
100 μg/vial
Form
Lyophilized
Description
Boster Bio Anti-Sp7/Osterix Antibody Picoband® catalog # A02077-1. Tested in ELISA, WB applications. This antibody reacts with Human, Mouse, Rat. The brand Picoband indicates this is a premium antibody that guarantees superior quality, high affinity, and strong signals with minimal background in Western blot applications. Only our best-performing antibodies are designated as Picoband, ensuring unmatched performance.
Storage & Handling
Store at -20˚C for one year from date of receipt. After reconstitution, at 4˚C for one month. It can also be aliquotted and stored frozen at -20˚C for six months. Avoid repeated freeze-thaw cycles.
Cite This Product
Anti-Sp7/Osterix Antibody Picoband® (Boster Biological Technology, Pleasanton CA, USA, Catalog # A02077-1)
Host
Rabbit
Contents
Each vial contains 4mg Trehalose, 0.9mg NaCl and 0.2mg Na2HPO4.
Clonality
Polyclonal
Isotype
Rabbit IgG
Immunogen
E.coli-derived human Sp7/Osterix recombinant protein (Position: A2-E241).
Cross-reactivity
No cross-reactivity with other proteins.
Reactive Species
A02077-1 is reactive to SP7 in Human, Mouse, Rat
Observed Molecular Weight
45 kDa
Calculated molecular weight
45.0 kDa
Background of SP7
Transcription factor Sp7, also called Osterix (Osx), is a protein that in humans is encoded by the SP7 gene. This gene encodes a member of the Sp subfamily of Sp/XKLF transcription factors. Sp family proteins are sequence-specific DNA-binding proteins characterized by an amino-terminal trans-activation domain and three carboxy-terminal zinc finger motifs. This protein is a bone specific transcription factor and is required for osteoblast differentiation and bone formation.
Antibody Validation
Boster validates all antibodies on WB, IHC, ICC, Immunofluorescence, and ELISA with known positive control and negative samples to ensure specificity and high affinity, including thorough antibody incubations.
Application & Images
Applications
A02077-1 is guaranteed for ELISA, WB Boster Guarantee
Recommend Dilution
| Application | Dilution | Species |
|---|---|---|
| Western blot | 0.25-0.5μg/ml | Human, Mouse, Rat |
| ELISA | 0.1-0.5μg/ml | - |
Tested application
Suggested blocking solution with 5% non-fat milk or BSA; (*)Recommended protein loading: 20-40 µg per lane
Validation Images & Assay Conditions
Click image to see more details
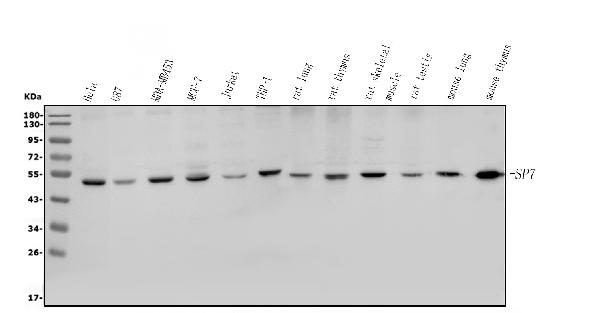
Western blot analysis of Sp7/Osterix using anti-Sp7/Osterix antibody (A02077-1).
Electrophoresis was performed on a 5-20% SDS-PAGE gel at 70V (Stacking gel) / 90V (Resolving gel) for 2-3 hours. The sample well of each lane was loaded with 50ug of sample under reducing conditions.
Lane 1: human HELA whole cell lysates,
Lane 2: human U87 whole cell lysates,
Lane 3: human MDA-MB453 whole cell lysates,
Lane 4: human MCF-7 whole cell lysates,
Lane 5: human Jurkat whole cell lysates,
Lane 6: human THP-1 whole cell lysates.
Lane 7: rat lung tissue lysates,
Lane 8: rat thymus tissue lysates,
Lane 9: rat skeletal muscle tissue lysates,
Lane 10: rat testis tissue lysates,
Lane 11: mouse lung tissue lysates,
Lane 12: mouse thymus tissue lysates.
After Electrophoresis, proteins were transferred to a Nitrocellulose membrane at 150mA for 50-90 minutes. Blocked the membrane with 5% Non-fat Milk/ TBS for 1.5 hour at RT. The membrane was incubated with rabbit anti-Sp7/Osterix antigen affinity purified polyclonal antibody (Catalog # A02077-1) at 0.5 μg/mL overnight at 4°C, then washed with TBS-0.1%Tween 3 times with 5 minutes each and probed with a goat anti-rabbit IgG-HRP secondary antibody at a dilution of 1:5000 for 1.5 hour at RT. The signal is developed using an Enhanced Chemiluminescent detection (ECL) kit (Catalog # EK1002) with Tanon 5200 system. A specific band was detected for Sp7/Osterix at approximately 45KD. The expected band size for Sp7/Osterix is at 45KD.

Click image to see more details
KCNMA1-AS1 is upregulated when hBMSCs undergo osteogenic differentiation. A- Differentially expressed lncRNAs analyzed by qPCR after 14 days of osteogenic induction. B- Relative expression levels of KCNMA1-AS1 were measured using qPCR, and Glyceraldehyde 3-phosphate dehydrogenase (GAPDH) was used for normalization. C-F- Relative mRNA levels of COL1A1 ( C ), RUNX2 ( D ), OSX ( E ), and OPN ( F ) measured through qPCR, normalized to GAPDH. G and H- The protein levels of COL1A1, RUNX2, OSX, and OPN were detected by western blot. The internal reference is GAPDH. I and J- ALP staining ( I ) and ALP activity ( J ). hBMSCs cultured in osteogenic medium (OM) or growth medium (GM) for a week. Scale bar of microscopic images, 100 μm. K and L- ARS staining ( K ) and ARS quantification ( L ). hBMSCs were grown in an osteogenic medium (OM) or growth medium (GM) for two weeks. Scale bar of microscopical images, 100 μm. M-O- Correlation of the expression of KCNMA1-AS1 with that of COL1A1 ( M ), RUNX2 ( N ), and OSX ( O ) during osteogenic differentiation. ns: not significant, * P < 0.05, ** P < 0.01, *** P < 0.001, **** P < 0.0001, compared with 0 day/GM.
Index in PubMed under a CC BY license. PMID: 38017487

Click image to see more details
KCNMA1-AS1 promotes osteogenic differentiation of hBMSCs in vitro. A- Transfection efficiency of KCNMA1-AS1 overexpression and KCNMA1-AS1 knockdown was measured by qPCR, normalized to GAPDH. B-E- Relative mRNA levels of COL1A1 ( B ), RUNX2 ( C ), OSX ( D ), and OPN ( E ) in hBMSCs transfected with lentivirus measured by qPCR after one week of osteogenic induction, normalized to GAPDH. F and G- The protein levels of COLA1, RUNX2, OSX, and OPN in hBMSCs transfected with lentivirus detected by western blot after one week of osteogenic induction. GAPDH was used as the internal reference. H and I ALP staining ( H ) and ALP activity ( I ) in hBMSCs transfected with lentivirus after one week of osteogenic induction. Scale bar of microscopical images, 100 μm. J and K- ARS staining ( J ) and ARS quantification ( K ) in hBMSCs transfected with lentivirus after two weeks of osteogenic induction. Scale bar of microscopical images, 100 μm. * P < 0.05, ** P < 0.01, *** P < 0.001, **** P < 0.0001, in comparison to NC/sh-NC.
Index in PubMed under a CC BY license. PMID: 38017487

Click image to see more details
Effect of KCNMA1-AS1 on osteogenic differentiation of hBMSCs with the SMAD9 signaling pathway activation. A and B- Protein levels of total SMAD9 and p-SMAD9 in lentivirus-transfected hBMSCs treated with DMSO or LDN193189 (100nM) detected by western blot after one week of osteogenic induction. GAPDH as the internal reference. C and D- The expression levels of COL1A1, RUNX2, OSX, and OPN in lentivirus-transfected hBMSCs treated with DMSO or LDN193189 (100nM) detected by western blot after one week of osteogenic induction. GAPDH as the reference. E and F- ALP staining ( E ) and ALP activity ( F ) in lentivirus-transfected hBMSCs treated with DMSO or LDN193189 (100nM) after one week of osteogenic induction. Scale bar of microscopical images, 100 μm. G and H- ARS staining ( G ) and ARS quantification ( H ) in lentivirus-transfected hBMSCs treated with DMSO or LDN193189 (100nM) after 14 days of osteogenic induction. Scale bar of microscopical images, 100 μm. **** P < 0.0001, compared with KCNMA1-AS1 + DMSO.
Index in PubMed under a CC BY license. PMID: 38017487

Click image to see more details
LNC01485 expression was up-regulated during osteogenic differentiation of hBMSCs. (A, C) ALP staining (A) and ALP activity assay (C) of hBMSCs before osteogenic induction and 7 days after induction. (B, D) hBMSCs were stained with Alizarin Red S (B) before osteogenic induction and at 14 days after induction, and the staining results were analyzed semi-quantitatively (D) . (E-I) The protein expression levels of RUNX2 (E, F) , COL1A1 (E, G) , OSX (E, H) , and OPN (E, I) level on Days 0, 7, 14, and 21 of osteogenic induction were detected by Western blot and quantified analysis by normalized to GAPDH. (J-O) The mRNA expression levels of RUNX2 (J) , OPN (K) , OCN (L) , COL1A1 (M) , OSX (N) , and LINC01485 (O) before and after osteogenic differentiation were determined by qRT-PCR. (P-R) Expression correlation analysis between LINC01485 and osteogenic genes RUNX2 (P) , OPN (Q) , and OCN (R) during osteogenic differentiation. * p < 0.05, ** p < 0.01, *** p < 0.001.
Index in PubMed under a CC BY license. PMID: 35663324

Click image to see more details
LINC01485 regulates osteogenic differentiation of hBMSCs. (A, B) The overexpression (A) and interference (B) efficiency of LINC01485 was determined by qRT-PCR in hBMSCs after transduction with LV-LINC01485 and sh-LINC01485. (C–F) The mRNA levels of RUNX2 (C) , COL1A1 (D) , OSX (E) , and OCN (F) after 14 days of osteogenic induction in hBMSC infected with lentivirus by qRT-PCR. (G, H) Western blot analysis of the RUNX2 (G, I) , COL1A1 (G, I) , OSX (G, J) , and OPN (G, K) protein expression in hBMSCs infected with lentivirus after osteogenic induction 14 days later and the corresponding gray value quantitative analysis. (L, M) ALP staining (L) and ALP activity (M) of hBMSC cells infected with lentivirus after 7 days of osteogenic induction. (N, O) Alizarin Red S staining (N) and semi-quantitative analysis (O) of infected hBMSCs with lentivirus after 14 days osteogenic induction. * p < 0.05, ** p < 0.01, *** p < 0.001.
Index in PubMed under a CC BY license. PMID: 35663324

Click image to see more details
MiR-619-5p is down-regulated and inhibits osteogenesis during osteogenic induction of hBMSCs. (A) The relative expression levels of miR-619-5p before and after osteogenic differentiation were determined by qRT-PCR. (B) Correlation analysis of LINC01485 and miR-619-5p expression levels during osteogenic differentiation. (C, D) The mRNA level of miR-619-5p in hBMSCs transfected with miR-199a-5p mimic (C) and miR-199a-5p inhibitor (D) by qRT-PCR. (E–I) Western blot analysis of the RUNX2 (E, F) , COL1A1 (E, G) , OSX (E, H) , and OPN (E, I) protein expression in hBMSCs transfected with miR-619-5p mimic, miRNA mimic NC, miR-619-5p inhibitor, and miRNA inhibitor NC after osteogenic induction and the corresponding gray value quantitative analysis. (J) ALP staining analysis of hBMSCs transfected with miR-619-5p mimic, miRNA mimic NC, miR-619-5p inhibitor, and miRNA inhibitor NC after osteogenic induction. * p < 0.05, ** p < 0.01, *** p < 0.001.
Index in PubMed under a CC BY license. PMID: 35663324

Click image to see more details
LINC01485 acts as a ceRNA of miR-619-5p to regulate RUNX2 and osteogenic differentiation. (A–E) Western blot analysis of the RUNX2 (A, B) , COL1A1 (A, C) , OSX (A, D) , and OPN (A, E) protein expression in hBMSCs infected with sh-NC or sh-LINC01485 lentivirus along with miRNA inhibitor NC or miR-619-5p inhibitor after osteogenic induction and the corresponding gray value quantitative analysis. (F) ALP staining analysis of hBMSCs infected with sh-NC or sh-LINC01485 lentivirus along with miRNA inhibitor NC or miR-619-5p inhibitor after osteogenic induction. (G) ALP staining analysis of hBMSCs infected with LV-NC or LV-LINC01485 lentivirus along with miRNA mimic NC or miR-619-5p mimic after osteogenic induction. (H) Luciferase activity of RUNX2-WT upon transfection of pcDNA3.1, pcDNA3.1-LINC01485, or miR-619-5p mimic into HEK293T cells. ns, none significance. * p < 0.05, ** p < 0.01, *** p < 0.001.
Index in PubMed under a CC BY license. PMID: 35663324
Specific Publications For Anti-Sp7/Osterix Antibody Picoband® (A02077-1)
Loading publications
Recommended Resources
Here are featured tools and databases that you might find useful.
- Boster's Pathways Library
- Protein Databases
- Bioscience Research Protocol Resources
- Data Processing & Analysis Software
- Photo Editing Software
- Scientific Literature Resources
- Research Paper Management Tools
- Molecular Biology Software
- Primer Design Tools
- Bioinformatics Tools
- Phylogenetic Tree Analysis
Customer Reviews
Have you used Anti-Sp7/Osterix Antibody Picoband®?
Share your experimental results or join a short interview to earn up to $1,000 in product credits or other rewards.
0 Reviews For Anti-Sp7/Osterix Antibody Picoband®
Customer Q&As
Have a question?
Find answers in Q&As, reviews.
Can't find your answer?
Submit your question
