Click image to see more details
-

-
-
-
-
+2
Product Info Summary
| SKU: | A01678-2 |
|---|---|
| Size: | 100 μg/vial |
| Reactive Species: | Human, Mouse, Rat |
| Host: | Rabbit |
| Application: | ELISA, Flow Cytometry, WB |
Customers Who Bought This Also Bought

Product info
Product Name
Anti-SREBP2/SREBF2 Antibody Picoband®
SKU/Catalog Number
A01678-2
Size
100 μg/vial
Form
Lyophilized
Description
Boster Bio Anti-SREBP2/SREBF2 Antibody Picoband® catalog # A01678-2. Tested in ELISA, Flow Cytometry, WB applications. This antibody reacts with Human, Mouse, Rat. The brand Picoband indicates this is a premium antibody that guarantees superior quality, high affinity, and strong signals with minimal background in Western blot applications. Only our best-performing antibodies are designated as Picoband, ensuring unmatched performance.
Storage & Handling
At -20°C for one year from date of receipt. After reconstitution, at 4°C for one month. It can also be aliquotted and stored frozen at -20°C for six months. Avoid repeated freezing and thawing.
Cite This Product
Anti-SREBP2/SREBF2 Antibody Picoband® (Boster Biological Technology, Pleasanton CA, USA, Catalog # A01678-2)
Host
Rabbit
Contents
Each vial contains 4 mg Trehalose, 0.9 mg NaCl, 0.2 mg Na2HPO4.
Clonality
Polyclonal
Isotype
Rabbit IgG
Immunogen
E.coli-derived human SREBP2/SREBF2 recombinant protein (Position: R371-L409).
Cross-reactivity
No cross-reactivity with other proteins.
Reactive Species
A01678-2 is reactive to SREBF2 in Human, Mouse, Rat
Observed Molecular Weight
68 kDa
Calculated molecular weight
123.7 kDa
Background of SREBF2
Sterol regulatory element-binding protein 2 (SREBP-2) also known as sterol regulatory element binding transcription factor 2 (SREBF2) is a protein that in humans is encoded by the SREBF2 gene. This gene encodes a member of the a ubiquitously expressed transcription factor that controls cholesterol homeostasis by regulating transcription of sterol-regulated genes. The encoded protein contains a basic helix-loop-helix-leucine zipper (bHLH-Zip) domain and binds the sterol regulatory element 1 motif. Alternate splicing results in multiple transcript variants.
Antibody Validation
Boster validates all antibodies on WB, IHC, ICC, Immunofluorescence, and ELISA with known positive control and negative samples to ensure specificity and high affinity, including thorough antibody incubations.
Application & Images
Applications
A01678-2 is guaranteed for ELISA, Flow Cytometry, WB Boster Guarantee
Recommend Dilution
| Application | Dilution | Species |
|---|---|---|
| Western blot | 0.25-0.5 μg/ml | Human, Mouse, Rat |
| Flow Cytometry (Fixed) | 1-3 μg/1x106 cells | Human, Rat |
| ELISA | 0.1-0.5 μg/ml | - |
Tested application
Suggested blocking solution with 5% non-fat milk or BSA; (*)Recommended protein loading: 20-40 µg per lane
Validation Images & Assay Conditions
Click image to see more details
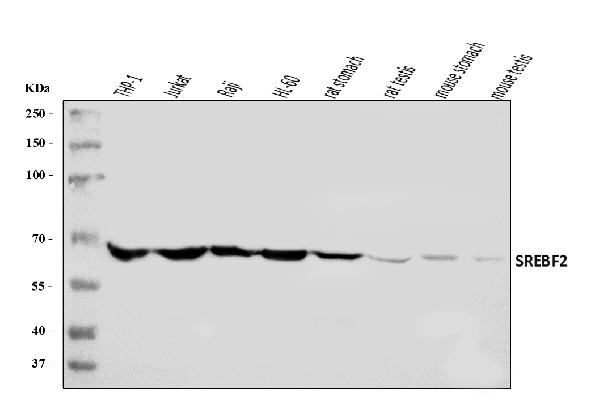
Western blot analysis of SREBP2/SREBF2 using anti-SREBP2/SREBF2 antibody (A01678-2).
Electrophoresis was performed on a 5-20% SDS-PAGE gel at 70V (Stacking gel) / 90V (Resolving gel) for 2-3 hours. The sample well of each lane was loaded with 30 ug of sample under reducing conditions.
Lane 1: human THP-1 whole cell lysates,
Lane 2: human Jurkat whole cell lysates,
Lane 3: human Raji whole cell lysates,
Lane 4: human HL-60 whole cell lysates,
Lane 5: rat stomach tissue lysates,
Lane 6: rat testis tissue lysates,
Lane 7: mouse stomach tissue lysates,
Lane 8: mouse testis tissue lysates.
After electrophoresis, proteins were transferred to a nitrocellulose membrane at 150 mA for 50-90 minutes. Blocked the membrane with 5% non-fat milk/TBS for 1.5 hour at RT. The membrane was incubated with rabbit anti-SREBP2/SREBF2 antigen affinity purified polyclonal antibody (Catalog # A01678-2) at 0.5 μg/mL overnight at 4°C, then washed with TBS-0.1%Tween 3 times with 5 minutes each and probed with a goat anti-rabbit IgG-HRP secondary antibody at a dilution of 1:5000 for 1.5 hour at RT. The signal is developed using an Enhanced Chemiluminescent detection (ECL) kit (Catalog # EK1002) with Tanon 5200 system. A specific band was detected for SREBP2/SREBF2 at approximately 68 kDa. The expected band size for SREBP2/SREBF2 is at 124 kDa.

Click image to see more details
SIRT1 inhibitor EX‐527 increased M1‐like macrophage and lipid accumulation by EGCG in the model cells. (A) Determination of the optimal concentration of EX‐527. n = 3. (B) Representative WB images and quantitative analysis of the level of iNOS, Arg‐1, SIRT1, IL‐4, P‐STAT6, and P‐AKT1 in the RAW264.7 cells. n = 3 (C) Representative WB images and quantitative analysis of the level of SREBP‐1 and SREBP‐2 in the MPC5 cells. n = 3. (D) Levels of TNF‐α, IL‐18, and IL‐1β in supernatant. n = 6. (E, F) Levels of IL‐4 and IL‐10 in supernatant. n = 6. Compared with the CON group, a p < 0.05; compared with the MOD group, b p < 0.05; compared with the EGCG group, c p < 0.05.
Index in PubMed under a CC BY license. PMID: 40801050

Click image to see more details
TP improved podocyte lipid accumulation and injury in the aging with DKD model rats. (A) Representative TEM images of podocytes in kidney tissues of rats. 20,000×, n = 3. (B) Representative immunofluorescence colocalization images of SYNPO (green fluorescence) and Adipophilin (red fluorescence). 400×, n = 3. (C) The analysis of mean fluorescence density ratio of Adipophilin to SYNPO assay from each group of rats. (D) Representative WB images and quantification of the expression of Nephrin and Podocin. n = 6. (E) Representative WB images and quantification of the expression of SREBP‐1 and SREBP‐2. n = 6. Compared with the CON group, a p < 0.05; compared with the MOD group, b p < 0.05; compared with the TP‐L group, c p < 0.05; compared with the TP‐M group, d p < 0.05.
Index in PubMed under a CC BY license. PMID: 40801050

Click image to see more details
SIRT1 agonist SRT1720 increased M2‐like macrophage and decreased lipid deposition by EGCG in the model cells. (A) Determination of the optimal concentration of SRT1720 ( n = 3). (B) Representative WB images and quantitative analysis of the level of iNOS, Arg‐1, SIRT1, IL‐4, P‐STAT6, and P‐AKT1 in the RAW264.7 cells ( n = 3). (C) Representative WB images and quantitative analysis of the level of SREBP‐1 and SREBP‐2 in the MPC5 cells ( n = 3). (D) Levels of TNF‐α, IL‐18, and IL‐1β in supernatant ( n = 6). (E, F) Levels of IL‐4 and IL‐10 in supernatant ( n = 6). Compared with the CON group, a p < 0.05; compared with the MOD group, b p < 0.05; compared with the EGCG group, c p < 0.05.
Index in PubMed under a CC BY license. PMID: 40801050

Click image to see more details
Flow Cytometry analysis of K562 cells using anti-SREBP2/SREBF2 antibody (A01678-2).
Overlay histogram showing K562 cells stained with A01678-2 (Blue line). To facilitate intracellular staining, cells were fixed with 4% paraformaldehyde and permeabilized with permeabilization buffer. The cells were blocked with 10% normal goat serum. And then incubated with rabbit anti-SREBP2/SREBF2 Antibody (A01678-2, 1 μg/1x106 cells) for 30 min at 20°C. DyLight®488 conjugated goat anti-rabbit IgG (BA1127, 5-10 μg/1x106 cells) was used as secondary antibody for 30 minutes at 20°C. Isotype control antibody (Green line) was rabbit IgG (1 μg/1x106) used under the same conditions. Unlabelled sample without incubation with primary antibody and secondary antibody (Red line) was used as a blank control.

Click image to see more details
Flow Cytometry analysis of RH35 cells using anti-SREBP2/SREBF2 antibody (A01678-2).
Overlay histogram showing RH35 cells stained with A01678-2 (Blue line). To facilitate intracellular staining, cells were fixed with 4% paraformaldehyde and permeabilized with permeabilization buffer. The cells were blocked with 10% normal goat serum. And then incubated with rabbit anti-SREBP2/SREBF2 Antibody (A01678-2, 1 μg/1x106 cells) for 30 min at 20°C. DyLight®488 conjugated goat anti-rabbit IgG (BA1127, 5-10 μg/1x106 cells) was used as secondary antibody for 30 minutes at 20°C. Isotype control antibody (Green line) was rabbit IgG (1 μg/1x106) used under the same conditions. Unlabelled sample without incubation with primary antibody and secondary antibody (Red line) was used as a blank control.
Specific Publications For Anti-SREBP2/SREBF2 Antibody Picoband® (A01678-2)
Loading publications
Recommended Resources
Here are featured tools and databases that you might find useful.
- Boster's Pathways Library
- Protein Databases
- Bioscience Research Protocol Resources
- Data Processing & Analysis Software
- Photo Editing Software
- Scientific Literature Resources
- Research Paper Management Tools
- Molecular Biology Software
- Primer Design Tools
- Bioinformatics Tools
- Phylogenetic Tree Analysis
Customer Reviews
Have you used Anti-SREBP2/SREBF2 Antibody Picoband®?
Share your experimental results or join a short interview to earn up to $1,000 in product credits or other rewards.
0 Reviews For Anti-SREBP2/SREBF2 Antibody Picoband®
Customer Q&As
Have a question?
Find answers in Q&As, reviews.
Can't find your answer?
Submit your question
