Click image to see more details
-

-
-
-
-
+5
Product Info Summary
| SKU: | M00019-4 |
|---|---|
| Size: | 100 μl/vial |
| Reactive Species: | Human |
| Host: | Rabbit |
| Application: | WB |
Customers Who Bought This Also Bought

Product info
Product Name
Anti-TGF beta 1 Rabbit Monoclonal Antibody
SKU/Catalog Number
M00019-4
BM4876 is an alternative SKU for this antibody, used in previous lots.
Size
100 μl/vial
Form
Liquid
Description
Boster Bio Anti-TGF beta 1 Rabbit Monoclonal Antibody catalog # M00019-4. Tested in WB application. This antibody reacts with Human.
Storage & Handling
Store at -20°C for one year. For short term storage and frequent use, store at 4°C for up to one month. Avoid repeated freeze-thaw cycles.
Cite This Product
Anti-TGF beta 1 Rabbit Monoclonal Antibody (Boster Biological Technology, Pleasanton CA, USA, Catalog # M00019-4)
Host
Rabbit
Contents
Rabbit IgG in stabilizing components, phosphate buffered saline, pH 7.4, 150mM NaCl, 0.02% sodium azide and 50% glycerol.
*This antibody is supplied in a stabilized formulation.
Compatibility with conjugation reactions depends on the chemistry of the conjugation method used.
For conjugation methods that are not compatible with the stabilizing components present in this formulation, a carrier-free antibody format is required.
Clonality
Monoclonal
Clone Number
17T29
Isotype
IgG
Immunogen
A synthesized peptide derived from human TGF beta 1
Reactive Species
M00019-4 is reactive to TGFB1 in Human
Observed Molecular Weight
48 kDa
Calculated molecular weight
44.3 kDa
Antibody Validation
Boster validates all antibodies on WB, IHC, ICC, Immunofluorescence, and ELISA with known positive control and negative samples to ensure specificity and high affinity, including thorough antibody incubations.
Application & Images
Applications
M00019-4 is guaranteed for WB Boster Guarantee
Recommend Dilution
WB 1:500-2000
Validation Images & Assay Conditions
Click image to see more details
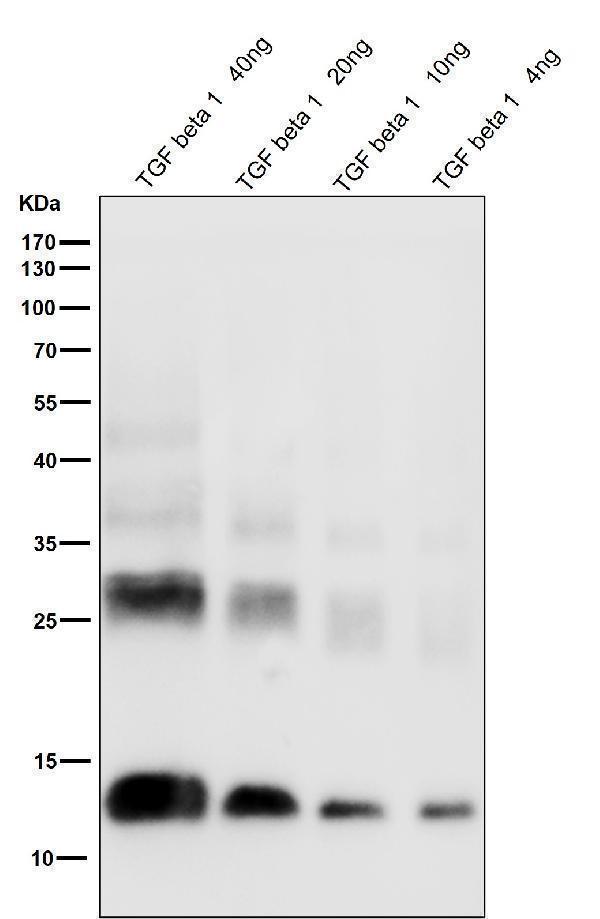
All lanes use the Antibody at 1:1W dilution for 1 hour at room temperature.

Click image to see more details
The prognosis of gastric adenocarcinoma suggests that TGFβ1 has great potential. a The pan cancer expression of TGFβ1 in the TCGA database. b The pan cancer expression of TGFβ1 in paired samples in the TCGA database. c The expression of TGFβ1 in the dataset. d The expression of TGFβ1 in the dataset. e T staging results of TGFβ1. f The differential expression of TGFβ1 in the quality of life of different patients. g Comparing the prognosis between high and low TGFβ1 groups based on the g KM survival curve. h Analyze the predictive accuracy and efficacy of TGFβ1 in GC queue diagnosis. i Diagnostic prediction of TGFβ1 in different T stages of GC queue. *p<0.05, **p<0.01, ***p<0.001.
Index in PubMed under a CC BY license. PMID: 39991579

Click image to see more details
The association between TGFβ1 and the immune microenvironment associated with GC tumors. a TGFβ1 pan cancer status and tumor associated immune cell correlation heatmap in TCGA database. b The expression of cell markers in the dataset. c GC tumor associated immune cells and TGFβ1 correlation bar chart. d Box plot of the correlation between TGFβ1 differential expression group and macrophages. e Scatter plot showing the association between TGFβ1 and macrophages. f The correlation results between TGFβ1 and GC immune infiltrating cells in TIMER database. g Correlation heatmap between TGFβ1 and macrophage subtypes. *p<0.05, **p<0.01, ***p<0.001.
Index in PubMed under a CC BY license. PMID: 39991579

Click image to see more details
There is a close correlation between TGFβ1 and polarization of M2c macrophages. a The expression results of different biomarkers in the dataset. b The expression results of different biomarkers in the dataset. c The expression results of different biomarkers in the dataset. d Heat map of the association between TGFβ1 and different subtypes of macrophages. e The relationship between TGFβ1 and different subtypes of macrophage marker networks. *p<0.05, **p<0.01, ***p<0.001.
Index in PubMed under a CC BY license. PMID: 39991579

Click image to see more details
Different inducers promote polarization of different subtypes of macrophages. a The CCK-8 method was used to detect the survival of M0 macrophages after 24 h of IL-4 intervention. b The CCK-8 method was used to detect the survival of M0 macrophages after 24 h of intervention with TGFβ1. c The CCK-8 method was used to detect the survival of M0 macrophages after LPS intervention for 24 h. d RT-qPCR was used to detect the expression of CD86 mRNA. e RT-qPCR was used to detect the expression of iNOS mRNA. f RT-qPCR was used to detect the expression of CD206 mRNA. g RT-qPCR was used to detect the expression of IL1R2 mRNA. h RT-qPCR was used to detect the expression of CD163 mRNA. i RT-qPCR was used to detect the expression of TGFβ mRNA. j ELISA detects TNF - α levels. k ELISA was used to detect IL-10 levels. l ELISA detects the content of TGFβ1. m The WB results of different interventions on histone expression. f TNF-α protein expression results. f IL-10 protein expression results. f TGFβ1 protein expression results. *p<0.05, **p<0.01, ***p<0.001.
Index in PubMed under a CC BY license. PMID: 39991579

Click image to see more details
M2c macrophages increase ferroptosis resistance in gastric cancer cells. a The CCK-8 method was used to detect the survival of gastric cancer cells (Hgc27 and MKN45) intervened with RSL3 for 24 h. b The CCK-8 method was used to detect the survival of gastric cancer cells (Hgc27 and MKN45) intervened with Fer-1 for 24 h. c The expression of SOD in different intervention groups. d The expression of MDA in different intervention groups. e The expression of GSH in different intervention groups. f The expression of TGFβ1 protein WB in different cell lines. g The expression results of TGFβ1 protein. h The expression of key ferroptosis proteins WB in different cell lines. i The expression results of FSP1 protein. j Expression results of DHODH protein. k Expression results of GPX4 protein. l SLC7A11 protein expression results. m The intervention of RSL3 on the expression of key ferroptosis protein WB in different co culture groups. n The expression results of GPX4 protein. o SLC7A11 protein expression results. p The WB expression of key proteins involved in ferroptosis in different intervention groups. q The expression results of GPX4 protein. r The expression results of SLC7A11 protein. s Fluorescence results of mitochondrial membrane potential in different intervention groups. Scale bar=50 μm. *p<0.05, **p<0.01, ***p<0.001.
Index in PubMed under a CC BY license. PMID: 39991579

Click image to see more details
The effect of M2 subtype macrophages on TGFβ1 related pathway and epithelial mesenchymal transition in gastric cancer cells. a Cell intervention pattern diagram. b RT-qPCR was used to detect the levels of TGFβ mRNA in different intervention groups. c ELISA was used to test the expression of TNF-α in different intervention groups. d ELISA test the expression of IL-10 in different intervention groups. e ELISA was used to test the expression of TGFβ1 in different intervention groups. f The expression results of TGFβ1 protein. g The WB results of different interventions on histone expression. h The expression results of p-Smad2 protein. i The expression results of Smad2 protein. j The expression results of p-Smad3 protein. k The expression results of Smad3 protein. l The expression results of E-cadherin protein. m Results of N-cadherin protein expression. n Results of Vimentin protein expression. o RT-qPCR was used to detect the content of TGFβ mRNA at different intervention times. p ELISA was used to test the expression of TNF-α at different intervention times. q ELISA test the expression of IL-10 at different intervention times. r ELISA was used to test the expression of TGFβ1 at different intervention times. s WB results of protein expression at different intervention times. t The expression results of E-cadherin protein. u The expression results of N-cadherin protein. v Results of Vimentin protein expression. w Fluorescence results of mitochondrial membrane potential at different intervention times. Scale bar=50 μm. *p<0.05, **p<0.01, ***p<0.001.
Index in PubMed under a CC BY license. PMID: 39991579

Click image to see more details
The role of gastric cancer cells in transforming macrophages in the TME. a The expression of M1 macrophage marker proteins in different groups. b The expression of M2 macrophage marker proteins in different groups. c Differential gene expression between M0 and gastric cancer cell metabolite intervention group. d Differential gene expression between M2 and gastric cancer cell metabolite intervention group. e Intersection statistics of differentially expressed genes between M2 and gastric cancer cell metabolite intervention group. f Intersection gene enrichment statistics. g RT-qPCR was used to detect the expression of CD86 mRNA. h RT-qPCR was used to detect the expression of iNOS mRNA. i RT-qPCR was used to detect the expression of CD206 mRNA. j RT-qPCR was used to detect the expression of IL1R2 mRNA. k RT-qPCR was used to detect the expression of CD163 mRNA. l RT-qPCR was used to detect the expression of TGFβ mRNA. m ELISA was used to detect TNF-α levels. n ELISA detects IL-10 levels. o ELISA detects the content of TGFβ1. *p<0.05; **p<0.01; ***p<0.001.
Index in PubMed under a CC BY license. PMID: 39991579

Click image to see more details
Western blot analysis of TGF beta 1 expression in A549 lysate.
Specific Publications For Anti-TGF beta 1 Rabbit Monoclonal Antibody (M00019-4)
Loading publications
Recommended Resources
Here are featured tools and databases that you might find useful.
- Boster's Pathways Library
- Protein Databases
- Bioscience Research Protocol Resources
- Data Processing & Analysis Software
- Photo Editing Software
- Scientific Literature Resources
- Research Paper Management Tools
- Molecular Biology Software
- Primer Design Tools
- Bioinformatics Tools
- Phylogenetic Tree Analysis
Customer Reviews
Have you used Anti-TGF beta 1 Rabbit Monoclonal Antibody?
Share your experimental results or join a short interview to earn up to $1,000 in product credits or other rewards.
0 Reviews For Anti-TGF beta 1 Rabbit Monoclonal Antibody
Customer Q&As
Have a question?
Find answers in Q&As, reviews.
Can't find your answer?
Submit your question
