Click image to see more details
-

-
-
-
-
+4
Product Info Summary
| SKU: | M00224 |
|---|---|
| Size: | 100 μl |
| Reactive Species: | Human |
| Host: | Rabbit |
| Application: | Flow Cytometry, IF, IHC, ICC, WB |
Customers Who Bought This Also Bought

Product info
Product Name
Anti-TNFAIP3/A20 Rabbit Monoclonal Antibody
SKU/Catalog Number
M00224
BM4599 is an alternative SKU for this antibody, used in previous lots.
Size
100 μl
Form
Liquid
Description
Boster Bio Anti-TNFAIP3/A20 Rabbit Monoclonal Antibody catalog # M00224. Tested in WB, IHC, ICC/IF, Flow Cytometry applications. This antibody reacts with Human.
Storage & Handling
Store at -20°C for one year. For short term storage and frequent use, store at 4°C for up to one month. Avoid repeated freeze-thaw cycles.
Cite This Product
Anti-TNFAIP3/A20 Rabbit Monoclonal Antibody (Boster Biological Technology, Pleasanton CA, USA, Catalog # M00224)
Host
Rabbit
Contents
Rabbit IgG in stabilizing components, phosphate buffered saline, pH 7.4, 150mM NaCl, 0.02% sodium azide and 50% glycerol.
*This antibody is supplied in a stabilized formulation.
Compatibility with conjugation reactions depends on the chemistry of the conjugation method used.
For conjugation methods that are not compatible with the stabilizing components present in this formulation, a carrier-free antibody format is required.
Clonality
Monoclonal
Clone Number
GCO-20
Isotype
Rabbit IgG
Immunogen
A synthesized peptide derived from human TNFAIP3
Reactive Species
M00224 is reactive to TNFAIP3 in Human
Observed Molecular Weight
82 kDa
Calculated molecular weight
89.6 kDa
Antibody Validation
Boster validates all antibodies on WB, IHC, ICC, Immunofluorescence, and ELISA with known positive control and negative samples to ensure specificity and high affinity, including thorough antibody incubations.
Application & Images
Applications
M00224 is guaranteed for Flow Cytometry, IF, IHC, ICC, WB Boster Guarantee
Recommend Dilution
WB 1:500-2000
IHC 1:50-200
ICC/IF 1:50-200
FC 1:20
Tested application
Suggested blocking solution with 5% non-fat milk or BSA; (*)Recommended protein loading: 20-40 µg per lane
Use TE buffer pH 9.0 for antigen retrieval; (*) citrate buffer pH 6.0 is an alternative.
Validation Images & Assay Conditions
Click image to see more details
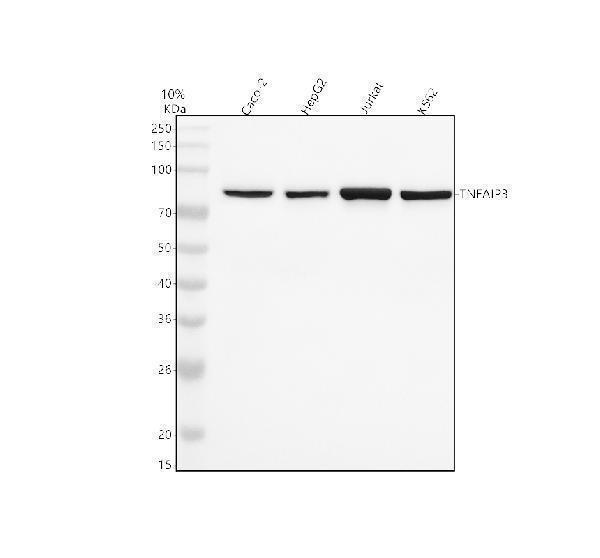
Western blot analysis of TNFAIP3 using anti-TNFAIP3 antibody (M00224).
Electrophoresis was performed on a 10% SDS-PAGE gel at 80V (Stacking gel) / 120V (Resolving gel) for 2 hours. The sample well of each lane was loaded with 30 ug of sample under reducing conditions.
Lane 1: human Caco-2 whole cell lysates,
Lane 2: human HepG2 whole cell lysates,
Lane 3: human Jurkat whole cell lysates,
Lane 4: human K562 whole cell lysates.
After electrophoresis, proteins were transferred to a nitrocellulose membrane at 150 mA for 50-90 minutes. Blocked the membrane with 5% non-fat milk/TBS for 1.5 hour at RT. The membrane was incubated with rabbit anti-TNFAIP3 antigen affinity purified monoclonal antibody (M00224) at 1:1000 overnight at 4°C, then washed with TBS-0.1%Tween 3 times with 5 minutes each and probed with a goat anti-rabbit IgG-HRP secondary antibody at a dilution of 1:5000 for 1.5 hour at RT. The signal is developed using an ECL Plus Western Blotting Substrate (Catalog # AR1196-200) with Tanon 5200 system. A specific band was detected for TNFAIP3 at approximately 82 kDa. The expected band size for TNFAIP3 is at 90 kDa.

Click image to see more details
miR-873a-5p is upregulated, while A20 is downregulated in the spinal cord of morphine-tolerant (MT) mice. (A) Morphine-induced antinociception was assessed by the tail-flick test. Tail-flick latency was converted to MPE%. n = 8, ∗∗∗ P < 0.001 compared with the NS group. (B) Real-time qPCR showed that miR-873a-5p expression increased in the morphine group 3, 5, and 7 days after chronic morphine administration, especially on day 7 compared to the expression in the control group. Data are expressed as the mean ± SD, n = 6 mice per group, ∗∗ P < 0.01. (C) The staining of miR-873a-5p in the spinal cord, Scale bar = 100 μm. (D) Changes in the A20 protein expression level in the L4-L6 spinal cord were gradually decreased after the development of morphine tolerance, especially on day 7. n = 4 mice per group. Samples were collected on days 3, 5, and 7 following chronic morphine injection, ∗ P < 0.05, ∗∗ P < 0.01. (E) miR-873a-5p was assessed by in situ hybridization and staining of miR-873a-5p (red) with neurons (green, identified using NeuN), astrocytes (green, identified using GFAP) and microglia (green, identified using Iba1) of the spinal cord in morphine-tolerant mice. The data showed that miR-873a-5p was mainly expressed in neurons and astrocytes, whereas no expression was observed in microglia. Scale bar = 100 μm. Samples were collected on day 7 following chronic morphine injection.
Index in PubMed under a CC BY license. PMID: 31024249

Click image to see more details
miR-873a-5p directly targets the A20 3′-UTR. (A) The 3′-UTR sequences of A20 containing the miR-873a-5p target regions and the binding sites of miR-873a-5p with the target sequence are well conserved among mammals. The binding site sequence is indicated in red bold letters. (B) Diagram of the seed sequence of miR-873a-5p matching the 3′-UTR of A20. Positions of the mutated nucleotides in miR-873a-5p and the 3′-UTR of A20. (C) The decreased luciferase activity induced by transfection with miR-873a-5p mimics was completely reversed by the mutant A20 3′-UTR vector. Data are expressed as the means ± SD, ∗∗∗ P < 0.001, n = 6. (D) MiR-873a-5p costaining with A20 in the spinal cord. Samples were collected on day 7 following chronic morphine injection, n = 3, scale bars = 100 μm.
Index in PubMed under a CC BY license. PMID: 31024249

Click image to see more details
Downregulated miR-873a-5p significantly attenuates and partly reverses morphine tolerance in mice. (A) Preintrathecal injection of the miR-873a-5p antagomir for 3 consecutive days (from days 1 to 3 when morphine was injected) attenuated morphine-induced tolerance. n = 10, ∗∗∗ P < 0.001 vs. the MT + control (pre) group. (B) Postintrathecal injection of the miR-873a-5p antagomir for 3 consecutive days (from days 5 to 7 after morphine injection) significantly reversed morphine-induced analgesic tolerance. n = 8, ∗∗∗ P < 0.001 vs. the MT + control group. (C) The validation of miR-873a-5p antagomir transfection efficiency in vivo was tested by RT-qPCR. The MT + antagomir group had significantly lower miR-873a-5p expression than the MT + control group. n = 5, ∗∗∗ P < 0.001 vs. the NS group; ∗ P < 0.05 vs. the MT + control group. (D) RT-qPCR showing that miR-873a-5p antagomir administration reversed A20 mRNA expression in the spinal cord. (E,F) Western blot demonstrating that miR-873a-5p antagomir administration reversed A20 protein expression levels and downregulated p-NF-κB. n = 4, ∗∗ P < 0.01, ∗∗∗ P < 0.001 vs. the NS group; ∗ P < 0.05, ∗∗ P < 0.01 vs. the MT + control group. (G) In situ hybridization staining of miR-873a-5p in the spinal cord from the NS, MT + control and MT + antagomir groups. Images showing that miR-873a-5p expression was significantly downregulated in the mice treated with the antagomir; n = 3 mice per group, ∗∗ P < 0.01, vs. the NS group; ∗ P < 0.05 vs. the MT + control group, scale bars = 100 μm. Samples were collected 4 days after antagomir administration.
Index in PubMed under a CC BY license. PMID: 31024249

Click image to see more details
Overexpressed A20 prevents and reverses morphine tolerance in mice. (A) Mice were pretreated with the LV-control or LV-A20 vector before morphine tolerance was established. MT + LV-A20 (pre) treatment prevented the development of morphine tolerance compared with MT-LV-control (pre) treatment. n = 10, ∗∗∗ P < 0.001 compared with the MT + LV-control (pre) group. (B) Mice were injected with morphine twice a day for 15 consecutive days, and LV-control vector or LV-A20 vector was administered on day 7 after the establishment of morphine tolerance. MT + LV-A20 treatment attenuated morphine tolerance compared with MT + LV-control treatment. n = 10, ∗∗∗ P < 0.001 compared with the MT + LV-control group. (C) Image of enhanced green fluorescent immunofluorescence in the spinal cord after injection of LV-A20 or LV-control, indicating that the lentivirus was successfully transfected. n = 3, scale bars = 100 μm. (D,E) MT + LV-A20 upregulated A20 protein expression levels after lentiviral LV-A20 was injected. n = 4, ∗∗ P < 0.01 compared with the NS group, ∗∗ P < 0.01 compared with MT + LV-control. (D,F) p-NF-κB was significantly decreased when A20 was upregulated in the MT + LV-A20 group. n = 4, ∗ P < 0.05 compared with the NS group, ∗ P < 0.05 compared with MT + LV-control. Samples were collected 8 days after lentiviral vector administration.
Index in PubMed under a CC BY license. PMID: 31024249

Click image to see more details
miR-873a-5p targets A20 to participate in morphine tolerance in mice. (A) Staining of the spinal cord for A20 (green), neurons using the NeuN antibody (red), astrocytes using the GFAP antibody (red), and microglia using the Iba1 antibody (red) in morphine-tolerant mice. A20 was mainly expressed in neurons and astrocytes and barely expressed in microglia. Scale bars = 100 μm. (B) GFP was detected in HT22 cells after transfection with lentivirus LV-shA20 and LV-NC (control); scale bars = 100 μm. (C) Western blot analysis showed that A20 protein expression was significantly decreased in HT22 cells after lentivirus (LV-shA20) transfection; n = 3, ∗∗ P < 0.01 compared with the LV-NC group. (D) A20 is responsible for miR-873a-5p-mediated morphine tolerance in mice. LV-shA20 or LV-NC was intrathecally injected on day 1 with morphine injection, and the miR-873a-5p antagomir was intrathecally injected on day 9 when chronic morphine tolerance was established. MT + LV-shA20 or LV-NC was intrathecally injected 7 days before morphine was first injected, and the miR-873a-5p antagomir was intrathecally injected from days 9 to 11. n = 8, ∗∗ P < 0.01, ∗∗∗ P < 0.001 compared with the MT + LV-NC + antagomir group. ## P < 0.01, ### P < 0.001 compared with the MT + LV-shA20 + NS group.
Index in PubMed under a CC BY license. PMID: 31024249

Click image to see more details
Immunohistochemical analysis of paraffin-embedded human liver cancer, using TNFAIP3 Antibody.

Click image to see more details
Immunofluorescent analysis of Hela cells, using Histone H3 (di methyl K9) Antibody.
Specific Publications For Anti-TNFAIP3/A20 Rabbit Monoclonal Antibody (M00224)
Loading publications
Recommended Resources
Here are featured tools and databases that you might find useful.
- Boster's Pathways Library
- Protein Databases
- Bioscience Research Protocol Resources
- Data Processing & Analysis Software
- Photo Editing Software
- Scientific Literature Resources
- Research Paper Management Tools
- Molecular Biology Software
- Primer Design Tools
- Bioinformatics Tools
- Phylogenetic Tree Analysis
Customer Reviews
Have you used Anti-TNFAIP3/A20 Rabbit Monoclonal Antibody?
Share your experimental results or join a short interview to earn up to $1,000 in product credits or other rewards.
0 Reviews For Anti-TNFAIP3/A20 Rabbit Monoclonal Antibody
Customer Q&As
Have a question?
Find answers in Q&As, reviews.
Can't find your answer?
Submit your question
