Click image to see more details
-

-
-
-
-
+18
Product Info Summary
| SKU: | M00227-7 |
|---|---|
| Size: | 100 μl/vial |
| Reactive Species: | Human, Mouse, Rat |
| Host: | Mouse |
| Application: | Flow Cytometry, IP, IF, IHC, ICC, WB |
Customers Who Bought This Also Bought

Product info
Product Name
Anti-GAPDH Mouse Monoclonal Antibody
SKU/Catalog Number
M00227-7
BM3876 is an alternative SKU for this antibody, used in previous lots.
Size
100 μl/vial
Form
Liquid
Description
Boster Bio Anti-GAPDH Mouse Monoclonal Antibody catalog # M00227-7. Tested in WB, IHC, ICC/IF, IP, Flow Cytometry applications. This antibody reacts with Human, Mouse, Rat.
Storage & Handling
Store at -20°C for one year. For short term storage and frequent use, store at 4°C for up to one month. Avoid repeated freeze-thaw cycles.
Cite This Product
Anti-GAPDH Mouse Monoclonal Antibody (Boster Biological Technology, Pleasanton CA, USA, Catalog # M00227-7)
Host
Mouse
Contents
Rabbit IgG in stabilizing components, phosphate buffered saline, pH 7.4, 150mM NaCl, 0.02% sodium azide and 50% glycerol.
*This antibody is supplied in a stabilized formulation.
Compatibility with conjugation reactions depends on the chemistry of the conjugation method used.
For conjugation methods that are not compatible with the stabilizing components present in this formulation, a carrier-free antibody format is required.
Clonality
Monoclonal
Clone Number
17G14
Isotype
IgG
Immunogen
A synthesized peptide derived from human GAPDH Mouse Monoclonal
Reactive Species
M00227-7 is reactive to GAPDH in Human, Mouse, Rat
Observed Molecular Weight
36 kDa
Calculated molecular weight
36.1 kDa
Antibody Validation
Boster validates all antibodies on WB, IHC, ICC, Immunofluorescence, and ELISA with known positive control and negative samples to ensure specificity and high affinity, including thorough antibody incubations.
Application & Images
Applications
M00227-7 is guaranteed for Flow Cytometry, IP, IF, IHC, ICC, WB Boster Guarantee
Recommend Dilution
WB 1:1000-5000
IHC 1:50-200
ICC/IF 1:50-200
IP 1:50
FC 1:50
Tested application
Suggested blocking solution with 5% non-fat milk or BSA; (*)Recommended protein loading: 20-40 µg per lane
Use TE buffer pH 9.0 for antigen retrieval; (*) citrate buffer pH 6.0 is an alternative.
Validation Images & Assay Conditions
Click image to see more details
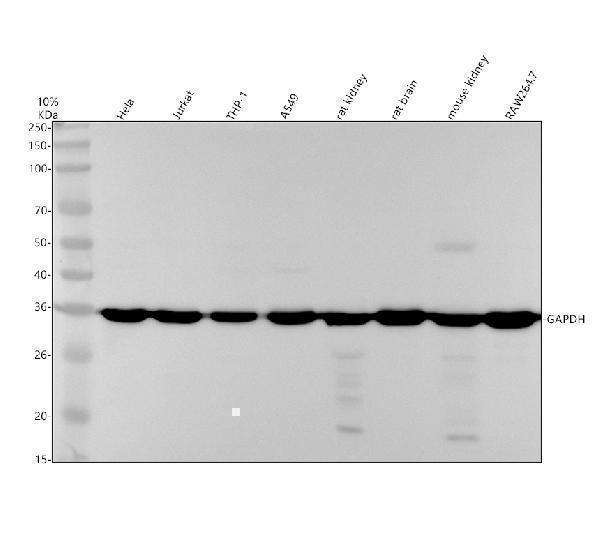
Western blot analysis of GAPDH using anti-GAPDH antibody (M00227-7).
Electrophoresis was performed on a 10% SDS-PAGE gel at 80V (Stacking gel) / 120V (Resolving gel) for 2 hours. The sample well of each lane was loaded with 30 ug of sample under reducing conditions.
Lane 1: human Hela whole cell lysates,
Lane 2: human Jurkat whole cell lysates,
Lane 3: human THP-1 whole cell lysates,
Lane 4: human A549 whole cell lysates,
Lane 5: rat kidney tissue lysates,
Lane 6: rat brain tissue lysates,
Lane 7: mouse kidney tissue lysates,
Lane 8: mouse brain tissue lysates.
After electrophoresis, proteins were transferred to a nitrocellulose membrane at 150 mA for 50-90 minutes. Blocked the membrane with 5% non-fat milk/TBS for 1.5 hour at RT. The membrane was incubated with mouse anti-GAPDH antigen affinity purified monoclonal antibody (M00227-7) at 1:1000 overnight at 4°C, then washed with TBS-0.1%Tween 3 times with 5 minutes each and probed with a goat anti-mouse IgG-HRP secondary antibody at a dilution of 1:5000 for 1.5 hour at RT. The signal is developed using an ECL Plus Western Blotting Substrate (Catalog # AR1196-200) with Tanon 5200 system. A specific band was detected for GAPDH at approximately 36 kDa. The expected band size for GAPDH is at 36 kDa.

Click image to see more details
Immunohistochemical analysis of paraffin-embedded human colon cancer, using GAPDH Mouse Monoclonal Antibody.

Click image to see more details
Immunofluorescent analysis of Hela cells, using GAPDH Mouse Monoclonal Antibody.

Click image to see more details
ROF suppresses IL-1β–induced autophagy downregulation in chondrocytes. (A) Western blots and (B) quantitative analysis of ATG5, ATG12, Beclin-1, P62-sequestosome and LC3 Ⅱ/LC3 Ⅰ in each group. (C) Fluorescence microscopy and (D) quantitative analysis of cells transfected with tandem GFP-RFP-LC3 adenovirus in each group. (E) TEM images and (F) quantitative analysis of autophagosomes in each group. Red arrow indicated autophagosome. GAPDH was employed as the internal control ( n = 3). # p < 0.05 vs. control group; * p < 0.05 vs. IL-1β group.
Index in PubMed under a CC BY license. PMID: 34122080

Click image to see more details
Autophagy inhibitor 3-MA attenuates the anti-inflammatory and anti-cartilage degradation effects of ROF in chondrocytes. (A) Western blots and (B) quantitative analysis of iNOS and COX-2 in each group. (C) Western blots and (D) quantitative analysis of collagen Ⅱ, MMP13, and ADAMTS5 in each group. GAPDH was employed as the internal control ( n = 3). # p < 0.05 vs. control group; * p < 0.05 and ** p < 0.01 vs. IL-1β group; $ p < 0.05 vs. IL-1β + ROF (20 μM) group.
Index in PubMed under a CC BY license. PMID: 34122080

Click image to see more details
Boldine inhibited RANKL-induced activation of AKT pathways in vitro . (A) BMMs were isolated from wild type mice, seeded into 6 wells at the same density (2.5 ∗ 10 3 cell/cm 2 ), treated with M-CSF for 1 day, pre-treated with DMSO or boldine (50 μM) for 2 h, then added RANKL for 0, 5, 15, 30, and 60 min. Total proteins from the cells were collected and WB was performed. (B–D) BMMs were isolated, treated with vehicle or boldine or boldine + SC79 for 4 days in the presence of M-CSF and RANKL. (B) Representative pictures of TRAP staining. Numbers (C) and area (D) of TRAP positive multinuclear osteoclasts (≥3 nuclei). (E) BMMs were pre-treated with vehicle or boldine (50 μM) for 2 h, then stimulated with RANKL in the presence of vehicle or SC79 for 30 min. Cells were collected and WB for P-AKT, AKT and GAPDH was performed. All data: mean ± SD, n = 3. ∗ p < 0.05, ∗∗ p < 0.01, and ∗∗∗ p < 0.001.
Index in PubMed under a CC BY license. PMID: 30271347

Click image to see more details
Knockdown of Neat1 improves muscle growth in vivo. a The injection scheme for LV3-sh Neat1 or LV3-shNC particles into the right or left hindlimb muscles of C57 mice. The injection was given every one week for one month. b qPCR results showing that Neat1 expression was reduced after LV3-sh Neat1 particle injection, while the mRNA expression of Myog , Myhc , α-actin , and Tnni2 was significantly increased after LV3-sh Neat1 particle injection. c Western blotting analysis showing that the protein expression of Myog, Myhc, α-actin, and Tnni2 was increased after LV3-sh Neat1 particle injection. The protein levels of these genes were quantified using ImageJ software. d Representative photograph of the three muscles from the right or left hindlimbs showing that the volume of the Qu, TA, and Gas muscles of the right hindlimb were larger than those of the left hindlimb. e Quantification of the weight of three muscles from the right or left hindlimbs of 12 injected mice showing that the weight of the Qu, TA, and Gas muscles of the right hindlimb were higher than those of the left hindlimb. f Representative photograph of myosin immunofluorescence staining in Qu, TA, and Gas muscles from the right or left hindlimb following injection with LV3-sh Neat1 or LV3-shNC particles. Compared with LV3-shNC particle injection, LV3-sh Neat1 particle injection increased the average cross-sectional areas of the indicated muscles. The fiber sizes of the Qu, TA, and Gas muscles were quantified using ImageJ. Relative RNA and protein levels were normalized to those of Gapdh. All values represent the mean ± s.d. of three independent experiments. * p < 0.05, ** p < 0.01
Index in PubMed under a CC BY license. PMID: 31243262

Click image to see more details
The RIPK1/toll-like receptor 4 (TLR4) pathway attenuates chondrocyte degeneration induced by Nec-1. (A,B) The expression levels of MMPs, ADAMTs5, and stromal cell-derived factor-1 (SDF1) in primary chondrocytes from the ctl, IL-1β, IL-1β + Nec-1, IL-1β + HMGB1, and IL-1β + HMGB1 + Nec-1 groups were determined by western blotting. (C) Serum levels of SDF-1α protein were measured by ELISA. Serum were collected from mice euthanized at 8 weeks post-DMM surgery ( n = 10 for each group). (D,E) Interactions between HMGB1 and TLR4 were detected by co-immunoprecipitation. Relative protein expression was quantified using ImageJ software. The relative protein expression levels of HMGB1 and TLR4 were normalized to GAPDH and expressed as a relative value. (F,G) Expression of HMGB1 and TLR4 were determined by immunohistochemical staining of the cartilage from each group ( n = 10). HMGB1 and TLR4 positive cells were quantified using Image-J software. The experiments were repeated three times independently. ∗ P < 0.05, ∗∗ P < 0.01, ∗∗∗ P < 0.0006, and ∗∗∗∗ P < 0.0001.
Index in PubMed under a CC BY license. PMID: 30542285

Click image to see more details
Pontin is required for TGFβ/SMAD signalling and critical for TGFβ-induced cell proliferation and invasion. a Western blot analyses of TGFβR2, p-SMAD2/3, SMAD2/3 and CTGF in the established Pontin-silenced U87MG and U251 cells without or with TGFβ (5 ng/ml) treatment overnight. Loading control: GAPDH. b qRT-PCR detection of TGFβ/SMAD target gene expression in the established Pontin-silenced U87MG cells. c Effect of Pontin knockdown or overexpression on the CAGA12-Luc transcriptional response induced by TGFβ (5 ng/ml) in U87MG cells. d Effect of Pontin knockdown on TGFβ- or LY-induced cell proliferation and invasion assessed by EdU staining and transwell invasion assays, respectively. Representative images (left) and the comparison results (right) were shown. e Effect of Pontin overexpression on TGFβ- or LY-induced cell proliferation and invasion assessed by EdU staining and transwell invasion assays, respectively. Representative images (left) and the comparison results (right) were shown. Data in b – e are expressed as means ± SDs, n = 3. ** P < 0.01, *** P < 0.001 by one-way ANOVA (Dunnett’s post test).
Index in PubMed under a CC BY license. PMID: 36153326

Click image to see more details
Sodium butyrate enhanced H3K9 acetylation. The cells were incubated with various concentrations of sodium butyrate (0.25, 0.5, 1 mM) for 12 h before adding LPS for 3 h. The protein level of H3K9 was analyzed by western blotting. The quantification of band intensity was determined by densitometry and normalized to GAPDH. Values were shown as means ± SD ( n = 3). ns p > 0.05 meant no significance, * p < 0.05 compared to the LPS group.
Index in PubMed under a CC BY license. PMID: 33251265

Click image to see more details
Pontin facilitates GBM cell proliferation and survival. a Western blot of Pontin in the extracts of the established Pontin-silenced or -overexpressed U87MG and U251 cells. Loading control, GAPDH. b Representative images of EdU staining (left) and the quantitative analysis of EdU-positive rates among the multiple groups (right). c Cell survival results reflected by colony formation assay. Data in b, c are expressed as means ± SDs, n = 3. *** P < 0.001 by one-way ANOVA (Dunnett’s post test).
Index in PubMed under a CC BY license. PMID: 36153326

Click image to see more details
Sodium butyrate reversed the expression of NLRP3 inflammasome. After the cells were cultured with various concentrations of sodium butyrate (0.25, 0.5, 1 mM) for 12 h, and then treated with 5 μg/ml LPS for 3 h. Protein samples of NLRP3 were analyzed by Western blotting, and the quantification of the band intensity was determined by densitometry was normalized to GAPDH. Values were shown as means ± SD ( n = 3). * p < 0.05, ** p < 0.01 compared to the LPS group.
Index in PubMed under a CC BY license. PMID: 33251265

Click image to see more details
DcR2-positive senescent RTECs exhibited an apoptosis-resistant phenotype and SASP in DN samples. A Representative immunofluorescence staining for DcR2 (red), the senescent marker p16 (green), and markers of apoptosis resistance (FLIP and Bcl2, purple) or apoptosis (caspase 3, purple) in patients with DN. Long arrows indicate co-localization in the same tubules, while short arrows indicate cytoplasmic p16 and caspase 3-positive expression in renal tubules. White dotted circles indicate tubular areas positive for DcR2 and p16 but negative for caspase 3. Scale bar, 40 μm. B Representative immunofluorescence micrographs showing DcR2 and TUNEL expression (green) in STZ-DN mice. Arrows indicate the single TUNEL-positive expression in tubules. Scale bar, 40 μm. C Western blotting results for the expression of FLIP, cleaved caspase 3, and DcR2 in DcR2-negative and -positive RTECs. D – F Quantification of FLIP, cleaved caspase 3, and DcR2 expression in C, normalized to GAPDH ( n = 4). * P < 0.05 versus DcR2-negative RTECs. G Representative graphs showing DcR2 and SASP markers (IL-6, TGF-β1) in STZ-DN mice. Scale bar, 80 μm.
Index in PubMed under a CC BY license. PMID: 35661704

Click image to see more details
Sodium butyrate inhibited canonical NF-κB signaling pathway. Bovine macrophages were treated with different concentrations of sodium butyrate (0.25, 0.5, 1 mM) for 12 h, followed by stimulation with LPS for 3 h. Western blotting was performed to determine phosphorylation levels of IκB and p65. The quantification of band intensity was determined by densitometry and normalized to GAPDH. The values were shown as means ± SD ( n = 3). ns p > 0.05 meant no significance, * p < 0.05, ** p < 0.01, *** p < 0.001 compared to the LPS group.
Index in PubMed under a CC BY license. PMID: 33251265

Click image to see more details
DcR2 mediated the apoptosis-resistant phenotype of senescent RTECs in vivo and in vitro. A , B qRT-PCR results for FLIP and caspase 8 mRNA levels in each group ( n = 6). C . Western blotting results for the expression of FLIP, caspase 8, and cleaved caspase 3 in STZ-DN mice. D – F Quantification of FLIP, caspase 8, and cleaved caspase 3 expression in C, normalized to GAPDH ( n = 6). G Caspase 3 activity in HG-induced primary RTECs ( n = 4). H Representative micrographs showing the expression of caspase 3 (green) and Annexin V (red) in vitro. Scale bar, 40 μm. I – J Apoptosis rate as detected via flow cytometry and the percentage of Annexin V-positive RTECs ( n = 6 for each group). Data are expressed as the mean ± SD for each group. * P < 0.05 versus control; # P < 0.05 versus STZ/ HG; & P < 0.05 versus HG + DcR2siRNA.
Index in PubMed under a CC BY license. PMID: 35661704

Click image to see more details
PIK3R3 regulates p21 expression in the p53-dependent way. a Western blot (WB) of PIK3R3, p53, and p21 both in LoVo and SW48 cells transfected with siNC, siPIK3R3(#1,#2). b qPCR assays of PIK3R3, p53, and p21 mRNA in LoVo (up panel) and SW48 (down panel) cells transfected with siNC, siPIK3R3 (#1,#2). These data were normalized to corresponding GAPDH. c LoVo cells transfected with siNC or siPIK3R3#1 were treated with CHX(100 μM) in different time lengths (0, 0.5, 1, 2, and 4 h). WB showed the change trend of p21 protein over time. d Luciferase activities of p21 promotor in LoVo (left panel) and SW48 (right panel) cells transfected with p21-luc and siNC, siPIK3R3(#1,#2). e , f WB of PIK3R3, p53, and p21 in HCT116 p53−/− cells transfected with siNC, siPIK3R3 (#1, #2), or with PIK3R3-expressing plasmid. Every assay repeated three times, and these numeral results were displayed as mean ± SD, * p < 0.05, ** p < 0.01, *** p < 0.001, t -test.
Index in PubMed under a CC BY license. PMID: 32973127

Click image to see more details
Role of GRP78 in generating the apoptosis-resistant phenotype of senescent RTECs in DN. A Representative immunostaining micrographs showing the expression of GRP78 in controls and patients with DN. Scale bar, 40 μm. B Quantification of the percentage of GRP78-positive RTECs. * P < 0.05 versus control; # P < 0.05 versus early DN. C Representative immunofluorescence staining for GRP78 (red) and p16, p21, cyclin D1 (green) in patients with DN. Arrows indicate co-expression in the same tubules. Scale bar, 40 μm. D Immunofluorescence staining for GRP78 (red) and FLIP and Bcl2 (Scale bar, 80 μm); GRP78 and caspase 3, TUNEL (Scale bar, 40 μm). E Western blotting results for the expression of GRP78, total caspase 3, and cleaved caspase 3 in RTECs. F , G Expression levels quantified relative to GAPDH in different groups ( n = 4) * P < 0.05 versus control; # P < 0.05 versus HG. H , I Apoptosis rate as detected by flow cytometry and the percentage of Annexin V-positive RTECs ( n = 6). Data are expressed as the mean ± SD for each group. * P < 0.05 versus control; # P < 0.05 versus HG.
Index in PubMed under a CC BY license. PMID: 35661704

Click image to see more details
Neat1 inhibition delays muscle regeneration following CTX injection in vivo. a The scheme for LV3-sh Neat1 or LV3-shNC particle injection and CTX injection into the Gas muscles and harvesting time points for subsequent analysis. b H&E staining results showing that LV3-sh Neat1 particle injection significantly delayed muscle regeneration compared with LV3-shNC particle injection. The injected muscles were harvested on days 0, 3, 7, and 15 post-CTX injections and used for H&E staining. c The quantification of the percentage of fibers with central localized nuclei (CLN) at 15 days after CTX injection. The results showed that the percentage of fibers with CLN were significantly higher in LV3-sh Neat1 groups than that in LV3-shNC groups. d qPCR results showing that the mRNA expression levels of Neat1 , Pax7 , Myod , Myog , eMyhc , and Ki67 genes were remarkably reduced after LV3-sh Neat1 particle injection. The injected muscles were harvested on day 7 post-CTX injection. e Western blotting analysis showing that the protein expression levels of Pax7, Myod, Myog, and eMyhc were reduced after LV3-sh Neat1 particle injection. The protein levels of these genes were quantified using ImageJ software. The injected muscles were harvested on day 7 post-CTX injection. f Immunofluorescence staining of Pax7, EdU and DAPI in muscle sections on day 3 post-CTX injection showing that Pax7 + SCs and proliferating SCs were reduced after LV3-sh Neat1 particle injection. The percentage of Pax7 + SCs were indicated for the proportion of the number of Pax7 + nuclei in total number of DAPI, the percentage of proliferating satellite cells were indicated for the proportion of the number of Pax7 + /EdU + nuclei in total number of Pax7 + nuclei. g , h Immunofluorescence staining of Myog ( g ) and eMyhc ( h ) in muscle sections on day 3 post-CTX showing significantly reduced expression of these proteins after LV3-sh Neat1 particle injection. Relative RNA and protein levels were normalized to those of Gapdh. All values represent the mean ± s.d. of three independent experiments. * p < 0.05, ** p < 0.01, N.S. indicates not significant
Index in PubMed under a CC BY license. PMID: 31243262

Click image to see more details
DcR2–GRP78 interactions mediated the apoptosis-resistant phenotype of senescent RTECs by regulating the antiapoptotic activity of GRP78. A Representative immunofluorescence staining for DcR2 (red), GRP78 (green), and FLIP or caspase 3 (purple) in patients with DN. Long arrows indicate co-localization in the same tubules. Scale bar, 40 μm. B , D . Western blotting results for FLIP, caspase 7, cleaved caspase 7, and cleaved caspase 3 expression in HG-induced RTECs. C , E Levels of each in B, D quantified in relation to GAPDH expression in different groups ( n = 4). * P < 0.05 versus control; # P < 0.05 versus HG; & P < 0.05 versus HG + DcR2 siRNA/HG + DcR2 overexpression. F , G Reciprocal co-immunoprecipitation results for the interaction of GRP78 and caspase 7 in STZ-DN mice ( n = 6). H , I The interaction of GRP78 and caspase 7 in HG-induced RTECs after transfection of DcR2 siRNA or overexpression plasmids. J , K . Western blotting results for the expression of Akt and pAkt and the relative levels of pAkt to Akt quantified in different groups ( n = 4). * P < 0.05, versus control; # P < 0.05, versus STZ/HG. Data are expressed as mean ± SD for each group.
Index in PubMed under a CC BY license. PMID: 35661704

Click image to see more details
Mractb1 promoter demonstrates comparative activity with carp actb1 gene promoter. (A) Relative luciferase activity. (B) Western blot of firefly luciferase. (C) Relative levels of the firefly luciferase protein. The Mractb1 promoter (Mbap) and carp actb1 promoter (Cbap) were cloned into the pGL3-basic vector and the resulted constructs were transfected into EPC cells. Dual luciferase assays and western blot were performed to analyze the activities and protein levels of the luciferase reporter, respectively. GAPDH was used as loading control for western blot. The relative intensity represents ratio of the brightness of the firefly luciferase bands to those of GAPDH. The bars indicate mean ± SD ( n = 3). Download full-size image DOI:
Index in PubMed under a CC BY license. PMID: 30386688

Click image to see more details
ROF inhibits IL-1β–induced inflammatory responses and cartilage degradation in chondrocytes. Cells were treated with different concentrations of ROF in the presence or absence of IL-1β (10 ng/ml) for 24 h. (A) Western blots and (B) quantitative analysis of iNOS and COX-2. (C) Western blots and (D) quantitative analysis of collagen Ⅱ, MMP13, and ADAMTS5. GAPDH was employed as the loading control ( n = 3). # p < 0.05 vs. control group; * p < 0.05 and ** p < 0.01 vs. IL-1β group.
Index in PubMed under a CC BY license. PMID: 34122080

Click image to see more details
Physical exercise increased the expression of CX3CL1/CX3CR1 axis and decreased ERK and JNK phosphorylation. (A) Representative Western blot of CX3CL1 and CX3CR1 expression. (B) Densitometry analyses of CX3CL1 and CX3CR1 expression normalized to GAPDH. (C) Representative Western blotting of P-P38, P38, P-JNK, JNK, P-ERK1/2 and ERK1/2 expression. (D) Densitometry analyses of P-P38, P38, P-JNK, JNK, P-ERK1/2 and ERK1/2 expression normalized to GAPDH. Data represent the means ± SEM. * P < 0.05, ** P < 0.01. n = 5.
Index in PubMed under a CC BY license. PMID: 29311834
Specific Publications For Anti-GAPDH Mouse Monoclonal Antibody (M00227-7)
Loading publications
Recommended Resources
Here are featured tools and databases that you might find useful.
- Boster's Pathways Library
- Protein Databases
- Bioscience Research Protocol Resources
- Data Processing & Analysis Software
- Photo Editing Software
- Scientific Literature Resources
- Research Paper Management Tools
- Molecular Biology Software
- Primer Design Tools
- Bioinformatics Tools
- Phylogenetic Tree Analysis
Customer Reviews
Have you used Anti-GAPDH Mouse Monoclonal Antibody?
Share your experimental results or join a short interview to earn up to $1,000 in product credits or other rewards.
0 Reviews For Anti-GAPDH Mouse Monoclonal Antibody
Customer Q&As
Have a question?
Find answers in Q&As, reviews.
Can't find your answer?
Submit your question
