Click image to see more details
-

-
-
-
-
+5
Product Info Summary
| SKU: | M01263 |
|---|---|
| Size: | 100 μl |
| Reactive Species: | Human, Mouse, Rat |
| Host: | Rabbit |
| Application: | IF, IHC, ICC, WB |
Customers Who Bought This Also Bought

Product info
Product Name
Anti-beta Actin ACTB Rabbit Monoclonal Antibody
SKU/Catalog Number
M01263
BM3873 is an alternative SKU for this antibody, used in previous lots.
Size
100 μl
Form
Liquid
Description
Boster Bio Anti-beta Actin ACTB Rabbit Monoclonal Antibody catalog # M01263. Tested in WB, IHC, ICC/IF applications. This antibody reacts with Human, Mouse, Rat.
Storage & Handling
Store at -20°C for one year. For short term storage and frequent use, store at 4°C for up to one month. Avoid repeated freeze-thaw cycles.
Cite This Product
Anti-beta Actin ACTB Rabbit Monoclonal Antibody (Boster Biological Technology, Pleasanton CA, USA, Catalog # M01263)
Host
Rabbit
Contents
Rabbit IgG in stabilizing components, phosphate buffered saline, pH 7.4, 150mM NaCl, 0.02% sodium azide and 50% glycerol.
*This antibody is supplied in a stabilized formulation.
Compatibility with conjugation reactions depends on the chemistry of the conjugation method used.
For conjugation methods that are not compatible with the stabilizing components present in this formulation, a carrier-free antibody format is required.
Clonality
Monoclonal
Clone Number
BF-1
Isotype
Rabbit IgG
Immunogen
A synthesized peptide derived from human beta Actin
Reactive Species
M01263 is reactive to ACTB in Human, Mouse, Rat
Observed Molecular Weight
42 kDa
Calculated molecular weight
41.7 kDa
Antibody Validation
Boster validates all antibodies on WB, IHC, ICC, Immunofluorescence, and ELISA with known positive control and negative samples to ensure specificity and high affinity, including thorough antibody incubations.
Application & Images
Applications
M01263 is guaranteed for IF, IHC, ICC, WB Boster Guarantee
Recommend Dilution
WB 1:2000-20000
IHC 1:50-200
ICC/IF 1:50-200
Tested application
Suggested blocking solution with 5% non-fat milk or BSA; (*)Recommended protein loading: 20-40 µg per lane
Use TE buffer pH 9.0 for antigen retrieval; (*) citrate buffer pH 6.0 is an alternative.
Validation Images & Assay Conditions
Click image to see more details
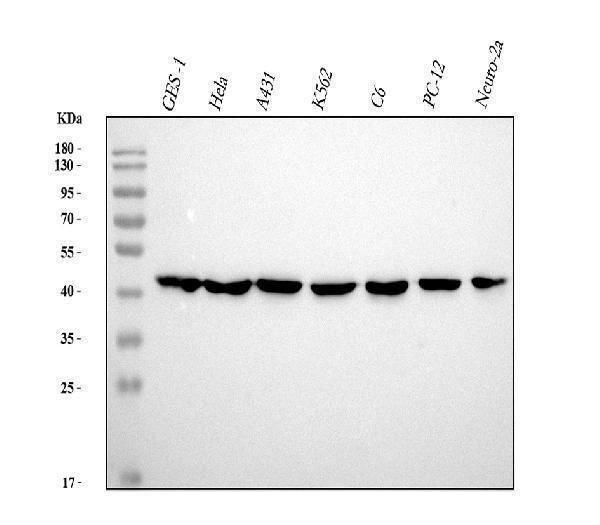
Western blot analysis of Beta Actin using anti-Beta Actin antibody (M01263).
Electrophoresis was performed on a 5-20% SDS-PAGE gel at 70V (Stacking gel) / 90V (Resolving gel) for 2-3 hours. The sample well of each lane was loaded with 30 ug of sample under reducing conditions.
Lane 1: human GES-1 whole cell lysates,
Lane 2: human Hela whole cell lysates,
Lane 3: human A431 whole cell lysates,
Lane 4: human K562 whole cell lysates,
Lane 5: rat C6 whole cell lysates,
Lane 6: rat PC-12 whole cell lysates,
Lane 7: mouse Neuro-2a whole cell lysates.
After electrophoresis, proteins were transferred to a nitrocellulose membrane at 150 mA for 50-90 minutes. Blocked the membrane with 5% non-fat milk/TBS for 1.5 hour at RT. The membrane was incubated with rabbit anti-Beta Actin antigen affinity purified monoclonal antibody (Catalog # M01263) at 1:5000 overnight at 4°C, then washed with TBS-0.1%Tween 3 times with 5 minutes each and probed with a goat anti-rabbit IgG-HRP secondary antibody at a dilution of 1:500 for 1.5 hour at RT. The signal is developed using an Enhanced Chemiluminescent detection (ECL) kit (Catalog # EK1002) with Tanon 5200 system. A specific band was detected for Beta Actin at approximately 42 kDa. The expected band size for Beta Actin is at 42 kDa.

Click image to see more details
Immunohistochemical analysis of paraffin-embedded (1) Human heart; (2) Mouse testis; (3) Human bladder cancer; (4) Mouse heart, using beta Actin Antibody.

Click image to see more details
(A–F) Cisatracurium inhibits metastatic ability of CRC in vivo . (A) Line graph of subcutaneous tumor volume. (B) Weight of subcutaneous tumors in grams. Data are expressed as mean tumor volume or weight ± SE. ∗ p < 0.05. (C–F) Representative densities of tumor viability and migration regulatory proteins (p53, p21 and CD1, SNAI-1, CALD1, E-Cadherin) in tumor tissue samples. β-Actin was used as internal control. The cluster bar chats in (D , F) indicates the levels of viability and migration regulatory proteins in the treatment group. Data are expressed as Mean ± SEM ( n = 3). ∗ p < 0.05, ∗∗ p < 0.01, ∗∗∗ p < 0.001 versus control.
Index in PubMed under a CC BY license. PMID: 30108509

Click image to see more details
Immunofluorescent analysis using the Antibody at 1:50 dilution.

Click image to see more details
The expression levels of FTH1 protein in different treated groups over time. The expression levels of FTH1 protein in different treated groups of HFL1 cells over time (Western Blot). The β-actin protein was used as an internal reference protein. The relative expression levels of FTH1 protein quantified by image analysis, and corrected by internal reference protein and control. The trend of levels of FTH1 protein expression were consistent with the results of immunofluorescence after TGF-β1 and DHA treatments. Data are presented as mean ± SEM (n = 3). Compared with the control group, *P < 0.05, **P < 0.01; compared with TGF-β1treatment group, △△P < 0.01, compared with DHA treated group, ##P < 0.01.
Index in PubMed under a CC BY license. PMID: 38463857

Click image to see more details
(A–D) Cisatracurium alters migration and invasion regulatory genes transcription and protein expression levels in HCT116 cells. (A) Representative densities of SNAI-1, SLUG, E-Cadherin, CALD1, and β-actin proteins following western blot experiment. (B,C) Cluster bar charts of SNAI-1, SLUG, E-Cadherin, and CALD1 proteins expression and mRNA transcription levels of untreated and cisatracurium-treated (10 or 20 μM) HCT116 cells. β-Actin was used as internal control during western blot and qRT-PCR experiments. (D) Immunofluorescence was performed using FITC-labeled phalloidin, SNAI-1, SLUG, E-Cadherin, and CALD1 were stained with DAPI (Scale bar: 20 μm). Data are expressed as Mean ± SEM ( n = 3). ∗ p < 0.05, ∗∗ p < 0.01, and ∗∗∗ p < 0.001 versus untreated (0).
Index in PubMed under a CC BY license. PMID: 30108509

Click image to see more details
Increased β-catenin expression in HBV-infected hepatic cells. a Western blot analysis of β-catenin expression in hepatic L02 cells transfected with and without pcDNA3.1-HBV (1.3 and 1.1) or its control pcDNA3.1 for 48 h. β-actin served as a loading control. b Immunofluorescence staining for β-catenin in L02 cells transfected with and without pcDNA3.1-HBV (1.3 and 1.1) or its control pcDNA3.1 for 48 h. White scale bars = 50 µm. c ELISA assay for β-catenin expression in L02 cells transfected with and without pcDNA3.1-HBV (1.3 and 1.1) or its control pcDNA3.1 for 48 h. d LDH assay for LDH from L02 cells transfected with and without pcDNA3.1-HBV (1.3 and 1.1) or its control pcDNA3.1 for 48 h. e Flow cytometry analysis for apoptotic L02 cells transfected with and without pcDNA3.1-HBV (1.3 and 1.1) or its control pcDNA3.1 for 72 h. f Apoptosis index for L02 cells with different treatment. Ns no statistical significance
Index in PubMed under a CC BY license. PMID: 30268125

Click image to see more details
MSMP-containing serum inhibited NF-κB pathway in macrophages after LPS induction. (A) Western blot analysis of p-p65, p65 and β-actin; (B) Statistical analysis of the Western blot results for p-p65/β-actin (%); (C) Statistical analysis of the Western blot results for p-p65/p65 (%); Quantification of the proteins was analyzed by the ImageJ software. (D) The immunofluorescence assay shows the blue fluorescence for DAPI, the red fluorescence for p-p65 and finally the merge plot; (E, F) The expression of p-p65 was analyzed by the ImageJ software. Scale bar represents 100 μm (Date are mean ± SD, #### p < 0.0001, versus Control group; *** p < 0.001, **** p < 0.0001, versus LPS group).
Index in PubMed under a CC BY license. PMID: 38974041

Click image to see more details
Effects of 1,25 VD3 supplementation on hepatic lipid peroxidation, inflammation and fatty acid metabolizing genes in NASH rats. To assess oxidative stress, hepatic (A) MDA was measured using a thiobarbituric acid kit and (B) TAOC levels measured using the FRAP method. (C) NF-κB expression in liver tissue, analyzed by Western blotting and normalized to β-actin (left panel showing representative blot and right panel showing quantification by densitometry of 65 kDa band). Antibodies used and their dilutions: primary antibodies against NF-κB (anti-rabbit, 1:1000) and β-actin (anti-rabbit, 1:1000), followed by HRP-conjugated secondary antibody (1:2000). (D) PPARα and (E) CPT-1 mRNA levels were quantified by qPCR in liver tissues of indicated groups, and expressed as relative mRNA levels following normalization to GAPDH mRNA levels. Data are presented as mean ± SEM, n=6. *p < 0.05, **p<0.01 and ***p < 0.001 vs CG; ##p < 0.01 and ###p < 0.001 vs CDG.
Index in PubMed under a CC BY license. PMID: 40190400
Specific Publications For Anti-beta Actin ACTB Rabbit Monoclonal Antibody (M01263)
Loading publications
Recommended Resources
Here are featured tools and databases that you might find useful.
- Boster's Pathways Library
- Protein Databases
- Bioscience Research Protocol Resources
- Data Processing & Analysis Software
- Photo Editing Software
- Scientific Literature Resources
- Research Paper Management Tools
- Molecular Biology Software
- Primer Design Tools
- Bioinformatics Tools
- Phylogenetic Tree Analysis
Customer Reviews
Have you used Anti-beta Actin ACTB Rabbit Monoclonal Antibody?
Share your experimental results or join a short interview to earn up to $1,000 in product credits or other rewards.
0 Reviews For Anti-beta Actin ACTB Rabbit Monoclonal Antibody
Customer Q&As
Have a question?
Find answers in Q&As, reviews.
Can't find your answer?
Submit your question
