Click image to see more details
-

-
-
-
-
+14
Product Info Summary
| SKU: | A00225-4 |
|---|---|
| Size: | 100 μg/vial |
| Reactive Species: | Human, Mouse, Rat |
| Host: | Rabbit |
| Application: | ELISA, IF, IHC, ICC, WB |
Customers Who Bought This Also Bought

Product info
Product Name
Anti-Aryl hydrocarbon Receptor/AHR Antibody Picoband®
SKU/Catalog Number
A00225-4
Size
100 μg/vial
Form
Lyophilized
Description
Boster Bio Anti-Aryl hydrocarbon Receptor/AHR Antibody Picoband® catalog # A00225-4. Tested in ELISA, IF, IHC, ICC, WB applications. This antibody reacts with Human, Mouse, Rat. The brand Picoband indicates this is a premium antibody that guarantees superior quality, high affinity, and strong signals with minimal background in Western blot applications. Only our best-performing antibodies are designated as Picoband, ensuring unmatched performance.
Storage & Handling
Store at -20˚C for one year from date of receipt. After reconstitution, at 4˚C for one month. It can also be aliquotted and stored frozen at -20˚C for six months. Avoid repeated freeze-thaw cycles.
Cite This Product
Anti-Aryl hydrocarbon Receptor/AHR Antibody Picoband® (Boster Biological Technology, Pleasanton CA, USA, Catalog # A00225-4)
Host
Rabbit
Contents
Each vial contains 4 mg Trehalose, 0.9 mg NaCl and 0.2 mg Na2HPO4.
Clonality
Polyclonal
Isotype
Rabbit IgG
Immunogen
E.coli-derived human Aryl hydrocarbon Receptor/AHR recombinant protein (Position: A6-L842).
Cross-reactivity
No cross-reactivity with other proteins.
Reactive Species
A00225-4 is reactive to AHR in Human, Mouse, Rat
Observed Molecular Weight
100 kDa
Calculated molecular weight
96.1 kDa
Background of AHR
The aryl hydrocarbon receptor (AhR or AHR or ahr or ahR) is a protein that in humans is encoded by the AHR gene. It is mapped to 7p21.1. The protein encoded by this gene is a ligand-activated helix-loop-helix transcription factor involved in the regulation of biological responses to planar aromatic hydrocarbons. This receptor has been shown to regulate xenobiotic-metabolizing enzymes such as cytochrome P450. Before ligand binding, the encoded protein is sequestered in the cytoplasm; upon ligand binding, this protein moves to the nucleus and stimulates transcription of target genes.
Antibody Validation
Boster validates all antibodies on WB, IHC, ICC, Immunofluorescence, and ELISA with known positive control and negative samples to ensure specificity and high affinity, including thorough antibody incubations.
Application & Images
Applications
A00225-4 is guaranteed for ELISA, IF, IHC, ICC, WB Boster Guarantee
Recommend Dilution
| Application | Dilution | Species |
|---|---|---|
| Western blot | 0.1-0.25μg/ml | Human, Mouse |
| Immunohistochemistry (Paraffin-embedded Section) | 2-5μg/ml | Human, Mouse, Rat |
| Immunocytochemistry/Immunofluorescence | 5μg/ml | Human |
| ELISA | 0.1-0.5μg/ml | - |
Tested application
Suggested blocking solution with 5% non-fat milk or BSA; (*)Recommended protein loading: 20-40 µg per lane
Use TE buffer pH 9.0 for antigen retrieval; (*) citrate buffer pH 6.0 is an alternative.
Validation Images & Assay Conditions
Click image to see more details
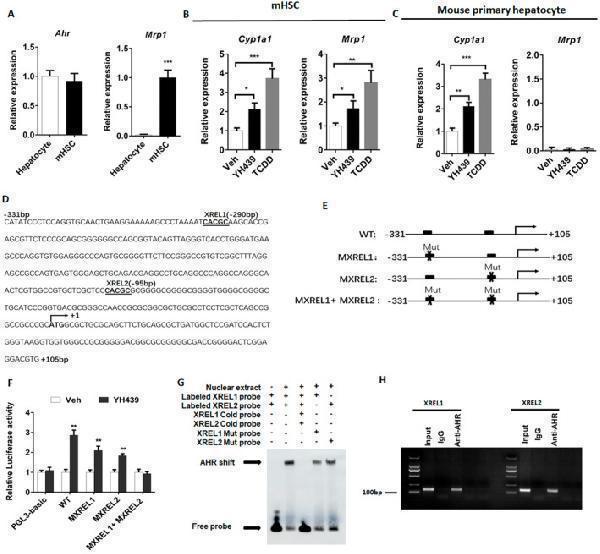
AHR directly regulates Mrp1 transcription in mHSCs. (A–C) The expression of Ahr, Mrp1 or Cyp1a1 was detected by QPCR. (D) There are two potential AHR exogenous response elements on the Mrp1 promoter sequence. (E) Promoter sequences containing XREL1 and XREL2 were cloned onto PGL3 plasmids, and mutant plasmids were constructed. (F) Double luciferase assay to detect luciferase activity. (G) EMSA detects AHR binding to specific elements XREL1 and XREL2. (H) CHIP detects AHR binding to specific elements XREL1 and XREL2. Data are expressed as means ± SD; * p < 0.05, ** p < 0.01 and *** p < 0.001; Student's t ‐test or one‐way ANOVA.
Index in PubMed under a CC BY license. PMID: 39654034

Click image to see more details
AHR reduces the antioxidant capacity of mHSCs. (A) Analysis of GSH content changes. (B) Analysis of GSH content changes. (C) Analysis of GSH content changes. Data are expressed as means ± SD; * p < 0.05 and ** p < 0.01; Student's t ‐test.
Index in PubMed under a CC BY license. PMID: 39654034

Click image to see more details
AHR increases the sensitivity of HSC to ferroptosis. (A) Morphological changes in mitochondria were detected by electron microscopy. Quantification of mitochondria sizes. Scale bar = 1 μm. (B) TMRE fluorescent probe was used to analyze the change of mitochondrial membrane potential in mHSCs. The change of mitochondrial membrane potential in mHSCs was quantitatively analyzed. Scale bar = 50 μm (C) TMRE fluorescent probe was used to analyze the change of mitochondrial membrane potential in primary mouse hepatocytes. The change of mitochondrial membrane potential in primary mouse hepatocytes was quantitatively analyzed. Data are expressed as means ± SD; * p < 0.05 and ** p < 0.01; Student's t ‐test. Scale bar = 50 μm.
Index in PubMed under a CC BY license. PMID: 39654034

Click image to see more details
AHR promotes mHSC ferroptosis. (A) Ferroorange fluorescent probe was used to analyze the change of Fe 2+ content in mHSCs. The change of Fe 2+ content in HSCs was quantitatively analyzed. (B) H2DCFDA fluorescent probe was used to analyze the change of ROS content in mHSCs. The change of ROS content in HSCs was quantitatively analyzed. (C) BODIPY 581/591 C11 fluorescent probe was used to analyze the change of MDA content in mHSCs. The change of MDA content in mHSCs was quantitatively analyzed. (D) QPCR analysis of iron death related gene expression changes. (E) Analysis of intracellular GPXs activity. (F) Analysis of cell mortality. Data are expressed as means ± SD; * p < 0.05 and ** p < 0.01; Student's t ‐test. Scale bar = 50 μm.
Index in PubMed under a CC BY license. PMID: 39654034

Click image to see more details
AHR improved the antioxidant capacity of primary mouse hepatocytes. (A) Ferroorange fluorescent probe was used to analyze the change of Fe 2+ content in primary mouse hepatocytes. The change of Fe 2+ content in primary mouse hepatocytes was quantitatively analyzed. (B) H2DCFDA fluorescent probe was used to analyze the change of ROS content in primary mouse hepatocytes. The change of ROS content in primary mouse hepatocytes was quantitatively analyzed. (C) BODIPY 581/591 C11 fluorescent probe was used to analyze the change of MDA content in primary mouse hepatocytes. The change of MDA content in primary mouse hepatocytes was quantitatively analyzed. (D) QPCR analysis of iron death related gene expression changes in primary mouse hepatocytes. (E) Analysis of intracellular GPXs activity. (F) Analysis of cell mortality. Data are expressed as means ± SD; * p < 0.05 and ** p < 0.01; Student's t ‐test. Scale bar = 50 μm.
Index in PubMed under a CC BY license. PMID: 39654034

Click image to see more details
AHR alleviates liver fibrosis. (A) The WT mice received intraperitoneal paraffin oil injection (control group) or CCl4 injection twice per week for 4 weeks and these mice were orally gavaged with either Vehicle or YH439 once a day for a week. (B) Expressions of Cyp1a1 were detected by QPCR ( n = 5). (C) The changes in ALT and AST levels were detected ( n = 5). (D) Expressions of αSma, Col1a1 , and Col1a2 were detected by QPCR ( n = 5). (E) αSMA Immunofluorescence staining and H&E staining. The scales are 50 or 100 μm, respectively. Data are expressed as means ± SD; * p < 0.05 and ** p < 0.01; one‐way ANOVA.
Index in PubMed under a CC BY license. PMID: 39654034

Click image to see more details
AHR alleviates liver fibrosis and is abolished in HSC‐specific Mrp1 deficient (Mrp1 −/− ) mice. (A)The Mrp1 fl/fl mice or Mrp1 −/− mice received intraperitoneal paraffin oil injection (control group) or CCl4 injection twice per week for 4 weeks and these mice were orally gavaged with either Vehicle or YH439 once a day for a week. (B) Expressions of Cyp1a1 were detected by QPCR ( n = 5). (C) Expressions of αSma, Col1a1 , and Col1a2 were detected by QPCR ( n = 5). (D) αSMA Immunofluorescence staining and H&E staining. The scales are 50 μm or 100 μm, respectively. Data are expressed as means ± SD; * p < 0.05 and ** p < 0.01; one‐way ANOVA.
Index in PubMed under a CC BY license. PMID: 39654034

Click image to see more details
ICA accelerates the proliferation of intestinal epithelial cells in vitro . IPEC-J2 cells were treated with different doses of ICA for 24 h. The cell viability was determined by CCK8 assay (A) . The cell proliferation was determined by EdU incorporation assay (B,C) . Cells were stained for EdU (red), and the nuclei were stained with DAPI (blue). The expression of AHR, PCNA, and Cyclin D1 were measured by western blot (D) . Data are expressed as mean ± SEM. * P < 0.05, ** P < 0.01, *** P < 0.001 vs. the Control group. ICA100, the basal diet supplemented with 100 mg/kg indole-3-carboxaldehyde. AHR, aryl hydrocarbon receptor; PCNA, proliferating cell nuclear antigen.
Index in PubMed under a CC BY license. PMID: 35651506

Click image to see more details
Kyn impairs decidualization of mouse stromal cells and activates AhR. (A) Prl8a2 and Prl3c1 mRNA levels after stromal cells were treated with Kyn for 2 days under in vitro decidualization. (B) Western blot analysis and quantification of BMP2 and SNAIL protein levels in stromal cells treated with Kyn for 2 days. (C) AhR fluorescence in stromal cells treated with 1 mM Kyn with or without 10 μM CH223191 for 24 h. Nuclei were counter-stained with DAPI. Scale bar, 50 μm. (D) The mRNA levels of Cyp1a1 and Cyp1b1 after stromal cells were treated with Kyn for 2 days under in vitro decidualization. All images are the representative of at least three biologically independent experiments. *, p < 0.05; **, p < 0.01; ***, p < 0.001.
Index in PubMed under a CC BY license. PMID: 41059340

Click image to see more details
P 4 activates AhR pathway. (A) Uterine phosphorylated AhR immunofluorescence after ovariectomized mice were treated with 2 mg or 4 mg P 4 for 7 days. Nuclei were counter-stained with PI. Le, luminal epithelia; St, stroma. Scale bar, 20 μm. n = 3 mice per group. (B) Uterine mRNA levels of Cyp1a1 and Cyp1b1 after ovariectomized mice were treated with 2, 4 or 8 mg P 4 for 7 days. (C) Western blot analysis and quantification of uterine CYP1A1 (3 days injection) and CYP1B1 (7 days injection) protein levels after ovariectomized mice were treated with 2, 4 or 8 mg P 4 . (D) Western blot analysis of AhR protein level in nuclear and cytoplasmic fractions, and quantification of AhR in nuclear fractions after stromal cells were treated with P 4 for 48 h (E) AhR immunofluorescence in stromal cells treated with 0.8, 4, or 20 μM P 4 for 48 h. Nuclei were counterstained with DAPI. Scale bar: 50 μm. All images are the representative of at least three biologically independent experiments. *, p < 0.05; **, p < 0.01; ***, p < 0.001.
Index in PubMed under a CC BY license. PMID: 41059340

Click image to see more details
Kyn inhibits mouse stromal cell decidualization through activating AhR. (A) The mRNA levels of Cyp1a1 and Cyp1b1 after stromal cells under in vitro decidualization were treated with Kyn for 48 h with or without AhR inhibitor CH223191. (B) Prl8a2 mRNA level after stromal cells under in vitro decidualization were treated with Kyn for 24 h with or without CH223191. (C) The mRNA levels of Prl8a2 and Prl3c1 after stromal cells were treated with 2-OH-E 2 for 12 h under in vitro decidualization. (D) The mRNA levels of Prl8a2 and Prl3c1 after stromal cells were treated with 4-OH-E 2 for 24 h under in vitro decidualization. All images are the representative of at least three biologically independent experiments. *, p < 0.05; **, p < 0.01; ***, p < 0.001.
Index in PubMed under a CC BY license. PMID: 41059340

Click image to see more details
Western blot analysis of AHR using anti-AHR antibody (A00225-4).
Electrophoresis was performed on a 8% SDS-PAGE gel at 80V (Stacking gel) / 120V (Resolving gel) for 2 hours. The sample well of each lane was loaded with 30 ug of sample under reducing conditions.
Lane 1: human Hela- WT whole cell lysates,
Lane 2: human Hela-AHR KO whole cell lysates.
After electrophoresis, proteins were transferred to a nitrocellulose membrane at 150 mA for 50-90 minutes. Blocked the membrane with 5% non-fat milk/TBS for 1.5 hour at RT. The membrane was incubated with rabbit anti-AHR antigen affinity purified polyclonal antibody (A00225-4) at 0.5 μg/mL overnight at 4°C, then washed with TBS-0.1%Tween 3 times with 5 minutes each and probed with a goat anti-rabbit IgG-HRP secondary antibody at a dilution of 1:5000 for 1.5 hour at RT. The signal is developed using an ECL Plus Western Blotting Substrate (Catalog # AR1196-200) with Tanon 5200 system. A specific band was detected for AHR at approximately 100 kDa. The expected band size for AHR is at 96 kDa.

Click image to see more details
Western blot analysis of AHR using anti-AHR antibody (A00225-4).
Electrophoresis was performed on a 8% SDS-PAGE gel at 80V (Stacking gel) / 120V (Resolving gel) for 2 hours. The sample well of each lane was loaded with 30 ug of sample under reducing conditions.
Lane 1: human MCF-7 whole cell lysates,
Lane 2: human PC-3 whole cell lysates,
Lane 3: human A549 whole cell lysates,
Lane 4: human Hela whole cell lysates,
Lane 5: mouse NIH/3T3 whole cell lysates.
After electrophoresis, proteins were transferred to a nitrocellulose membrane at 150 mA for 50-90 minutes. Blocked the membrane with 5% non-fat milk/TBS for 1.5 hour at RT. The membrane was incubated with rabbit anti-AHR antigen affinity purified polyclonal antibody (A00225-4) at 0.25 μg/mL overnight at 4°C, then washed with TBS-0.1%Tween 3 times with 5 minutes each and probed with a goat anti-rabbit IgG-HRP secondary antibody (Catalog # BA1054) at a dilution of 1:5000 for 1.5 hour at RT. The signal is developed using an ECL Plus Western Blotting Substrate (Catalog # AR1196-200) with Tanon 5200 system. A specific band was detected for AHR at approximately 100 kDa. The expected band size for AHR is at 96 kDa.

Click image to see more details
IHC analysis of AHR using anti-AHR antibody (A00225-4).
AHR was detected in a paraffin-embedded section of human spleen tissue. Heat mediated antigen retrieval was performed in EDTA buffer (pH 8.0, epitope retrieval solution). The tissue section was blocked with 10% goat serum. The tissue section was then incubated with 2 μg/ml rabbit anti-AHR Antibody (A00225-4) overnight at 4°C. Peroxidase Conjugated Goat Anti-rabbit IgG was used as secondary antibody and incubated for 30 minutes at 37°C. The tissue section was developed using HRP Conjugated Rabbit IgG Super Vision Assay Kit (Catalog # SV0002) with DAB as the chromogen.

Click image to see more details
IHC analysis of AHR using anti-AHR antibody (A00225-4).
AHR was detected in a paraffin-embedded section of human colon cancer tissue. Heat mediated antigen retrieval was performed in EDTA buffer (pH 8.0, epitope retrieval solution). The tissue section was blocked with 10% goat serum. The tissue section was then incubated with 2 μg/ml rabbit anti-AHR Antibody (A00225-4) overnight at 4°C. Peroxidase Conjugated Goat Anti-rabbit IgG was used as secondary antibody and incubated for 30 minutes at 37°C. The tissue section was developed using HRP Conjugated Rabbit IgG Super Vision Assay Kit (Catalog # SV0002) with DAB as the chromogen.

Click image to see more details
IHC analysis of AHR using anti-AHR antibody (A00225-4).
AHR was detected in a paraffin-embedded section of mouse brain tissue. Heat mediated antigen retrieval was performed in EDTA buffer (pH 8.0, epitope retrieval solution). The tissue section was blocked with 10% goat serum. The tissue section was then incubated with 2 μg/ml rabbit anti-AHR Antibody (A00225-4) overnight at 4°C. Peroxidase Conjugated Goat Anti-rabbit IgG was used as secondary antibody and incubated for 30 minutes at 37°C. The tissue section was developed using HRP Conjugated Rabbit IgG Super Vision Assay Kit (Catalog # SV0002) with DAB as the chromogen.

Click image to see more details
IHC analysis of AHR using anti-AHR antibody (A00225-4).
AHR was detected in a paraffin-embedded section of rat brain tissue. Heat mediated antigen retrieval was performed in EDTA buffer (pH 8.0, epitope retrieval solution). The tissue section was blocked with 10% goat serum. The tissue section was then incubated with 2 μg/ml rabbit anti-AHR Antibody (A00225-4) overnight at 4°C. Peroxidase Conjugated Goat Anti-rabbit IgG was used as secondary antibody and incubated for 30 minutes at 37°C. The tissue section was developed using HRP Conjugated Rabbit IgG Super Vision Assay Kit (Catalog # SV0002) with DAB as the chromogen.

Click image to see more details
IF analysis of AHR using anti-AHR antibody (A00225-4) and anti-Tubulin Alpha antibody (M03989-3).
AHR was detected in immunocytochemical section of U2OS cell. Enzyme antigen retrieval was performed using IHC enzyme antigen retrieval reagent (AR0022) for 15 mins. The cells were blocked with 10% goat serum. And then incubated with 5 μg/mL rabbit anti-AHR Antibody (A00225-4) and mouse anti-Tubulin Alpha antibody (M03989-3) overnight at 4°C. DyLight®488 Conjugated Goat Anti-Rabbit IgG (BA1127) and Cy3 Conjugated Goat Anti-Mouse IgG (BA1031) were used as secondary antibody at 1:500 dilution and incubated for 30 minutes at 37°C. Visualize using a fluorescence microscope and filter sets appropriate for the label used.
Specific Publications For Anti-Aryl hydrocarbon Receptor/AHR Antibody Picoband® (A00225-4)
Loading publications
Recommended Resources
Here are featured tools and databases that you might find useful.
- Boster's Pathways Library
- Protein Databases
- Bioscience Research Protocol Resources
- Data Processing & Analysis Software
- Photo Editing Software
- Scientific Literature Resources
- Research Paper Management Tools
- Molecular Biology Software
- Primer Design Tools
- Bioinformatics Tools
- Phylogenetic Tree Analysis
Customer Reviews
Have you used Anti-Aryl hydrocarbon Receptor/AHR Antibody Picoband®?
Share your experimental results or join a short interview to earn up to $1,000 in product credits or other rewards.
0 Reviews For Anti-Aryl hydrocarbon Receptor/AHR Antibody Picoband®
Customer Q&As
Have a question?
Find answers in Q&As, reviews.
Can't find your answer?
Submit your question
