Click image to see more details
-

-
-
-
-
+14
Product Info Summary
| SKU: | M00144-1 |
|---|---|
| Size: | 100 μl |
| Reactive Species: | Human, Mouse, Rat |
| Host: | Rabbit |
| Application: | IF, IHC, ICC, WB |
Customers Who Bought This Also Bought

Product info
Product Name
Anti-CD11b ITGAM Rabbit Monoclonal Antibody
SKU/Catalog Number
M00144-1
BM3925 is an alternative SKU for this antibody, used in previous lots.
Size
100 μl
Form
Liquid
Description
Boster Bio Anti-CD11b ITGAM Rabbit Monoclonal Antibody catalog # M00144-1. Tested in WB, IHC, ICC/IF applications. This antibody reacts with Human, Mouse, Rat.
Storage & Handling
Store at -20°C for one year. For short term storage and frequent use, store at 4°C for up to one month. Avoid repeated freeze-thaw cycles.
Cite This Product
Anti-CD11b ITGAM Rabbit Monoclonal Antibody (Boster Biological Technology, Pleasanton CA, USA, Catalog # M00144-1)
Host
Rabbit
Contents
Rabbit IgG in stabilizing components, phosphate buffered saline, pH 7.4, 150mM NaCl, 0.02% sodium azide and 50% glycerol.
*This antibody is supplied in a stabilized formulation.
Compatibility with conjugation reactions depends on the chemistry of the conjugation method used.
For conjugation methods that are not compatible with the stabilizing components present in this formulation, a carrier-free antibody format is required.
Clonality
Monoclonal
Clone Number
GC-9
Isotype
Rabbit IgG
Immunogen
A synthesized peptide derived from human CD11b
Reactive Species
M00144-1 is reactive to ITGAM in Human, Mouse, Rat
Observed Molecular Weight
170 kDa
Calculated molecular weight
127.2 kDa
Antibody Validation
Boster validates all antibodies on WB, IHC, ICC, Immunofluorescence, and ELISA with known positive control and negative samples to ensure specificity and high affinity, including thorough antibody incubations.
Application & Images
Applications
M00144-1 is guaranteed for IF, IHC, ICC, WB Boster Guarantee
Recommend Dilution
WB 1:500-2000
IHC 1:50-200
ICC/IF 1:50-200
Tested application
Suggested blocking solution with 5% non-fat milk or BSA; (*)Recommended protein loading: 20-40 µg per lane
Use TE buffer pH 9.0 for antigen retrieval; (*) citrate buffer pH 6.0 is an alternative.
Validation Images & Assay Conditions
Click image to see more details
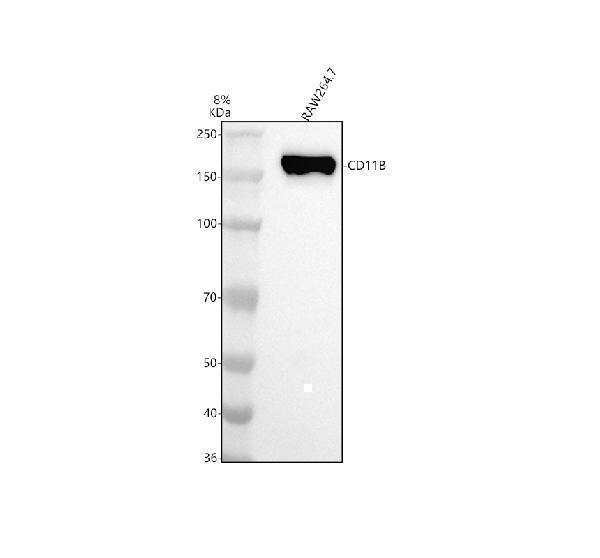
Western blot analysis of CD11B/Integrin Alpha M/ITGAM using anti-CD11B/Integrin Alpha M/ITGAM antibody (M00144-1).
Electrophoresis was performed on a 5-20% SDS-PAGE gel at 70V (Stacking gel) / 90V (Resolving gel) for 2-3 hours. The sample well of each lane was loaded with 30 ug of sample under reducing conditions.
Lane 1: mouse RAW264.7 whole cell lysates.
After electrophoresis, proteins were transferred to a nitrocellulose membrane at 150 mA for 50-90 minutes. Blocked the membrane with 5% non-fat milk/TBS for 1.5 hour at RT. The membrane was incubated with rabbit anti-CD11B/Integrin Alpha M/ITGAM antigen affinity purified monoclonal antibody (M00144-1) at 1:500 overnight at 4°C, then washed with TBS-0.1%Tween 3 times with 5 minutes each and probed with a goat anti-rabbit IgG-HRP secondary antibody at a dilution of 1:5000 for 1.5 hour at RT. The signal is developed using an Enhanced Chemiluminescent detection (ECL) kit (Catalog # EK1002) with Tanon 5200 system. A specific band was detected for CD11B/Integrin Alpha M/ITGAM at approximately 170 kDa. The expected band size for CD11B/Integrin Alpha M/ITGAM is at 127 kDa.

Click image to see more details
Immunohistochemical analysis of paraffin-embedded human spleen, using CD11b Antibody.

Click image to see more details
Immunohistochemical analysis of paraffin-embedded mouse lung, using CD11b Antibody.

Click image to see more details
Honokiol protects against mouse NASH. A Schematic of the CDAHFD-induced NASH model and evaluating the therapeutic effects of honokiol in vivo (100 mg/kg). B Body weights of NC- or CDAHFD-fed mice treated with honokiol or vehicle three weeks after subjecting them to their respective diets for one week. n = 6 mice per group. One-way ANOVA was used for statistical analysis. C Liver weights and ratio of liver weight to body weight (LW/BW) of NC- or CDAHFD-fed mice treated with honokiol or CMC three weeks after subjecting them to their respective diets for one week. n = 6 mice per group. One-way ANOVA assay was used for statistical analysis. D Blood glucose concentrations during GTT and the AUC of GTT of CDAHFD-fed mice treated with vehicle or honokiol. E Fasting blood glucose (FBG) concentrations of CDAHFD-fed mice treated with vehicle or honokiol. n = 6 mice per group. Student’s t -test was applied for statistical analysis. F TG, TC and NEFA levels in the livers of CDAHFD-fed mice treated with honokiol or vehicle. n = 6 mice per group. Student’s t -test was applied for statistical analysis. G Representative images of indicated mouse liver sections stained with HE, ORO, PSR, and IHC for CD11b-positive cells. n = 6 mice per group. Scale bar 50 μm. H Results of NAS (HE) and quantitative analysis of ORO, PSR, and CD11b shown in ( G ). n = 6 mice per group. The Mann–Whitney U test was used for NAS and Student’s t -test was applied to ORO, PSR, and CD11b data. I Serum ALT and AST activity and serum TG concentrations in CDAHFD-fed mice treated with honokiol or vehicles. n = 6 mice per group. Student’s t -test was applied for statistical analysis. J Schematic of the MCD-induced NASH model and evaluating the therapeutic effects of honokiol in vivo (100 mg/kg). K TG, TC. and NEFA levels in the livers of MCD-fed mice treated with honokiol or vehicle. n = 6 mice per group. Student’s t -test was applied for statistical analysis. L Representative images of the indicated mouse liver sections stained with HE, ORO, PSR, and IHC for CD11b-positive cells. n = 6 mice per group. Scale bar 50 μm. M Results of NAS (HE) and quantitative analysis of ORO, PSR, and CD11b data shown in ( L) . n = 6 mice per group. For statistical analysis, the Mann–Whitney U test was used for NAS and Student’s t -test was applied to ORO, PSR, and CD11b. N Serum ALT and AST activity of MCD-fed mice treated with honokiol or vehicle. n = 6 mice per group. Student’s t -test was applied for statistical analysis. O GSVA pathway enrichment analysis related to cell damage and death, inflammation, lipid metabolism, and fibrosis differentially regulated by honokiol treatment. n = 5 mice per group. P Heatmaps of gene expression profiles involved in cell damage and death, lipid metabolism, inflammation, and fibrosis
Index in PubMed under a CC BY license. PMID: 36932412

Click image to see more details
Honokiol ameliorates high fat diet (HFD)-induced non-alcoholic fatty liver disease. A Schematic showing HFD-induced NAFLD and evaluation of therapeutic effects of honokiol in vivo (100 mg/kg). B and C Body ( B ) and liver weight ( C ) of NC- or HFD-fed mice treated with honokiol or vehicle after 12 weeks of their respective diets. n = 6 mice per group. One-way ANOVA was used for statistical analysis. D Representative images of indicated mouse liver sections stained with hematoxylin and eosin (HE), oil red O (ORO), picrosirius red (PSR), and immunohistochemistry (IHC) of CD11b-positive cells. n = 6 mice per group. Scale bar 50 μm. E Results of NAS (HE) and quantitative analysis of ORO, PSR, and CD11b shown in ( D ). n = 6 mice per group. Mann–Whitney U test was used for NAS, while Student’s t -test was applied to ORO, PSR, and CD11b data. F TG, TC, and non-esterified fatty acids (NEFA) in the livers of HFD-fed mice treated with honokiol or vehicle after 12 weeks of their respective diets. n = 6 mice per group. Student’s t -test was applied for statistical analysis. G Serum ALT and AST activity in HFD-fed mice treated with honokiol or vehicle after 12 weeks of their respective diets. n = 6 mice per group. Student’s t -test was applied for statistical analysis. H Serum TC and TG concentrations in HFD-fed mice treated with honokiol or vehicle after 12 weeks of their respective diets. n = 6 mice per group. Student’s t -test was applied for statistical analysis. I Heart weights and heart histological staining of HFD-fed mice treated with honokiol or vehicle after 12 weeks of their respective diets. n = 6 mice per group. Student’s t -test was applied for statistical analysis. Scale bar 50 μm. J Kidney and spleen weights of HFD-fed mice treated with honokiol or vehicle after 12 weeks of their respective diets. n = 6 mice per group. Student’s t -test was applied for statistical analysis. K GSVA enrichment analysis related to inflammation, lipid metabolism, and fibrosis downregulated by honokiol treatment. n = 5 mice per group. L Heatmap of gene expression profiles involved in cell damage and death, inflammation, and lipid metabolism. n = 5 mice per group
Index in PubMed under a CC BY license. PMID: 36932412

Click image to see more details
Laptm5 -HKO exacerbates HFHC-induced NASH. a Fasting blood glucose of Laptm5 -HKO and Laptm5 -Flox mice for NC or HFHC consumptions ( n = 10 mice/group). b and c Liver weight and LW/BW ( b ), and hepatic TG, TC contents ( c ) of Laptm5 -HKO and Laptm5 -Flox mice after NC or HFHC feeding for 8 or 16 weeks ( n = 10 mice/group). d H&E (upper) and Oil Red O (lower) staining in the liver sections of mice in the indicated groups ( n = 6 mice/group). Scale bar, 100 μm. e and f NAS score analysis ( e ) and the statistical analysis of Oil red O staining ( f ) of Laptm5 -HKO and Laptm5 -Flox mice after NC or HFHC feeding for 8 or 16 weeks ( n = 6 mice/group). g Immunofluorescence staining ( g ) and statistical analysis ( h , i ) of CD11b (red) in the liver sections of mice in the indicated groups. (Nuclei, blue) ( n = 4 mice/group). Scale bar, 50 μm. PSR staining of mice liver sections in the indicated groups. (8 weeks, n = 6 mice/group, 16 weeks, n = 7 Laptm5 -Flox mice and n = 5 Laptm5 -HKO mice). Scale bars, 100 μm. j Serum ALT and AST concentrations of mice in the indicated groups ( n = 10 mice/group). k Hierarchical clustering analysis of the RNA-seq data from the mice fed the HFHC diet. l and m GSEA pathway enrichment analysis of pathways related to lipid metabolism, inflammation, apoptosis, and fibrosis. n Heatmaps of the genes related to lipid metabolism, inflammatory responses, and fibrosis (red, upregulated; blue, downregulated) in the indicated groups. Data are represented as mean ± SD. The Mann–Whitney U nonparametric statistical test was used for statistical analysis in ( c —8w, e —16w, and i —16w) and two-tailed Student’s t -test in other panels. Source data are provided as a Source data file.
Index in PubMed under a CC BY license. PMID: 37156795

Click image to see more details
Macrophage PKM2 expression was markedly upregulated in liver tissues with ALI. (A) Log ratio–average (M–A) plots showing the changes in gene expression in ALF patients and control individual (GSE255777). (B) Gene set enrichment analysis (GSEA) of the DEGs. (C) Representative images and quantification of H&E- and immunohistochemistry staining of PKM1 and PKM2 in liver tissues of APAP- or LPS/D-GaIN-induced ALI mice and control mice. (D) Dual immunofluorescence staining for PKM2 and HNF-4α (A) or F4/80 (B) in liver tissues of APAP-induced ALI mice and control mice. (E) Representative images of H&E staining, dual immunofluorescence staining for PKM2 and F4/80, and immunohistochemistry staining for CD11b in APAP-induced mouse ALI at the indicated time points with quantification. Scale bar: 100 μm. White arrows indicate PKM2 + F4/80 + cells; Necrotic region was enclosed in dotted lines. *** P < 0.001. Error bars depict the standard deviations.
Index in PubMed under a CC BY license. PMID: 40351417

Click image to see more details
The regulatory effect of SIRT4 on ferroptosis in SAP depends on the HIF-1α/HO-1 pathway. A – B The protein expression levels of HIF-1α, HO-1 and NQO-1 in the pancreas of mice. C Serum amylase level and lipase activity of mice in different groups after using HIF-1α inhibitor PX478 (100 mg/kg). D Representative HE staining images of mice pancreas in different groups after using HIF-1α inhibitor PX478 (100 mg/kg). Scale bar = 100 µm. E The levels of oxidative stress factors (GSH, H 2 O 2 , SOD, MDA) in the pancreas of mice in different groups after using HIF-1α inhibitor PX478 (100 mg/kg). F Representative IHC staining of CD11b, MPO, Ly6G and 4-HNE in the pancreas of mice in different groups after using HIF-1α inhibitor PX478(100 mg/kg). Scale bar = 100 µm. G The protein expression level of HIF-1α, HO-1, NQO-1, ACSL, GPX4 and SLC7A11 in the pancreas of mice in different groups after using HIF-1α inhibitor PX478 (100 mg/kg). WT + SAP group, SIRT4_KO + SAP group, SIRT4_KO + PX478 + SAP group. A – G used GAPDH as the reference protein. * P < 0.05, ** P < 0.01, *** P < 0.001, ns. not significant. n = 6 per group.
Index in PubMed under a CC BY license. PMID: 37865653

Click image to see more details
USP29 knockout accelerates hepatic steatosis, inflammation and fibrosis induced by a HFHC diet. (A) blood glucose of WT and USP29-KO mice after NC or HFHC diet treatment for 16weeks (n=8–10 mice/group). (b) GTTs of WT mice and USP29-KO mice were analyzed at the week 15 fed NC chow or HFHC diet (n=8–10 mice/group). (C) The ratio of liver weight to body weight of WT mice and USP29-KO mice fed NC chow or HFD diet for 16 weeks (n=8–10 mice/group). (D) Hepatic TG content and (E) serum TG, TC and LDL-C content were detected in WT mice and USP29-KO mice fed NC or HFHC diet for 16 weeks (n=8–10 mice/group). (F) Representative images and relative quantitative statistical analysis of H&E, Oil red O staining of liver tissue from WT and USP29-KO mice fed HFHC diet for 16 weeks (n=6 mice/group). Scale bar, 50 μm. (G) Representative images and relative quantitative statistical analysis of CD11b, F4/80, PSR and a-SMA staining of liver tissue from WT and USP29-KO mice fed HFHC diet for 16 weeks (n=4–6 mice/group). Scale bar, 50 μm. The data are presented as mean±SD, * indicates a statistical analysis between WT-NC group and WT-HFHC group ( ** P <0.01, n.s., not significant). # indicates a statistical analysis between WT-HFHC group and USP29-KO-HFHC group ( # P <0.05, ## P <0.01, n.s., not significant). WT, wild type; KO, USP29 knockout; NC, normal chow; HFHC, high-fat high cholesterol; GTT, glucose tolerance test; TG, total triglyceride; TC, total cholesterol; LDL-C, low density lipoprotein cholesterol; H&E, hematoxylin and eosin; PSR, picro Sirius Red.
Index in PubMed under a CC BY license. PMID: 39355870

Click image to see more details
SIRT4 regulated inflammatory response and oxidative stress during SAP in mice. A – B Statistics for the levels of inflammatory factors (IL-6, IL-1β, TNF-α and MCP-1). C – D Statistics for the levels of oxidative stress (GSH, H 2 O 2 , SOD and MDA) in the pancreas of mice. E – F Representative immunohistochemical staining of CD11b, MPO and Ly6G in the pancreas of mice. Scale bar = 100 µm. * P < 0.05, ** P < 0.01, *** P < 0.001, ns. not significant. n = 6 per group.
Index in PubMed under a CC BY license. PMID: 37865653

Click image to see more details
SIRT4 mitigated SAP by suppressing ferroptosis. A Fer-1 decreased the serum amylase level and lipase activity of SAP mice induced by L-Arg. B Representative HE staining images of pancreas. Scale bar = 100 µm. C The levels of oxidative stress (GSH, H 2 O 2 , SOD, MDA) in the pancreas of mice. D Representative IHC staining of CD11b, MPO, Ly6G and 4-HNE in the pancreas of mice in different groups. Scale bar = 100 µm. E The protein expression level of ferroptosis-related proteins (ACSL4, GPX4, SLC7A11) in the pancreas of mice in different groups. WT + SAP group, SIRT4_KO + SAP group, SIRT4_KO+Fer-1 + SAP group. E used GAPDH as the reference protein. * P < 0.05, ** P < 0.01, *** P < 0.001. n = 6 per group.
Index in PubMed under a CC BY license. PMID: 37865653

Click image to see more details
RNF5 knockout increased inflammatory response and apoptosis after MI in vivo. ( A ) Representative images (Left) and quantitative results (Right) of CD11B immunohistochemical staining of heart sections of the two groups of mice ( n = 6). Scale bar, 50 μm. (B) Representative images and quantitative results of Ly6g immunohistochemical staining of heart sections of the two groups of mice ( n = 6). Scale bar, 50 μm. ( C ) RT-PCR results of inflammatory responses associated genes including Tnf , Il6 , Il1b , and Ccl2 in WT and RNF5-KO mice subjected to MI surgery ( n = 4). ( D ) Western blot (Left) and quantification results (Right) of NF-κB signaling pathway-related proteins in wild type and RNF5-KO mice subjected to MI surgery ( n = 3). GAPDH was used as loading control. ( E ) Representative images (Up) and quantitative results (Down) of TUNEL staining of mice heart tissues sections from the indicated group ( n = 4). Scale bar, 20 μm. ( F ) RT-PCR results of apoptosis-related genes in wild type and RNF5-KO mice subjected to MI surgery ( n = 4). The RNA expression levels were normalized to Gapdh . ( G ) Western blot (Left) and quantification results (Right) of apoptosis-related proteins in wild type and RNF5-KO mice subjected to MI surgery ( n = 3). GAPDH was used as loading control. For statistical analysis, a two-tailed Student’s t -test was used. * for p < 0.05 and ** for p < 0.01 vs. WT MI 24 h group
Index in PubMed under a CC BY license. PMID: 39098896

Click image to see more details
Deletion of PKM2 in macrophages reprogrammed M1 macrophages to M2 macrophages. (A) Representative images and quantification of immunofluorescence staining for iNOS and CD206 in the liver tissues of PKM2 ΔMAC and PKM2 FL/FL mice after 24 h of APAP induction (300 mg/kg). (B) Protein levels of p-STAT1, STAT1, p-STAT6 and STAT6 in liver tissues of PKM2 ΔMAC and PKM2 FL/FL mice induced by APAP or saline. (C) The mRNA levels of Tnfa , Il1b and Il6 in BMDMs of PKM2 ΔMAC and PKM2 FL/FL mice treated with or without LPS/IFN-γ. (D) Flow cytometry analysis of total macrophages (F4/80 + CD11b + ) and M1 (F4/80 + CD11b + CD86 + ) macrophages from BMDMs treated with LPS/IFN-γ, along with analysis of total macrophages (F4/80 + CD11b + ) and M2 (F4/80 + CD11b + CD206 + ) macrophages from BMDMs treated with IL-4 in vitro . (E) Schematic diagram illustrating the co-culture system of BMDMs and primary hepatocytes of indicated mice in the presence of LPS/IFN-γ. (F) The mRNA levels of Tnfa , Il1b and Il6 of hepatocytes co-cultured with indicated BMDMs. (G) The levels of HMGB1 in hepatocytes co-cultured with indicated BMDMs. Scale bar: 100 μm * P < 0.05; ** P < 0.01; *** P < 0.001. Error bars depict the standard deviations. BMDMs, bone marrow-derived macrophages.
Index in PubMed under a CC BY license. PMID: 40351417

Click image to see more details
Macrophage PKM2 knockout mice showed ameliorated hepatic inflammation and hepatocyte apoptosis. ( A, B ) Representative images and quantification of TUNEL staining (A) and immunohistochemistry staining for Cleaved Caspase 3 (B) of PKM2 ΔMAC and PKM2 FL/FL mice after 24 h of APAP induction (300 mg/kg). ( C, D ) Representative images and quantification of immunohistochemistry staining for CD11b (C) and F4/80 (D) of PKM2 ΔMAC and PKM2 FL/FL mice after 24 h of APAP induction (300 mg/kg). Black arrow indicates CD11b + cells. ( E ) The mRNA levels of Tnfa, Il1b, Il6 in liver tissues of PKM2 ΔMAC and PKM2 FL/FL mice with or without APAP treatment. ( F, G ) The levels of TNF-α (F) and HMGB1 (G) in serum of PKM2 ΔMAC and PKM2 FL/FL mice with or without APAP treatment. Scale bar: 100 μm. *** P < 0.001. Error bars depict the standard deviations.
Index in PubMed under a CC BY license. PMID: 40351417

Click image to see more details
AMPK activation is required for honokiol-mediated beneficial effects in vivo. A Schematic of the experimental procedure used with mice fed a CDAHFD diet and treated with vehicle or honokiol (100 mg/kg) in the absence or presence of compound C (CC, 10 mg/kg, every other day, i.p.). B Western blots of p-AMPKα, AMPKα, p-ACC, and ACC of mice in the indicated groups. n = 3 mice per group. C The blood glucose concentration during GTT of CDAHFD-fed mice in the indicated groups. n = 6 mice per group. One-way ANOVA was applied for statistical analysis. P -values of the red color represent the comparison of PBS-vehicle vs PBS-honokiol, while black represents CC-vehicle vs CC-honokiol. D Liver contents of TG, TC, and NEFA of CDAHFD-fed mice in the indicated groups. n = 6 mice per group. The Kruskal–Wallis test was applied for statistical analysis. E Representative images of the indicated mouse liver sections stained with HE, ORO, PSR, and IHC for CD11b-positive cells. n = 6 mice per group. Scale bar, 50 μm. F Results of NAS (HE) and quantitative analysis of ORO, PSR, and CD11b data shown in ( E ). n = 6 mice per group. For statistical analysis, the Kruskal–Wallis test was used for NAS and one-way ANOVA was applied to ORO, PSR, and CD11b data. G Serum ALT and AST activity of CDAHFD-fed mice shown in the indicated groups. n = 6 mice per group. Student’s t -test was applied for statistical analysis. H Serum TC concentrations in CDAHFD-fed mice treated with the indicated groups. n = 6 mice per group. Student’s t -test was applied for statistical analysis. I Dot plot representing pairwise GSVA comparisons of transcriptomic data from CDAHFD-fed mice shown in the indicated groups. J Heatmap of transcriptomic data from CDAHFD-fed mice shown in the indicated groups
Index in PubMed under a CC BY license. PMID: 36932412

Click image to see more details
Adenovirus-mediated hepatic Laptm5 over-expression alleviated non-alcoholic steatohepatitis. a Scheme of constructing Ad LAPTM5 -mediated therapeutic NASH models in HFHC mice. b Represents the WB detection results of the proteins indicated in the groups ( n = 3 mice/group). c and d Fasting blood glucose ( c ), liver weight, and LW/BW ( d ) of mice in the indicated groups ( n = 10 mice/group). e Hepatic TG and TC contents of mice in the indicated group ( n = 10 mice/group). f H&E (upper) ( n = 6 mice/group) and Oil Red O (lower) ( n = 5 mice/group) staining in the liver sections. Scale bar, 100 μm. g NAS score analysis of the group in panel ( f ) ( n = 6 mice/group). h Statistical analysis of Oil red O in the group of the panel ( f ) ( n = 5 mice/group). i Relative mRNA levels of genes related to the fatty acid metabolism in the livers of mice in the indicated groups ( n = 6 mice/group). j and k Immunofluorescence staining ( j ) and Statistical analysis ( k ) of CD11b (red) in the liver sections of HFHC-fed mice in the indicated groups ( n = 5 mice/group). Scale bar, 50 μm. l Relative mRNA levels of pro-inflammatory genes in the livers of mice in the indicated groups ( n = 6 mice/group). m Serum ALT and AST concentrations of mice in the indicated groups ( n = 10 mice/group). Data are represented as mean ± SD, two-tailed Student’s t -test was used to evaluate differences in all panels. Source data are provided as a Source data file.
Index in PubMed under a CC BY license. PMID: 37156795
Specific Publications For Anti-CD11b ITGAM Rabbit Monoclonal Antibody (M00144-1)
Loading publications
Recommended Resources
Here are featured tools and databases that you might find useful.
- Boster's Pathways Library
- Protein Databases
- Bioscience Research Protocol Resources
- Data Processing & Analysis Software
- Photo Editing Software
- Scientific Literature Resources
- Research Paper Management Tools
- Molecular Biology Software
- Primer Design Tools
- Bioinformatics Tools
- Phylogenetic Tree Analysis
Customer Reviews
Have you used Anti-CD11b ITGAM Rabbit Monoclonal Antibody?
Share your experimental results or join a short interview to earn up to $1,000 in product credits or other rewards.
0 Reviews For Anti-CD11b ITGAM Rabbit Monoclonal Antibody
Customer Q&As
Have a question?
Find answers in Q&As, reviews.
Can't find your answer?
Submit your question
16 Customer Q&As for Anti-CD11b ITGAM Rabbit Monoclonal Antibody
Question
My question regarding product M00144-1, anti-CD11b Rabbit Monoclonal antibody. I was wondering if it would be possible to conjugate this antibody with biotin. I would need it to be without BSA or sodium azide. I am planning on using a buffer exchange of sodium azide with PBS only. Would there be problems for me to conjugate the antibody and store it in -20 degrees in small aliquots?
S. Jackson
Verified customer
Asked: 2020-04-30
Answer
We suggest not storing this antibody with PBS buffer only in -20 degrees. If you want to store it in -20 degrees it is best to add some cryoprotectant like glycerol. If you want carrier free M00144-1 anti-CD11b Rabbit Monoclonal antibody, we can provide it to you in a special formula with trehalose and/or glycerol. These molecules will not interfere with conjugation chemistry and provide a good level of protection for the antibody from degradation. Please be sure to specify this in your purchase order.
Boster Scientific Support
Answered: 2020-04-30
Question
My boss were content with the WB result of your anti-CD11b Rabbit Monoclonal antibody. However we have been able to see positive staining in liver cell membrane using this antibody. Is that expected? Could you tell me where is ITGAM supposed to be expressed?
Verified Customer
Verified customer
Asked: 2020-04-28
Answer
According to literature, liver does express ITGAM. Generally ITGAM expresses in cell membrane. Regarding which tissues have ITGAM expression, here are a few articles citing expression in various tissues:
Blood, Pubmed ID: 1346576, 3539202
Liver, Pubmed ID: 19159218
Boster Scientific Support
Answered: 2020-04-28
Question
I was wanting to use your anti-CD11b Rabbit Monoclonal antibody for IHC for mouse blood on frozen tissues, but I want to know if it has been validated for this particular application. Has this antibody been validated and is this antibody a good choice for mouse blood identification?
Verified Customer
Verified customer
Asked: 2020-02-26
Answer
As indicated on the product datasheet, M00144-1 anti-CD11b Rabbit Monoclonal antibody has been validated for IF, IHC, ICC, WB on human, mouse tissues. We have an innovator award program that if you test this antibody and show it works in mouse blood in IHC-frozen, you can get your next antibody for free.
Boster Scientific Support
Answered: 2020-02-26
Question
Is this M00144-1 anti-CD11b Rabbit Monoclonal antibody reactive to the isotypes of ITGAM?
Verified Customer
Verified customer
Asked: 2020-01-17
Answer
The immunogen of M00144-1 anti-CD11b Rabbit Monoclonal antibody is A synthesized peptide derived from human CD11b. Could you tell me which isotype you are interested in so I can help see if the immunogen is part of this isotype?
Boster Scientific Support
Answered: 2020-01-17
Question
Does anti-CD11b Rabbit Monoclonal antibody M00144-1 work on zebrafish IF with bone marrow cell?
Verified Customer
Verified customer
Asked: 2019-12-13
Answer
Our lab technicians have not tested anti-CD11b Rabbit Monoclonal antibody M00144-1 on zebrafish. You can run a BLAST between zebrafish and the immunogen sequence of anti-CD11b Rabbit Monoclonal antibody M00144-1 to see if they may cross-react. If the sequence homology is close, then you can perform a pilot test. Keep in mind that since we have not validated zebrafish samples, this use of the antibody is not covered by our guarantee. However we have an innovator award program that if you test this antibody and show it works in zebrafish bone marrow cell in IF, you can get your next antibody for free.
Boster Scientific Support
Answered: 2019-12-13
Question
We appreciate helping with my inquiry over the phone. Here are the WB image, lot number and protocol we used for blood using anti-CD11b Rabbit Monoclonal antibody M00144-1. Let me know if you need anything else.
Verified Customer
Verified customer
Asked: 2019-09-04
Answer
Thanks for the data. You have provided everything we needed. Our lab team are working to resolve your inquiry as quickly as possible, and we appreciate your patience and understanding! Please let me know if there is anything you need in the meantime.
Boster Scientific Support
Answered: 2019-09-04
Question
We are currently using anti-CD11b Rabbit Monoclonal antibody M00144-1 for human tissue, and we are content with the WB results. The species of reactivity given in the datasheet says human, mouse. Is it true that the antibody can work on pig tissues as well?
Verified Customer
Verified customer
Asked: 2019-08-23
Answer
The anti-CD11b Rabbit Monoclonal antibody (M00144-1) has not been validated for cross reactivity specifically with pig tissues, though there is a good chance of cross reactivity. We have an innovator award program that if you test this antibody and show it works in pig you can get your next antibody for free. Please contact me if I can help you with anything.
Boster Scientific Support
Answered: 2019-08-23
Question
I see that the anti-CD11b Rabbit Monoclonal antibody M00144-1 works with IHC, what is the protocol used to produce the result images on the product page?
Verified Customer
Verified customer
Asked: 2019-08-01
Answer
You can find protocols for IHC on the "support/technical resources" section of our navigation menu. If you have any further questions, please send an email to support@bosterbio.com
Boster Scientific Support
Answered: 2019-08-01
Question
Would M00144-1 anti-CD11b Rabbit Monoclonal antibody work on parafin embedded sections? If so, which fixation method do you recommend we use (PFA, paraformaldehyde, other)?
Verified Customer
Verified customer
Asked: 2019-02-21
Answer
It shows on the product datasheet, M00144-1 anti-CD11b Rabbit Monoclonal antibody as been validated on IHC. It is best to use PFA for fixation because it has better tissue penetration ability. PFA needs to be prepared fresh before use. Long term stored PFA turns into formalin, as the PFA molecules congregate and become formalin.
Boster Scientific Support
Answered: 2019-02-21
Question
Here is the WB image, lot number and protocol we used for blood using anti-CD11b Rabbit Monoclonal antibody M00144-1. Please let me know if you require anything else.
Verified Customer
Verified customer
Asked: 2019-01-21
Answer
Thank you very much for the data. Our lab team are working to resolve this as quickly as possible, and we appreciate your patience and understanding! You have provided everything we needed. Please let me know if there is anything you need in the meantime.
Boster Scientific Support
Answered: 2019-01-21
Question
Do you have a BSA free version of anti-CD11b Rabbit Monoclonal antibody M00144-1 available?
W. Zhang
Verified customer
Asked: 2018-10-24
Answer
Thank you for your recent telephone inquiry. I can confirm that some lots of this anti-CD11b Rabbit Monoclonal antibody M00144-1 are BSA free. For now, these lots are available and we can make a BSA free formula for you free of charge. It will take 3 extra days to prepare. If you require this antibody BSA free again in future, please do not hesitate to contact me and I will be pleased to check which lots we have in stock that are BSA free.
Boster Scientific Support
Answered: 2018-10-24
Question
Will anti-CD11b Rabbit Monoclonal antibody M00144-1 work for IHC with blood?
Verified Customer
Verified customer
Asked: 2017-06-28
Answer
According to the expression profile of blood, ITGAM is highly expressed in blood. So, it is likely that anti-CD11b Rabbit Monoclonal antibody M00144-1 will work for IHC with blood.
Boster Scientific Support
Answered: 2017-06-28
Question
We have tried in the past anti-CD11b Rabbit Monoclonal antibody for IF on blood in a previous project. I am using mouse, and I plan to use the antibody for IHC next. My question regards examining blood as well as bone marrow cell in our next experiment. Do you have any suggestion on which antibody would work the best for IHC?
A. Krishna
Verified customer
Asked: 2017-05-03
Answer
I have checked the website and datasheets of our anti-CD11b Rabbit Monoclonal antibody and I see that M00144-1 has been validated on mouse in both IF and IHC. Thus M00144-1 should work for your application. Our Boster satisfaction guarantee will cover this product for IHC in mouse even if the specific tissue type has not been validated. We do have a comprehensive range of products for IHC detection and you can check out our website bosterbio.com to find out more information about them.
Boster Scientific Support
Answered: 2017-05-03
Question
Is a blocking peptide available for product anti-CD11b Rabbit Monoclonal antibody (M00144-1)?
N. Krishna
Verified customer
Asked: 2015-08-17
Answer
We do provide the blocking peptide for product anti-CD11b Rabbit Monoclonal antibody (M00144-1). If you would like to place an order for it please contact support@bosterbio.com and make a special request.
Boster Scientific Support
Answered: 2015-08-17
Question
We have seen staining in mouse bone marrow cell. Any tips? Is anti-CD11b Rabbit Monoclonal antibody supposed to stain bone marrow cell positively?
J. Jones
Verified customer
Asked: 2013-11-11
Answer
According to literature bone marrow cell does express ITGAM. According to Uniprot.org, ITGAM is expressed in bone marrow cell, blood, liver, among other tissues. Regarding which tissues have ITGAM expression, here are a few articles citing expression in various tissues:
Blood, Pubmed ID: 1346576, 3539202
Liver, Pubmed ID: 19159218
Boster Scientific Support
Answered: 2013-11-11
Question
I would like to test anti-CD11b Rabbit Monoclonal antibody M00144-1 on mouse blood for research purposes, then I may be interested in using anti-CD11b Rabbit Monoclonal antibody M00144-1 for diagnostic purposes as well. Is the antibody suitable for diagnostic purposes?
P. Krishna
Verified customer
Asked: 2013-06-26
Answer
The products we sell, including anti-CD11b Rabbit Monoclonal antibody M00144-1, are only intended for research use. They would not be suitable for use in diagnostic work. If you have the means to develop a product into diagnostic use, and are interested in collaborating with us and develop our product into an IVD product, please contact us for more discussions.
Boster Scientific Support
Answered: 2013-06-26
