
Click image to see more details
-

-
-
-
-
+24
Product Info Summary
| SKU: | A00066-1 |
|---|---|
| Size: | 100 μg/vial |
| Reactive Species: | Human, Mouse, Rat |
| Host: | Rabbit |
| Application: | Flow Cytometry, IF, IHC, ICC, WB |
Customers Who Bought This Also Bought

Product info
Product Name
Anti-HMGB1 Antibody Picoband®
SKU/Catalog Number
A00066-1
Size
100 μg/vial
Form
Lyophilized
Description
Boster Bio Anti-HMGB1 Antibody Picoband® catalog # A00066-1. Tested in Flow Cytometry, IF, IHC, ICC, WB applications. This antibody reacts with Human, Mouse, Rat. The brand Picoband indicates this is a premium antibody that guarantees superior quality, high affinity, and strong signals with minimal background in Western blot applications. Only our best-performing antibodies are designated as Picoband, ensuring unmatched performance.
Storage & Handling
Store at -20˚C for one year from date of receipt. After reconstitution, at 4˚C for one month. It can also be aliquotted and stored frozen at -20˚C for six months. Avoid repeated freeze-thaw cycles.
Cite This Product
Anti-HMGB1 Antibody Picoband® (Boster Biological Technology, Pleasanton CA, USA, Catalog # A00066-1)
Host
Rabbit
Contents
Each vial contains 4mg Trehalose, 0.9mg NaCl, 0.2mg Na2HPO4, 0.05mg NaN3.
Clonality
Polyclonal
Isotype
Rabbit IgG
Immunogen
A synthetic peptide corresponding to a sequence at the C-terminus of human HMGB1, identical to the related mouse and rat sequences.
Cross-reactivity
No cross-reactivity with other proteins
Reactive Species
A00066-1 is reactive to HMGB1 in Human, Mouse, Rat
Observed Molecular Weight
25 kDa
Calculated molecular weight
24.9 kDa
Background of HMGB1
High mobility group box 1 protein, also known as high-mobility group protein 1 (HMG-1) and amphoterin, is a protein that in humans is encoded by the HMGB1 gene. This gene encodes a protein that belongs to the High Mobility Group-box superfamily. The encoded non-histone, nuclear DNA-binding protein regulates transcription, and is involved in organization of DNA. This protein plays a role in several cellular processes, including inflammation, cell differentiation and tumor cell migration. Multiple pseudogenes of this gene have been identified. Alternative splicing results in multiple transcript variants that encode the same protein.
Antibody Validation
Boster validates all antibodies on WB, IHC, ICC, Immunofluorescence, and ELISA with known positive control and negative samples to ensure specificity and high affinity, including thorough antibody incubations.
Application & Images
Applications
A00066-1 is guaranteed for Flow Cytometry, IF, IHC, ICC, WB Boster Guarantee
Recommend Dilution
| Application | Dilution | Species |
|---|---|---|
| Immunohistochemistry (Paraffin-embedded Section) | 0.5-1μg/ml | Human, Mouse, Rat |
| Western blot | 0.1-0.5μg/ml | Human, Mouse, Rat |
| Immunocytochemistry/Immunofluorescence | 2μg/ml | Human |
| Flow Cytometry (Fixed) | 1-3μg/1x106 cells | Human |
Tested application
Suggested blocking solution with 5% non-fat milk or BSA; (*)Recommended protein loading: 20-40 µg per lane
Use TE buffer pH 9.0 for antigen retrieval; (*) citrate buffer pH 6.0 is an alternative.
Validation Images & Assay Conditions
Click image to see more details
Western blot analysis of HMGB1 using anti-HMGB1 antibody (A00066-1).
Electrophoresis was performed on a 5-20% SDS-PAGE gel at 70V (Stacking gel) / 90V (Resolving gel) for 2-3 hours. The sample well of each lane was loaded with 30 ug of sample under reducing conditions.
Lane 1: human Hela whole cell lysates,
Lane 2: human 293T whole cell lysates,
Lane 3: human K562 whole cell lysates,
Lane 4: human Jurkat whole cell lysates,
Lane 5: rat brain tissue lysates,
Lane 6: mouse brain tissue lysates.
After electrophoresis, proteins were transferred to a nitrocellulose membrane at 150 mA for 50-90 minutes. Blocked the membrane with 5% non-fat milk/TBS for 1.5 hour at RT. The membrane was incubated with rabbit anti-HMGB1 antigen affinity purified polyclonal antibody (Catalog # A00066-1) at 0.5 μg/mL overnight at 4°C, then washed with TBS-0.1%Tween 3 times with 5 minutes each and probed with a goat anti-rabbit IgG-HRP secondary antibody at a dilution of 1:5000 for 1.5 hour at RT. The signal is developed using an Enhanced Chemiluminescent detection (ECL) kit (Catalog # EK1002) with Tanon 5200 system. A specific band was detected for HMGB1 at approximately 25 kDa. The expected band size for HMGB1 is at 25 kDa.

Click image to see more details
Western blot analysis of HMGB1 using anti-HMGB1 antibody (A00066-1).
Electrophoresis was performed on a 12% SDS-PAGE gel at 80V (Stacking gel) / 120V (Resolving gel) for 2 hours. The sample well of each lane was loaded with 30 ug of sample under reducing conditions.
Lane 1: mouse RAW264.7- WT whole cell lysates,
Lane 2: mouse RAW264.7-Hmgb1 KO whole cell lysates.
After electrophoresis, proteins were transferred to a nitrocellulose membrane at 150 mA for 50-90 minutes. Blocked the membrane with 5% non-fat milk/TBS for 1.5 hour at RT. Then the membrane was incubated with rabbit anti-HMGB1 antigen affinity purified polyclonal antibody (A00066-1) at 0.5 μg/mL overnight at 4°C, then washed with TBS-0.1%Tween 3 times with 5 minutes each and probed with a goat anti-rabbit IgG-HRP secondary antibody (Catalog # BA1054) at a dilution of 1:5000 for 1.5 hour at RT. The signal is developed using an ECL Plus Western Blotting Substrate (Catalog # AR1196-200) with Tanon 5200 system. A specific band was detected for HMGB1 at approximately 25 kDa. The expected band size for HMGB1 is at 25 kDa.

Click image to see more details
IHC analysis of HMGB1 using anti-HMGB1 antibody (A00066-1).
HMGB1 was detected in paraffin-embedded section of mouse liver tissues. Heat mediated antigen retrieval was performed in citrate buffer (pH6, epitope retrieval solution) for 20 mins. The tissue section was blocked with 10% goat serum. The tissue section was then incubated with 1μg/ml rabbit anti-HMGB1 Antibody (A00066-1) overnight at 4°C. Biotinylated goat anti-rabbit IgG was used as secondary antibody and incubated for 30 minutes at 37°C. The tissue section was developed using Strepavidin-Biotin-Complex (SABC)(Catalog # SA1022) with DAB as the chromogen.

Click image to see more details
IHC analysis of HMGB1 using anti-HMGB1 antibody (A00066-1).
HMGB1 was detected in paraffin-embedded section of rat intestine tissues. Heat mediated antigen retrieval was performed in citrate buffer (pH6, epitope retrieval solution) for 20 mins. The tissue section was blocked with 10% goat serum. The tissue section was then incubated with 1μg/ml rabbit anti-HMGB1 Antibody (A00066-1) overnight at 4°C. Biotinylated goat anti-rabbit IgG was used as secondary antibody and incubated for 30 minutes at 37°C. The tissue section was developed using Strepavidin-Biotin-Complex (SABC)(Catalog # SA1022) with DAB as the chromogen.

Click image to see more details
IHC analysis of HMGB1 using anti-HMGB1 antibody (A00066-1).
HMGB1 was detected in paraffin-embedded section of rat liver tissues. Heat mediated antigen retrieval was performed in citrate buffer (pH6, epitope retrieval solution) for 20 mins. The tissue section was blocked with 10% goat serum. The tissue section was then incubated with 1μg/ml rabbit anti-HMGB1 Antibody (A00066-1) overnight at 4°C. Biotinylated goat anti-rabbit IgG was used as secondary antibody and incubated for 30 minutes at 37°C. The tissue section was developed using Strepavidin-Biotin-Complex (SABC)(Catalog # SA1022) with DAB as the chromogen.

Click image to see more details
IHC analysis of HMGB1 using anti-HMGB1 antibody (A00066-1).
HMGB1 was detected in paraffin-embedded section of human mammary cancer tissues. Heat mediated antigen retrieval was performed in citrate buffer (pH6, epitope retrieval solution) for 20 mins. The tissue section was blocked with 10% goat serum. The tissue section was then incubated with 1μg/ml rabbit anti-HMGB1 Antibody (A00066-1) overnight at 4°C. Biotinylated goat anti-rabbit IgG was used as secondary antibody and incubated for 30 minutes at 37°C. The tissue section was developed using Strepavidin-Biotin-Complex (SABC)(Catalog # SA1022) with DAB as the chromogen.

Click image to see more details
IHC analysis of HMGB1 using anti-HMGB1 antibody (A00066-1).
HMGB1 was detected in paraffin-embedded section of human placenta tissues. Heat mediated antigen retrieval was performed in citrate buffer (pH6, epitope retrieval solution) for 20 mins. The tissue section was blocked with 10% goat serum. The tissue section was then incubated with 1μg/ml rabbit anti-HMGB1 Antibody (A00066-1) overnight at 4°C. Biotinylated goat anti-rabbit IgG was used as secondary antibody and incubated for 30 minutes at 37°C. The tissue section was developed using Strepavidin-Biotin-Complex (SABC)(Catalog # SA1022) with DAB as the chromogen.

Click image to see more details
IHC analysis of HMGB1 using anti-HMGB1 antibody (A00066-1).
HMGB1 was detected in paraffin-embedded section of mouse intestine tissues. Heat mediated antigen retrieval was performed in citrate buffer (pH6, epitope retrieval solution) for 20 mins. The tissue section was blocked with 10% goat serum. The tissue section was then incubated with 1μg/ml rabbit anti-HMGB1 Antibody (A00066-1) overnight at 4°C. Biotinylated goat anti-rabbit IgG was used as secondary antibody and incubated for 30 minutes at 37°C. The tissue section was developed using Strepavidin-Biotin-Complex (SABC)(Catalog # SA1022) with DAB as the chromogen.

Click image to see more details
IF analysis of HMGB1 using anti-HMGB1 antibody (A00066-1).
HMGB1 was detected in immunocytochemical section of A431 cells. Enzyme antigen retrieval was performed using IHC enzyme antigen retrieval reagent (AR0022) for 15 mins. The cells were blocked with 10% goat serum. And then incubated with 2μg/mL rabbit anti-HMGB1 Antibody (A00066-1) overnight at 4°C. DyLight®594 Conjugated Goat Anti-Rabbit IgG (BA1142) was used as secondary antibody at 1:100 dilution and incubated for 30 minutes at 37°C. The section was counterstained with DAPI. Visualize using a fluorescence microscope and filter sets appropriate for the label used.

Click image to see more details
IF analysis of HMGB1 using anti- HMGB1 antibody (A00066-1).
HMGB1 was detected in immunocytochemical section of U20S cells. Enzyme antigen retrieval was performed using IHC enzyme antigen retrieval reagent (AR0022) for 15 mins. The cells were blocked with 10% goat serum. And then incubated with 2μg/mL rabbit anti- HMGB1 Antibody (A00066-1) overnight at 4°C. DyLight®594 Conjugated Goat Anti-Rabbit IgG (BA1142) was used as secondary antibody at 1:100 dilution and incubated for 30 minutes at 37°C. The section was counterstained with DAPI. Visualize using a fluorescence microscope and filter sets appropriate for the label used.

Click image to see more details
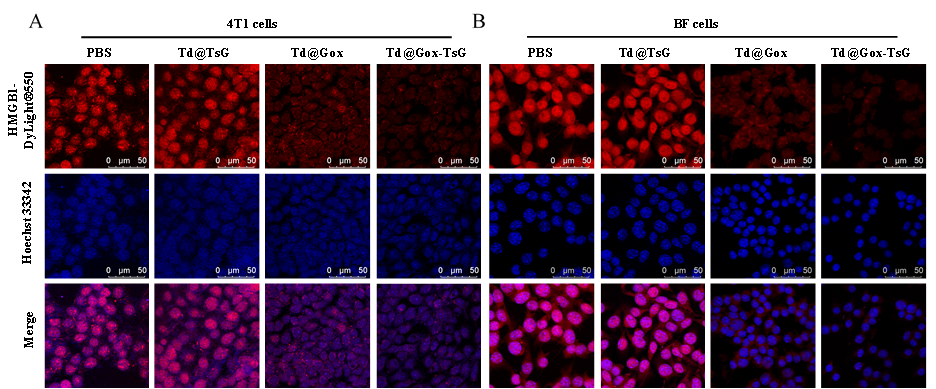
IF analysis of HMGB1 using anti-HMGB1 antibody (A00066-1).
HMGB1 was detected in an immunocytochemical section of Mouse 4T1 cells. Enzyme antigen retrieval was performed using IHC enzyme antigen retrieval reagent (AR0022) for 15 mins. The cells were blocked with 10% goat serum. And then incubated with 5 μg/mL rabbit anti-HMGB1 Antibody (A00066-1) overnight at 4°C. DyLight 550-conjugated Goat Anti-Mouse was used as secondary antibody incubated for 30 minutes at 37°C. The section was counterstained with DAPI. Visualize using a laser confocal microscope with filter sets appropriate for the label used.

Click image to see more details
Flow Cytometry analysis of THP-1 cells using anti-HMGB1 antibody (A00066-1).
Overlay histogram showing THP-1 cells stained with A00066-1 (Blue line).To facilitate intracellular staining, cells were fixed with 4% paraformaldehyde and permeabilized with permeabilization buffer. The cells were blocked with 10% normal goat serum. And then incubated with rabbit anti-HMGB1 Antibody (A00066-1, 1μg/1x106 cells) for 30 min at 20°C. DyLight®488 conjugated goat anti-rabbit IgG (BA1127, 5-10μg/1x106 cells) was used as secondary antibody for 30 minutes at 20°C. Isotype control antibody (Green line) was rabbit IgG (1μg/1x106) used under the same conditions. Unlabelled sample without incubation with primary antibody and secondary antibody (Red line) was used as a blank control.

Click image to see more details
HMGB1 expression in the mPFC was increased temporally in parallel to comorbid anxiety in neuropathic pain. a Schedule of experimental procedures. b Representative photomicrographs of HMGB1 immunostaining in the mPFC, BLA, vHPC and PBN. Scale bar, 200 μm. c Quantification of HMGB1 fluorescence intensity in the mPFC, BLA, vHPC and PBN on D9 PO. d, e Representative images of protein bands in western blotting (left) and quantification of HMGB1 expression (right) in the mPFC ( d ) and BLA ( e ) on D9 and D30 PO. *, ** and *** indicate P < 0.05, 0.01 and 0.001, respectively, compared with the indicated groups, ordinary one-way ANOVA with Tukey post hoc or Kruskal–Wallis test with Dunn’s post hoc in ( c ) and ordinary one-way ANOVA with Dunnett post hoc in ( d ) and ( e ). n = 4/group
Index in PubMed under a CC BY license. PMID: 35974316

Click image to see more details
HMGB1 is highly secreted by basal-like breast cancer cells and its tumor-specific cytoplasmic expression is associated with immune tolerance and poor outcome. (A) The METABRIC dataset was used for analyzing HMGB1 expression level in breast cancers according to molecular subtypes, histologic grades, nodal and metastatic statuses. (B) Representative pictures of normal mammary glands and breast cancers stained for HMGB1. Note the two distinct HMGB1 staining patterns detected in tumor specimens: nuclear versus cytoplasmic. (C) Semiquantitative evaluation of cytoplasmic HMGB1 immunoreactivity (negative, 0%–10% or >10% positive cells) in both normal mammary glands (n=120) and neoplasms (LumA, n=35; LumB, n=31; HER2+, n=37; basal-like, n=172). (D) Disease-free survival of patients treated for basal-like breast cancer according to cytoplasmic HMGB1 expression (negative, n=72; 0%–10%, n=61; >10%, n=39). This latter parameter was clearly found to be an independent prognostic factor. (E) Illustration of the different steps for DAB-positive cell quantification using computerized image analysis (QuPath). (F) CD3 + , Foxp3 + , CD68 + and CD206 + cell infiltrations in microenvironment of basal-like breast tumors. Whereas the global number (CD68 + ) did not significantly change, an increased density of CD206 + M2 macrophages was detected in cytoplasmic HMGB1-positive cancers. A similar increase was also reported with Foxp3 + Treg lymphocytes. the number of positive cells was reported to tumor area (mm 2 ). (G) Representative examples of normal (HMEC and MCF10A) and malignant cells (LumA: T-47D and MCF7; basal-like: MDA-MB-468 and Hs578T) stained for HMGB1. Note the exclusive nuclear immunoreactivity displayed by normal mammary cells. Secretion/release of HMGB1 analyzed by ELISA in (H) human and (I) mouse cell culture supernatants. High concentrations were especially detected in cell cultures derived from triple negative/basal-like tumors. The means±SEM (plus each individual data point) for at least three independent experiments are represented. The scale bar represents 100 µm. Asterisks indicate statistically significant differences (*p<0.05; **p<0.01; ***p<0.001). P values were determined using one-way ANOVA followed by Bonferroni post-test (A), unpaired t-test (A), χ 2 test (C), log-rank (Mantel-Cox) test (D) and one-way ANOVA followed by Dunnett’s multiple comparison post-test (F, H, I). ANOVA, analysis of variance; HMGB1, high-mobility group box 1; METABRIC, Molecular Taxonomy of Breast Cancer International Consortium.
Index in PubMed under a CC BY license. PMID: 33712445

Click image to see more details
UA alleviates APAP-induced oxidative stress through Nrf2 signaling pathway. The mice were pretreated with AAV8-sh-Nrf2 (5 × 10 10 vg/mL) or Scramble shRNA via tail vein injection. One week after AAV infection, the mice were challenged with APAP injection with or without UA treatment (50 mg/kg). The liver tissue and serum were harvested at 12 h after APAP challenge. n = 6 mice per group. (A) Serum ALT levels from different groups. (B) Representative images of hematoxylin and eosin-stained liver sections, scale bar: 100 μm. (C) The quantification of necrosis area of the liver tissue. (D) Representative immunoblots and analysis of NQO1 expression in mice were treated with or without Nrf2 shRNA. (E) The L02 cells were transfected with the siNrf2 RNA or Scramble siRNA for 48 h and then treated with or without UA (5 μM) in the presence or absence of APAP (10 mM) for 24 h. Cell viability was determined by CCK8 assay. (F) HMGB1 immunofluorescence of L02 cells. scale bar: 50 μm. (G) Quantification of colocalization of HMGB1 and nuclei. (H) Representative immunoblots and analysis of NQO1 expression in L02 cells. (I) Representative images of DHE staining of L02 cells, scale bar, 100 μm. (J) The quantification of the DHE positive intensity. Data are expressed as mean ± SEM. The in vitro experiment was repeated at least 3 times. *** P < 0.001 vs. CTL; ## P < 0.01, ### P < 0.001 vs. APAP; & P < 0.05, &&& P < 0.001 vs. siNC-APAP + UA or sh-NC-APAP + UA.
Index in PubMed under a CC BY license. PMID: 35342347

Click image to see more details
Anti-inflammation of naringin in vitro and in vivo. A – D Effect of naringin on LPS-induced mRNA expression of COX-2, iNOS, IL-1β, and IL-6 in RAW 264.7 macrophages. The concentration of LPS is 1 μg/mL. A COX-2 mRNA relative expression level; B IL-1β mRNA relative expression level; C iNOS mRNA relative expression level; D IL-6 mRNA relative expression level. Different letters show significant differences ( p < 0.05). E – G Anti-inflammation effect of naringin on myocardial ischemia/reperfusion injury in rats. E Representative images of the Western blot results. F HMGB1 protein Expression level; G p-P38 protein expression levels. * p < 0.05 vs. the Sham group; # p < 0.05 vs. the I/R group. COX-2, cyclooxygenase-2; HMGB1, high mobility group box 1 protein; IL-1β, interleukin-1β; IL-6, interleukin 6; iNOS, inducible nitric oxide synthase; I/R, ischemia/reperfusion; LPS, lipopolysaccharide; Nar, naringin
Index in PubMed under a CC BY license. PMID: 35157175

Click image to see more details
UA Protected against Acetaminophen-induced Cytotoxicity in vitro . (A) L02 hepatocytes were subjected to UA at different concentrations with or without APAP (10 mM) for 24 h. Cell viability was determined by CCK8 assay. (B) HMGB1 (green) staining of L02 cells. Representative images with amplification indicating example cells with cytoplasmic HMGB1 staining and hollow nuclei (scale bars: 50 μm for upper and 10 μm for bottom), and quantification of colocalization of HMGB1 and nuclei by Image J software in at least 20 randomly selected individual cells. (C) Quantification of LDH released into the culture medium of L02 cells. Data were represented as the means ± SEM, the experiment was repeated at least 3 times, *** P < 0.001 vs. CTL; # P < 0.05, ### P < 0.001 vs. APAP.
Index in PubMed under a CC BY license. PMID: 35342347

Click image to see more details
A significant fraction of HMGB1 contained in tumor-extruded fluids is in its oxidized form and displays RAGE-dependent tolerogenic properties. (A, B) The ROS accumulation in both breast (4T1, 67NR, EpRas) and lung (TC-1) cancer cells used in the present study was assessed by flow cytometry. N-acetylcysteine (5 mM) and tert-butyl hydroperoxide (100 µM) were used as negative and positive controls, respectively. Results represent the means±SEM of four independent experiments (each individual data point is shown). (C) The redox state of extracellular HMGB1 contained in tumor-extruded fluids was analyzed by Western blot. All samples were directly alkylated in order to ‘freeze’ the redox state of HMGB1 molecules. Recombinant HMGB1 (0.5 µg) incubated with either H 2 O 2 or DTT (and then alkylated) were used as controls. (D) Oxidized/reduced-disulfide HMGB1 ratio (%) was calculated from the Western blot bands using ImageJ software. (E) DCs were incubated with terminally oxidized, fully reduced or disulfide HMGB1 for 24 hours before being stimulated with LPS for 24 hours. The expression of cell-surface molecules (CD80, CD83, CD86, HLA-DR, HLA-ABC and CCR7) was then measured by flow cytometry. All data were normalized to LPS-stimulated DC. Data represent the relative mean fluorescent intensity (MFI)±SEM of at least five independent experiments (each individual data point is shown). (F) DCs were incubated with terminally oxidized HMGB1 for 24 hours before being stimulated with LPS for 24 hours. When indicated, an inhibitor of RAGE (10 µM RAP) or TLR4 (2 µM LPS-RS) was added in the cell culture. The expression of DC activation markers was determined by flow cytometry. All data were normalized to LPS-stimulated DC. The relative MFI±SEM of 7 independent experiments are shown. Asterisks indicate statistically significant differences (*p<0.05, **p<0.01, ***p<0.001). P values were determined using one-way ANOVA, followed by Dunnett’s multiple comparison post-test (A, B, E, F). ANOVA, analysis of variance; DC, dendritic cell; HMGB1, high-mobility group box 1.
Index in PubMed under a CC BY license. PMID: 33712445

Click image to see more details
Systemic anti-HMGB1 mAb simultaneously alleviated pain sensitization and anxiety after p-IONX. a Schedule of experimental procedures. b Paw withdrawal thresholds to mechanical stimulation and noxious heat stimulation at the left hind paw and head withdrawal threshold to noxious heat stimulation at the left vibrissal pad before and after p-IONX. ## and ### indicate P < 0.01 and 0.001, respectively, compared with the saline-treated group at the same time points, two-way ANOVA with Bonferroni post hoc . c Anxiety-like behaviors measured by EPM, LDB and OFT on D15/16 after p-IONX. * and *** indicate P < 0.05 and 0.001, respectively, compared with the saline-treated group, ordinary one-way ANOVA with Dunnett post hoc . n = 8/group
Index in PubMed under a CC BY license. PMID: 35974316

Click image to see more details
Systemic anti-HMGB1 mAb reversed the hyperexcitability of pyramidal neurons in mPFC layer 2/3 after p-IONX. a Schedule of experimental procedures. Anti-HMGB1 mAb was administered intraperitoneally. b Example image of whole cell patch-clamp recordings on mPFC layer 2/3 pyramidal neurons. Scale bar, 150 μm. c Example traces of sEPSCs and sIPSCs in sham + saline, p-IONX + saline and p-IONX + anti-HMGB1 mAb groups. d, e Amplitude, frequency and charge transfer of sEPSCs ( d ) and sIPSCs ( e ). f Quantification of E/I ratio ( ∣ CsEPSC ∣ /CsIPSC). g, h Resting potential ( g ) and rheobase (the lowest current that evoked action potential firing, h ). i, j Representative traces of firing ( i ) and number of spikes ( j ) of action potentials evoked by injecting current at two-fold of rheobase. k Firing rate of action potentials evoked by step-current injection. l Autocorrelation and waveform (inset) of a representative glutamatergic neuron in in vivo single-unit recordings. m Mean frequency of spontaneous firing. *, ** and *** indicate P < 0.05, 0.01 and 0.001, respectively, compared with the indicated groups, unpaired t test or Mann–Whitney test. n = 9–10 neurons from 4 mice/group in ( d - k ) and n = 20 neurons from 8 mice/group in ( m )
Index in PubMed under a CC BY license. PMID: 35974316

Click image to see more details
HMGB1 in the mPFC was sufficient to induce anxiety-like behaviors and aversion but not pain sensitization in naïve mice. a Schedule of experimental procedures. b Paw withdrawal thresholds to mechanical stimulation and noxious heat stimulation at the left hind paw and head withdrawal threshold to noxious heat stimulation at the left vibrissal pad. c, d Anxiety-like behaviors measured by EPM, LDB and OFT on D8/9 ( c ) and D15/16 ( d ) after administration. e Representative heat maps in the CPP test. f Time spend by mice in the saline- and ds-HMGB1-paired boxes. *, ** and *** indicate P < 0.05, 0.01 and 0.001, respectively, compared with the saline-treated group in ( c ) and pre-conditioning in ( f ), unpaired t test. n = 8/group
Index in PubMed under a CC BY license. PMID: 35974316

Click image to see more details
Local neutralization of HMGB1 in the mPFC reduced anxiety-like behaviors and aversion but not pain sensitization after p-IONX. a Schedule of procedures of mPFC drug delivery experiments in the early phase after p-IONX. b Schematic (upper) and representative photomicrograph (lower) of the cannula implantation in bilateral mPFC for local infusion of agents. Dashed lines indicate the trace of implanted canula. Scale bar, 100 μm. c Paw withdrawal thresholds to mechanical stimulation and noxious heat stimulation at the left hind paw and head withdrawal threshold to noxious heat stimulation at the left vibrissal pad before and after p-IONX. *, ** and *** indicate P < 0.05, 0.01 and 0.001, respectively, compared with the baseline (BL), Kruskal–Wallis test with repeated measures and Dunn’s post hoc . #, ## and ### indicate P < 0.05, 0.01 and 0.001, respectively, compared with the sham + mAb group at the same time points, two-way ANOVA with Bonferroni post hoc . d, e Anxiety-like behaviors measured by EPM, LDB and OFT on D8/9 ( d ) and D15/16 ( e ) after p-IONX, respectively. * indicates P < 0.05, compared with the indicated groups, ordinary one-way ANOVA with Tukey post hoc . f Schedule (left) and schematic (right) of the experiment procedures for the CPP test. g Representative heat maps in the CPP test. h-j Time spend by the mice in the control IgG- and anti-HMGB1 mAb-paired boxes ( h ), preference ( i ) and shift preference ( j ) for the anti-HMGB1 mAb-paired box in pre- (Pre) and post-conditioning (Post) phases. *, ** and *** indicate P < 0.05, 0.01 and 0.001, respectively, compared with the indicated groups, unpaired t test. ## indicates P < 0.01, compared with the sham group in ( i ), two-way ANOVA with Bonferroni post hoc . n = 8/group
Index in PubMed under a CC BY license. PMID: 35974316

Click image to see more details
HMGB1 upregulation in the mPFC maintained comorbid anxiety in neuropathic pain. a Schedule of procedures of mPFC drug delivery experiments in the late phase after p-IONX. b , c Anxiety-like behaviors measured by EPM, LDB and OFT on D29/30 and D36/37 after p-IONX and PSL, respectively. * indicates P < 0.05, compared with the IgG-treated groups, unpaired t test. n = 8/group
Index in PubMed under a CC BY license. PMID: 35974316

Click image to see more details
Cellular and subcellular distribution of HMGB1 in the mPFC after p-IONX in MRL/MPJ mice . a-c Representative photomicrographs indicating the cellular distribution of HMGB1 in neurons (NeuN + , a ), microglia (Iba1 + , b ) and astrocytes (S100b + , c ) in the mPFC on D9 PO. DAPI was used to label nuclei. Scale bar, 50 μm. d Percentage of HMGB1-positive cells in neurons (NeuN + ), microglia (Iba1 + ) and astrocytes (S100b + ) on D9 PO in the mPFC. e Percentage of cells with HMGB1 cytoplasmic translocation in neurons (NeuN + ), astrocytes (S100b + ) and microglia (Iba1 + ) on D9 PO in the mPFC. f Quantification of Iba1 and S100b fluorescence intensity in the mPFC. g-h Representative images of western blot bands ( g ) and quantification of HMGB1 ( h ) in nuclear and cytoplasmic fractions from the mPFC on D9 PO. * and ** indicate P < 0.05 and 0.01, respectively, compared with the indicated groups, unpaired t test. n = 4/group
Index in PubMed under a CC BY license. PMID: 35974316

Click image to see more details
Extracellular HMGB1 blockade enhances anti-PD-1-induced inhibition of tumor growth in vivo. (A) PD-1 mRNA expression ( PDCD1 gene) in the four major molecular subtypes of breast cancer was determined using the METABRIC public dataset. (B) Representative example of breast cancer stained for PD-1. Positive cells were observed in the epithelial component of the tumor as well as in the stroma surrounding cancer cells. (C) PD-1 + cell infiltration within tumor microenvironment was determined by computerized counting. Each point represents the number of positive cells/mm 2 for one independent tumor specimen. (D) Mouse breast cancer cells (4T1 and 67NR) were orthotopically injected into the mammary fat pad of immunocompetent BALB/c mice. Anti-PD-1 antibody was tested alone (i.p. injection of 200 µg at days 4, 7 and 11) and in combination with HMGB1 inhibitors (RAP (10 µM/kg) and EP (1 mM/kg), treatment at 3 day intervals). In parallel, the anticancer efficacy of these combination regimens was also compared with that displayed by each individual HMGB1 inhibitor used in monotherapy. The mean tumor volumes±SEM are represented. (E) The apoptotic cancer cells (cleaved caspase 3 + ) were detected by immunohistochemistry and quantified using QuPath software. The number of positive cells was reported to tumor area (mm 2 ). (F) The total number of (CD45 + ) immune cells per milligram of tumor was determined in the different treatment groups. (G) Scatter dot plots illustrating the percentage of each individual immune cell population (DC, PDC, CD4 + and CD8 + T cells, monocytic and granulocytic MDSC, neutrophils, M1 and M2 macrophages) among CD45 + cells in both control and treated groups. Reduced densities of granulocytic MDSC as well as an increase of M1 macrophages were especially observed in case of combination therapy. The intratumoral immune cells were analyzed in five mice per condition. (H) Scatter dot plots showing the percentage of tumor-infiltrating Treg (Foxp3 + ) CD4 + and CD8 + cells among total CD4 + and CD8 + populations in the different treatment groups. the activation status of DC (I) and pDC (J) was determined by flow cytometry. the expression of several surface markers (CD80, CD86, I-A/I-E, ILT3 and ICOSL) was analyzed. Data represent the mean fluorescent intensity (MFI)±SEM of 5 independent experiments in each group (each individual data point is shown). The scale bar represents 100 µm. Asterisks indicate statistically significant differences (*p<0.05; **p<0.01; ***p<0.001; ****p<0.0001). P values were determined using one-way ANOVA followed by Bonferroni post-test (A, C, E) or Dunnett’s multiple comparison post-test (D, F, G, H, I, J). ANOVA, analysis of variance; DC, dendritic cell; HMGB1, high-mobility group box 1; METABRIC, Molecular Taxonomy of Breast Cancer International Consortium; MDSC, myeloid-derived suppressor cells; pDC, plasmacytoid DC; RAP, RAGE antagonist peptide.
Index in PubMed under a CC BY license. PMID: 33712445

Click image to see more details
Combination of anti-PD-L1 with HMGB1 inhibitors strongly inhibits tumor growth in syngeneic mouse models of basal-like breast cancer. (A) mRNA level of PD-L1 ( CD274 gene) in the four major molecular subtypes of breast cancer was determined using the METABRIC public dataset. (B) Representative example of breast cancer stained for PD-L1. Positive signals were detected on cancer cells and/or on inflammatory cells within tumor microenvironment. Semiquantitative evaluation of PD-L1 immunoreactivity (negative or >1% membrane staining) displayed by cancer cells (C) or inflammatory cells infiltrating the tumor microenvironment (D). The analyzed cancer specimens were categorized into the four molecular subtypes of breast cancer (LumA, LumB, HER2 + and basal-like). (E) The percentage of PD-L1 + cells in both epithelial/cancer (CD45 - ) and inflammatory (CD45 + ) components of untreated harvested 4T1/67NR tumors was determined by flow cytometry. Note the distinct profile displayed by these two cell lines. (F) Mouse breast cancer cells (4T1 and 67NR) were orthotopically injected into the mammary fat pad of immunocompetent BALB/c mice. Anti-PD-L1 antibody was tested alone (i.p. injection of 100 µg at days 4, 7 and 11) and in combination with HMGB1 inhibitors (RAP (10 µM/kg) and EP (1 mM/kg), treatment at 3-day intervals). The mean tumor volumes±SEM are represented. (G) The total number of (CD45 + ) immune cells per milligram of tumor was determined in the different treatment groups by flow cytometry. (H) Scatter dot plots illustrating the percentage of each individual immune cell population (DC, PDC, CD4 + and CD8 + T cells, monocytic and granulocytic MDSC, neutrophils, M1 and M2 macrophages) among CD45 + cells in both control and treated groups. The intratumoral immune cell infiltration was analyzed in five mice per condition. (I) scatter dot plots showing the percentage of tumor-infiltrating Treg (Foxp3 + ) CD4 + and CD8 + cells among total CD4 + and CD8 + populations in the different treatment groups. The activation status of DC (J) and pDC (K) was determined by flow cytometry. the expression of several surface markers (CD80, CD86, I-A/I-E, ILT3 and ICOSL) was assessed. Data represent the mean fluorescent intensity (MFI)±SEM of five independent experiments in each group (each individual data point is shown). (L) The apoptotic cancer cells (cleaved caspase 3 + ) were detected by immunohistochemistry and quantified using QuPath software. The number of positive cells was reported to tumor area (mm 2 ). The scale bar represents 100 µm. Asterisks indicate statistically significant differences (*p<0.05; **p<0.01; ***p<0.001; ****p<0.0001). P values were determined using one-way ANOVA, followed by Bonferroni post-test (A, L), Fisher’s exact test (C, D) and one-way ANOVA followed by Dunnett’s multiple comparison post-test (F, G, H, I, J, K). ANOVA, analysis of variance; DC, dendritic cell; EP, ethyl pyruvate; HMGB1, high-mobility group box 1; i.p, intraperitoneal; METABRIC, Molecular Taxonomy of Breast Cancer International Consortium; pDC, plasmacytoid DC; RAP, RAGE antagonist peptide.
Index in PubMed under a CC BY license. PMID: 33712445

Click image to see more details
UA Protected against Acetaminophen-induced liver injury in vivo . (A) Serum ALT and (B) AST activities in mice with various concentrations of Urolithin A in the presence or absence of APAP administration (500 mg/kg), n = 6. (C) The representative image of liver tissue (scale bar: 500 mm) and representative image of H&E-stained liver sections at 100 × magnification, scale bar: 200 μm. APAP-induced centrilobular necrosis was indicated by the dotted line. (D) The quantification of necrosis area of the liver tissue, n = 6. (E) HMGB1 staining of liver sections (scale bar: 50 μm). (F) Quantification of colocalization of HMGB1 and nuclei by Image J (NIH, Bethesda, MD) software, n = 6. (G) The survival rate in the APAP challenged (750 mg/kg) mice with or without UA treatment (15 mice per group). Data were represented as the means ± SEM. *** P < 0.001 vs. CTL; # P < 0.05, ### P < 0.001 vs. APAP.
Index in PubMed under a CC BY license. PMID: 35342347

Click image to see more details
Extracellular HMGB1 blockade inhibits the growth of pre-established solid tumors in immunocompetent mice through activating anticancer immune responses. (A) Mouse basal-like breast cancer cells (4T1, 67NR and EpRas) were orthotopically injected into the mammary fat pad of immunocompetent BALB/c mice. Tumor-bearing mice were then treated at 3-day intervals with PBS (control) or HMGB1 inhibitors (glycyrrhizin (1 nM/kg), RAP (10 µM/kg), a box (500 µg/kg) and EP (1 mM/kg)). The mean tumor volumes±SEM are represented. (B) HMGB1 inhibitors were tested in nude mice implanted with 67NR cells. Note the absence of beneficial effect in these latter immunocompromised mice, indicating the dependence on the adaptive immune responses. (C) At day 17, 19 or 20 (depending on the analyzed cell line), tumors were harvested, CD45 + immune cells were isolated and analyzed by flow cytometry. The proportions of each analyzed immune cell population in both control and treated groups (pooled results) are shown. Note the drastic reduction of MDSC following extracellular HMGB1 blockade. (D) Total number of (CD45 + ) immune cells per milligram of tumor in both control and treated groups. (E) Scatter dot plots showing the percentage of each individual immune cell population (DC, PDC, CD4 + and CD8 + T cells, monocytic and granulocytic MDSC, neutrophils, M1 and M2 macrophages) among CD45 + cells in the different treatment groups. an increased M1/M2 ratio of macrophages was observed in most HMGB1 inhibitor-treated tumors. The intratumoral immune cells were analyzed in five mice per condition. (F) Scatter dot plots illustrating the percentage of tumor-infiltrating Treg (Foxp3 + ) CD4 + and CD8 + cells among total CD4 + and CD8 + populations in the different treatment groups. (G) Scatter dot plots illustrating the percentage of tumor-infiltrating PD-1 + CD4 + and PD-1 + CD8 + cells among total CD4 + and CD8 + populations in the treatment groups. The activation status of both DC (H) and PDC (I) in the different treatment groups was also determined by analyzing the expression of several cell surface markers (CD80, CD86, I-A/I-E, ILT3 and ICOSL). Data represent the mean fluorescent intensity (MFI)±SEM of 5 independent experiments in each group (each individual data point is shown). The number of apoptotic cancer cells (cleaved caspase 3 + ) (J) as well as the density of blood vessels within tumor microenvironment (CD31 + ) (K) were determined by computerized counting (using QuPath software). The number of cleaved caspase 3 + cells and the percentage of CD31 + pixels were reported to tumor area. The scale bar represents 100 µm. Asterisks indicate statistically significant differences (*p<0.05; **p<0.01; ***p<0.001). P values were determined using one-way ANOVA followed by Dunnett’s multiple comparison post-test (A, B, D, E, F, G, H, I) and (Welch-corrected) unpaired t-test (J, K). ANOVA, analysis of variance; DC, dendritic cell; EP, ethyl pyruvate; HMGB1, high-mobility group box 1; i.p, intraperitoneal; MDSC, myeloid-derived suppressor cells; pDC, plasmacytoid DC; RAP, RAGE antagonist peptide.
Index in PubMed under a CC BY license. PMID: 33712445
Specific Publications For Anti-HMGB1 Antibody Picoband® (A00066-1)
Loading publications
Recommended Resources
Here are featured tools and databases that you might find useful.
- Boster's Pathways Library
- Protein Databases
- Bioscience Research Protocol Resources
- Data Processing & Analysis Software
- Photo Editing Software
- Scientific Literature Resources
- Research Paper Management Tools
- Molecular Biology Software
- Primer Design Tools
- Bioinformatics Tools
- Phylogenetic Tree Analysis
Customer Reviews
Have you used Anti-HMGB1 Antibody Picoband®?
Share your experimental results or join a short interview to earn up to $1,000 in product credits or other rewards.
1 Reviews For Anti-HMGB1 Antibody Picoband®
Accurate localization and good imaging quality
Excellent
| SKU | A00066-1 |
|---|---|
| Application | Immunofluorenscence |
| Sample | Mouse 4T1 cell climbing slides |
| Sample Processing Description | Mouse 4T1 cells fixed with 4% paraformaldehyde for 15 minutes |
| Primary Antibody | Anti-HMGB1 Antibody Picoband® |
| Primary Incubation | 1:500, overnight at 4 ℃ |
| Blocking Agent | Goat serum |
| Secondary Antibody | DyLight 550-conjugated goat anti-rabbit antibody. |
| Secondary Incubation | Incubate at room temperature for 1 hour |
| Detection | Laser confocal microscopy |
| Results Summary | The ordering and delivery cycle of the antibodies is very short — I was able to receive the products within a week, which saved a lot of time. The pre-sales and after-sales services are convenient and efficient. Since my background is in chemistry, I consulted Boster’s technical team about many details of biological experiments. The technical specialists were patient and thorough in their analysis and explanations, which helped me avoid many detours during the actual experimental procedures. Most importantly, these antibodies offer a high cost-performance ratio, with good binding performance, excellent imaging quality, and a high experimental success rate, providing a solid foundation for conducting related experiments. |
Yanhua Li,Shandong Normal University
Verified customer
Submitted 2025-10-17
Customer Q&As
Have a question?
Find answers in Q&As, reviews.
Can't find your answer?
Submit your question
17 Customer Q&As for Anti-HMGB1 Antibody Picoband®
Question
What tissue is recommend as a positive control for A00066-1?
Verified customer
Asked: 2021-01-13
Answer
For the Anti-HMGB1 Antibody Picoband™ (A00066-1), the following tissue can be used as positive controls in IHC; mouse intestine mouse liver rat intestine rat liver human mammary cancer human placenta Our lab tested these tissue samples and observed positive signal. https://www.bosterbio.com/anti-hmgb1-picoband-trade-antibody-a00066-1-boster.html#product-image-1
Boster Scientific Support
Answered: 2021-01-14
Question
I see that the anti-HMGB1 antibody A00066-1 works with WB, what is the protocol used to produce the result images on the product page?
J. Dhar
Verified customer
Asked: 2020-03-19
Answer
You can find protocols for WB on the "support/technical resources" section of our navigation menu. If you have any further questions, please send an email to support@bosterbio.com
Boster Scientific Support
Answered: 2020-03-19
Question
Do you have a BSA free version of anti-HMGB1 antibody A00066-1 available?
Verified Customer
Verified customer
Asked: 2019-12-10
Answer
Thank you for your recent telephone inquiry. I can confirm that some lots of this anti-HMGB1 antibody A00066-1 are BSA free. For now, these lots are available and we can make a BSA free formula for you free of charge. It will take 3 extra days to prepare. If you require this antibody BSA free again in future, please do not hesitate to contact me and I will be pleased to check which lots we have in stock that are BSA free.
Boster Scientific Support
Answered: 2019-12-10
Question
We are currently using anti-HMGB1 antibody A00066-1 for human tissue, and we are well pleased with the IHC results. The species of reactivity given in the datasheet says human, mouse, rat. Is it true that the antibody can work on monkey tissues as well?
Verified Customer
Verified customer
Asked: 2019-11-28
Answer
The anti-HMGB1 antibody (A00066-1) has not been tested for cross reactivity specifically with monkey tissues, but there is a good chance of cross reactivity. We have an innovator award program that if you test this antibody and show it works in monkey you can get your next antibody for free. Please contact me if I can help you with anything.
Boster Scientific Support
Answered: 2019-11-28
Question
Our lab were content with the WB result of your anti-HMGB1 antibody. However we have been able to see positive staining in liver nucleus using this antibody. Is that expected? Could you tell me where is HMGB1 supposed to be expressed?
Verified Customer
Verified customer
Asked: 2019-07-03
Answer
According to literature, liver does express HMGB1. Generally HMGB1 expresses in nucleus. Regarding which tissues have HMGB1 expression, here are a few articles citing expression in various tissues:
Brain, Cervix, and Testis, Pubmed ID: 15489334
Cerebellum, Pubmed ID: 14702039
Cervix carcinoma, Pubmed ID: 18669648, 20068231
Cervix carcinoma, and Erythroleukemia, Pubmed ID: 23186163
Liver, Pubmed ID: 24275569
Mammary carcinoma, Pubmed ID: 9150946
Small intestine, Pubmed ID: 17974005
Boster Scientific Support
Answered: 2019-07-03
Question
I am interested in to test anti-HMGB1 antibody A00066-1 on mouse small intestine for research purposes, then I may be interested in using anti-HMGB1 antibody A00066-1 for diagnostic purposes as well. Is the antibody suitable for diagnostic purposes?
D. Walker
Verified customer
Asked: 2019-05-03
Answer
The products we sell, including anti-HMGB1 antibody A00066-1, are only intended for research use. They would not be suitable for use in diagnostic work. If you have the means to develop a product into diagnostic use, and are interested in collaborating with us and develop our product into an IVD product, please contact us for more discussions.
Boster Scientific Support
Answered: 2019-05-03
Question
Is a blocking peptide available for product anti-HMGB1 antibody (A00066-1)?
V. Parker
Verified customer
Asked: 2019-04-22
Answer
We do provide the blocking peptide for product anti-HMGB1 antibody (A00066-1). If you would like to place an order for it please contact support@bosterbio.com and make a special request.
Boster Scientific Support
Answered: 2019-04-22
Question
Would A00066-1 anti-HMGB1 antibody work on parafin embedded sections? If so, which fixation method do you recommend we use (PFA, paraformaldehyde, other)?
Verified Customer
Verified customer
Asked: 2018-12-18
Answer
You can see on the product datasheet, A00066-1 anti-HMGB1 antibody as been validated on WB. It is best to use PFA for fixation because it has better tissue penetration ability. PFA needs to be prepared fresh before use. Long term stored PFA turns into formalin, as the PFA molecules congregate and become formalin.
Boster Scientific Support
Answered: 2018-12-18
Question
We have been able to see staining in mouse small intestine. Any tips? Is anti-HMGB1 antibody supposed to stain small intestine positively?
Verified Customer
Verified customer
Asked: 2018-09-24
Answer
According to literature small intestine does express HMGB1. According to Uniprot.org, HMGB1 is expressed in kidney, cerebellum, small intestine, brain, cervix testis, mammary carcinoma, cervix carcinoma, cervix carcinoma erythroleukemia, liver, among other tissues. Regarding which tissues have HMGB1 expression, here are a few articles citing expression in various tissues:
Brain, Cervix, and Testis, Pubmed ID: 15489334
Cerebellum, Pubmed ID: 14702039
Cervix carcinoma, Pubmed ID: 18669648, 20068231
Cervix carcinoma, and Erythroleukemia, Pubmed ID: 23186163
Liver, Pubmed ID: 24275569
Mammary carcinoma, Pubmed ID: 9150946
Small intestine, Pubmed ID: 17974005
Boster Scientific Support
Answered: 2018-09-24
Question
Would anti-HMGB1 antibody A00066-1 work for WB with small intestine?
Verified Customer
Verified customer
Asked: 2017-10-30
Answer
According to the expression profile of small intestine, HMGB1 is highly expressed in small intestine. So, it is likely that anti-HMGB1 antibody A00066-1 will work for WB with small intestine.
Boster Scientific Support
Answered: 2017-10-30
Question
We appreciate helping with my inquiry over the phone. Here are the WB image, lot number and protocol we used for small intestine using anti-HMGB1 antibody A00066-1. Let me know if you need anything else.
Verified Customer
Verified customer
Asked: 2017-09-26
Answer
Thank you for the data. You have provided everything we needed. Our lab team are working to resolve your inquiry as quickly as possible, and we appreciate your patience and understanding! Please let me know if there is anything you need in the meantime.
Boster Scientific Support
Answered: 2017-09-26
Question
We are interested in using your anti-HMGB1 antibody for negative regulation of rna polymerase ii transcriptional preinitiation complex assembly studies. Has this antibody been tested with western blotting on mouse liver? We would like to see some validation images before ordering.
V. Anderson
Verified customer
Asked: 2017-09-18
Answer
Thank you for your inquiry. This A00066-1 anti-HMGB1 antibody is validated on mouse liver, 22rv1 whole cell lysates, hela whole cell lysates. It is guaranteed to work for IHC, WB in human, mouse, rat. Our Boster guarantee will cover your intended experiment even if the sample type has not been be directly tested.
Boster Scientific Support
Answered: 2017-09-18
Question
Here is the WB image, lot number and protocol we used for small intestine using anti-HMGB1 antibody A00066-1. Please let me know if you require anything else.
K. Singh
Verified customer
Asked: 2016-12-28
Answer
Thank you very much for the data. Our lab team are working to resolve this as quickly as possible, and we appreciate your patience and understanding! You have provided everything we needed. Please let me know if there is anything you need in the meantime.
Boster Scientific Support
Answered: 2016-12-28
Question
Is this A00066-1 anti-HMGB1 antibody reactive to the isotypes of HMGB1?
K. Moore
Verified customer
Asked: 2016-07-04
Answer
The immunogen of A00066-1 anti-HMGB1 antibody is A synthetic peptide corresponding to a sequence at the C-terminus of human HMGB1 (124-154aa DVAKKLGEMWNNTAADDKQPYEKKAAKLKEK), identical to the related mouse and rat sequences. Could you tell me which isotype you are interested in so I can help see if the immunogen is part of this isotype?
Boster Scientific Support
Answered: 2016-07-04
Question
I was wanting to use your anti-HMGB1 antibody for WB for mouse small intestine on frozen tissues, but I want to know if it has been tested for this particular application. Has this antibody been tested and is this antibody a good choice for mouse small intestine identification?
E. Krishna
Verified customer
Asked: 2015-10-27
Answer
It shows on the product datasheet, A00066-1 anti-HMGB1 antibody has been tested for IHC, WB on human, mouse, rat tissues. We have an innovator award program that if you test this antibody and show it works in mouse small intestine in IHC-frozen, you can get your next antibody for free.
Boster Scientific Support
Answered: 2015-10-27
Question
We have tried in the past anti-HMGB1 antibody for IHC on liver in a previous project. I am using rat, and We want to use the antibody for WB next. We need examining liver as well as cervix testis in our next experiment. Do you have any suggestion on which antibody would work the best for WB?
V. Carter
Verified customer
Asked: 2015-08-28
Answer
I looked at the website and datasheets of our anti-HMGB1 antibody and I see that A00066-1 has been tested on rat in both IHC and WB. Thus A00066-1 should work for your application. Our Boster satisfaction guarantee will cover this product for WB in rat even if the specific tissue type has not been validated. We do have a comprehensive range of products for WB detection and you can check out our website bosterbio.com to find out more information about them.
Boster Scientific Support
Answered: 2015-08-28
Question
I have a question about product A00066-1, anti-HMGB1 antibody. I was wondering if it would be possible to conjugate this antibody with biotin. I would need it to be without BSA or sodium azide. I am planning on using a buffer exchange of sodium azide with PBS only. Would there be problems for me to conjugate the antibody and store it in -20 degrees in small aliquots?
L. Edwards
Verified customer
Asked: 2014-05-29
Answer
We do not advise storing this antibody with PBS buffer only in -20 degrees. If you want to store it in -20 degrees it is best to add some cryoprotectant like glycerol. If you want carrier free A00066-1 anti-HMGB1 antibody, we can provide it to you in a special formula with trehalose and/or glycerol. These molecules will not interfere with conjugation chemistry and provide a good level of protection for the antibody from degradation. Please be sure to specify this in your purchase order.
Boster Scientific Support
Answered: 2014-05-29
