Click image to see more details
-

-
-
-
-
+8
Product Info Summary
| SKU: | A00228-1 |
|---|---|
| Size: | 100 μg/vial |
| Reactive Species: | Human, Monkey, Mouse, Rat |
| Host: | Rabbit |
| Application: | ELISA, Flow Cytometry, IF, IHC, ICC, WB |
Customers Who Bought This Also Bought

Product info
Product Name
Anti-Nucleolin/NCL Antibody Picoband®
SKU/Catalog Number
A00228-1
Size
100 μg/vial
Form
Lyophilized
Description
Boster Bio Anti-Nucleolin/NCL Antibody Picoband® catalog # A00228-1. Tested in ELISA, Flow Cytometry, IF, IHC, ICC, WB applications. This antibody reacts with Human, Monkey, Mouse, Rat. The brand Picoband indicates this is a premium antibody that guarantees superior quality, high affinity, and strong signals with minimal background in Western blot applications. Only our best-performing antibodies are designated as Picoband, ensuring unmatched performance.
Storage & Handling
Store at -20˚C for one year from date of receipt. After reconstitution, at 4˚C for one month. It can also be aliquotted and stored frozen at -20˚C for six months. Avoid repeated freeze-thaw cycles.
Cite This Product
Anti-Nucleolin/NCL Antibody Picoband® (Boster Biological Technology, Pleasanton CA, USA, Catalog # A00228-1)
Host
Rabbit
Contents
Each vial contains 4mg Trehalose, 0.9mg NaCl and 0.2mg Na2HPO4.
Clonality
Polyclonal
Isotype
Rabbit IgG
Immunogen
E.coli-derived human Nucleolin/NCL recombinant protein (Position: K219-A629).
Cross-reactivity
No cross-reactivity with other proteins.
Reactive Species
A00228-1 is reactive to NCL in Human, Monkey, Mouse, Rat
Observed Molecular Weight
100-110 kDa
Calculated molecular weight
76.6 kDa
Background of NCL
Nucleolin is a protein that in humans is encoded by the NCL gene. It is mapped to 2q37.1. Nucleolin (NCL), a eukaryotic nucleolar phosphoprotein, is involved in the synthesis and maturation of ribosomes. It is located mainly in dense fibrillar regions of the nucleolus. Human NCL gene consists of 14 exons with 13 introns and spans approximately 11kb. The intron 11 of the NCL gene encodes a small nucleolar RNA, termed U20.
Antibody Validation
Boster validates all antibodies on WB, IHC, ICC, Immunofluorescence, and ELISA with known positive control and negative samples to ensure specificity and high affinity, including thorough antibody incubations.
Application & Images
Applications
A00228-1 is guaranteed for ELISA, Flow Cytometry, IF, IHC, ICC, WB Boster Guarantee
Recommend Dilution
| Application | Dilution | Species |
|---|---|---|
| Western blot | 0.25-0.5μg/ml | |
| Immunohistochemistry (Paraffin-embedded Section) | 1-2μg/ml | |
| Immunocytochemistry/Immunofluorescence | 2μg/ml | Human |
| Flow Cytometry (Fixed) | 1-3μg/1x106 cells | |
| ELISA | 0.1-0.5μg/ml |
Tested application
Suggested blocking solution with 5% non-fat milk or BSA; (*)Recommended protein loading: 20-40 µg per lane
Use TE buffer pH 9.0 for antigen retrieval; (*) citrate buffer pH 6.0 is an alternative.
Validation Images & Assay Conditions
Click image to see more details
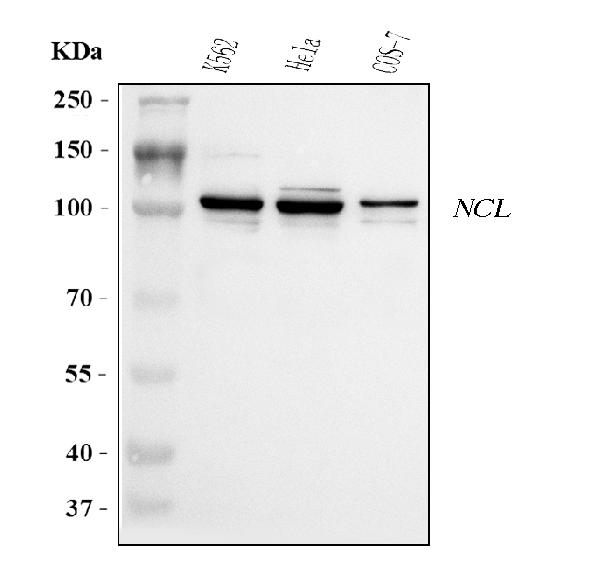
Western blot analysis of NCL using anti-NCL antibody (A00228-1).
Electrophoresis was performed on a 5-20% SDS-PAGE gel at 70V (Stacking gel) / 90V (Resolving gel) for 2-3 hours. The sample well of each lane was loaded with 30 ug of sample under reducing conditions.
Lane 1: human K562 whole cell lysates,
Lane 2: human Hela whole cell lysates,
Lane 3: monkey COS-7 whole cell lysates.
After electrophoresis, proteins were transferred to a nitrocellulose membrane at 150 mA for 50-90 minutes. Blocked the membrane with 5% non-fat milk/TBS for 1.5 hour at RT. The membrane was incubated with rabbit anti-NCL antigen affinity purified polyclonal antibody (Catalog # A00228-1) at 0.5 μg/mL overnight at 4°C, then washed with TBS-0.1%Tween 3 times with 5 minutes each and probed with a goat anti-rabbit IgG-HRP secondary antibody at a dilution of 1:5000 for 1.5 hour at RT. The signal is developed using an Enhanced Chemiluminescent detection (ECL) kit (Catalog # EK1002) with Tanon 5200 system. A specific band was detected for NCL at approximately 100-110 kDa. The expected band size for NCL is at 63 kDa.

Click image to see more details
IHC analysis of NCL using anti-NCL antibody (A00228-1).
NCL was detected in a paraffin-embedded section of human metaplasia of squamous cells of the renal pelvis tissue. Heat mediated antigen retrieval was performed in EDTA buffer (pH 8.0, epitope retrieval solution). The tissue section was blocked with 10% goat serum. The tissue section was then incubated with 2 μg/ml rabbit anti-NCL Antibody (A00228-1) overnight at 4°C. Biotinylated goat anti-rabbit IgG was used as secondary antibody and incubated for 30 minutes at 37°C. The tissue section was developed using Strepavidin-Biotin-Complex (SABC) (Catalog # SA1022) with DAB as the chromogen.

Click image to see more details
Annotation Results of scRNA-seq for LUAD. (A) Sample origin of the single-cell data, 12 samples were identified without batch effect. (B) Transcript counts in the single-cell dataset. (C) Clustering results of the single-cell data, totally 21 clusters were presented. (D) Cell type annotation based on marker gene expression, including T cells, monocyte-macrophages, NK cells, epithelial cells, B cells, fibroblasts, mast cells, endothelial cells, conventional dendritic cells (cDCs) and plasmacytoid dendritic cells (pDCs). (E) Expression profiles of representative markers for ten distinct cell types. (F) Proportion of each cell type across samples. (G) Total number of cells for each identified cell type. (H) Transcript counts per cell type, reflecting transcriptional activity at the single-cell level.
Index in PubMed under a CC BY license. PMID: 40396179

Click image to see more details
Single-cell communication networks. (A) Incoming communication patterns of target cells, showing pathways to which each cell type responds. (B) Outgoing communication patterns of secreting cells, illustrating the pathways through which cells send signals, MIF, MK and CXCL pathway exhibit high activity. (C) Network diagram showing the strength of intercellular communication, with connections between various cell types. (D) Scatter plot comparing outgoing and incoming communication strengths across cell populations, with bubble size indicating the number of interactions, malignant cells have higher strength of intercellular communication. (E) Chord diagram depicting communication via the MK pathway between different cell types. (F) Ligand-receptor interaction probabilities within the MK pathway between malignant and other cell types. Dot size represents significance (P-value), and color represents communication probability highlighting the MDK-NCL signaling pathway. (G) Violin plots of MK pathway gene expression levels across cell types, showing gene activity variations, MDK has advancer expression level in malignant cells.
Index in PubMed under a CC BY license. PMID: 40396179

Click image to see more details
Spatial transcriptomics and MDK-NCL signal communication. (A) Niche clustering in spatial transcriptomics samples, identifying distinct ecological zones. (B) Spatial expression of representative markers in key regions: MUC1 (tumor region), LYZ (immune region), COL14A1 (stromal region), and SFTPC (normal region). (C) Violin plots displaying the expression of MUC1, LYZ, COL14A1, and SFTPC across different niches. (D) MCPcounter analysis showing the infiltration of six cell types (e.g., endothelial cells, fibroblasts, immune lineages) across spatial regions. (E) Spatial niche classification, distinguishing tumor, immune-stromal, and normal regions. (F) MDK-NCL ligand-receptor interaction analysis, spatially mapping MDK ligands, NCL receptors, and their binding regions.
Index in PubMed under a CC BY license. PMID: 40396179

Click image to see more details
Single-cell pseudotime analysis. (A) Pseudotime trajectory analysis showing the 6 differentiation states of cells. (B) Subtype classification of malignant cells along the pseudotime trajectory. (C) Pseudotime scores mapped along the differentiation trajectory. (D) UMAP plot visualizing pseudotime scores across individual cells. (E) Box plots comparing pseudotime scores across different malignant cell clusters, cluster 0, 1, and 5 had higher pseudotime scores. (F) UMAP plot of differentiation states, with colors representing distinct states. (G) Stacked bar plots showing the proportion of differentiation states within each malignant cell cluster, cluster 0, 1, and 5 have larger proportion of state 6. (H) Expression dynamics of MK pathway genes (e.g., MDK, NCL, ITG genes) along the pseudotime trajectory, highlighting gene expression changes during differentiation, MDK and NCL express more in the later time.
Index in PubMed under a CC BY license. PMID: 40396179

Click image to see more details
Association of MDK-NCL with the immune microenvironment. (A) Boxplot shows the expression levels of MDK and NCL genes in tumor and control groups, it exhibit higher activity in tumor group. (B) MDK-NCL enrichment scores in tumor and control groups. (C) Relative mRNA expression levels of MDK and NCL in tumor and control groups from in-house data. (D) Relative protein expression levels of MDK and NCL in tumor and control groups from in-house data. (E) Comparison of MDK protein expression levels between tumor and control groups. (F) Comparison of NCL protein expression levels between tumor and control groups. (G) Correlation of MDK and NCL expression with ImmuneScore, StromalScore, ESTIMATEScore, and TumorPurity. (H) Scatter plots depicting the relationship between MDK and NCL expression and immune-related scores (ImmuneScore, StromalScore, ESTIMATEScore) as well as TumorPurity. (I) Comparison of immune cell infiltration scores across high and low MDK-NCL expression groups for 28 immune cell types. *P < 0.05, **P < 0.01, ***P < 0.001.
Index in PubMed under a CC BY license. PMID: 40396179

Click image to see more details
Association of MDK-NCL with immunotherapy response. (A) Comparison of tumor mutation burden (TMB) between high and low MDK-NCL expression groups. (B) Comparison of microsatellite instability (MSI) between high and low MDK-NCL groups. (C) Comparison of dysfunction scores between high and low MDK-NCL groups. (D) Comparison of exclusion scores between high and low MDK-NCL groups. (E) Expression of immunogenic cell death (ICD)-related genes in high and low MDK-NCL groups. (F) Expression levels of CTLA4 and PD1 in high and low MDK-NCL groups. (G) Comparison of immune checkpoint gene expression between high and low MDK-NCL expression groups. *P < 0.05, **P < 0.01, ***P < 0.001.
Index in PubMed under a CC BY license. PMID: 40396179

Click image to see more details
IHC analysis of NCL using anti-NCL antibody (A00228-1).
NCL was detected in a paraffin-embedded section of mouse pancreas tissue. Heat mediated antigen retrieval was performed in EDTA buffer (pH 8.0, epitope retrieval solution). The tissue section was blocked with 10% goat serum. The tissue section was then incubated with 2 μg/ml rabbit anti-NCL Antibody (A00228-1) overnight at 4°C. Biotinylated goat anti-rabbit IgG was used as secondary antibody and incubated for 30 minutes at 37°C. The tissue section was developed using Strepavidin-Biotin-Complex (SABC) (Catalog # SA1022) with DAB as the chromogen.

Click image to see more details
IHC analysis of NCL using anti-NCL antibody (A00228-1).
NCL was detected in a paraffin-embedded section of rat pancreas tissue. Heat mediated antigen retrieval was performed in EDTA buffer (pH 8.0, epitope retrieval solution). The tissue section was blocked with 10% goat serum. The tissue section was then incubated with 2 μg/ml rabbit anti-NCL Antibody (A00228-1) overnight at 4°C. Biotinylated goat anti-rabbit IgG was used as secondary antibody and incubated for 30 minutes at 37°C. The tissue section was developed using Strepavidin-Biotin-Complex (SABC) (Catalog # SA1022) with DAB as the chromogen.

Click image to see more details
IF analysis of NCL using anti-NCL antibody (A00228-1) and anti-Tubulin beta antibody (M05613-4).
NCL was detected in immunocytochemical section of A431 cells. Enzyme antigen retrieval was performed using IHC enzyme antigen retrieval reagent (AR0022) for 15 mins. The cells were blocked with 10% goat serum. And then incubated with 2μg/mL rabbit anti-NCL Antibody (A00228-1) and mouse anti-Tubulin beta Antibody (M05613-4) overnight at 4°C. DyLight®488 Conjugated Goat Anti-Rabbit IgG (BA1127) and DyLight®594 Conjugated Goat Anti-Mouse IgG (BA1141) were used as secondary antibody at 1:100 dilution and incubated for 30 minutes at 37°C. Visualize using a fluorescence microscope and filter sets appropriate for the label used.

Click image to see more details
Flow Cytometry analysis of HL-60 cells using anti-NCL antibody (A00228-1).
Overlay histogram showing HL-60 cells stained with A00228-1 (Blue line). To facilitate intracellular staining, cells were fixed with 4% paraformaldehyde and permeabilized with permeabilization buffer. The cells were blocked with 10% normal goat serum. And then incubated with rabbit anti-NCL Antibody (A00228-1, 1 μg/1x106 cells) for 30 min at 20°C. DyLight®488 conjugated goat anti-rabbit IgG (BA1127, 5-10 μg/1x106 cells) was used as secondary antibody for 30 minutes at 20°C. Isotype control antibody (Green line) was rabbit IgG (1 μg/1x106) used under the same conditions. Unlabelled sample without incubation with primary antibody and secondary antibody (Red line) was used as a blank control.
Specific Publications For Anti-Nucleolin/NCL Antibody Picoband® (A00228-1)
Loading publications
Recommended Resources
Here are featured tools and databases that you might find useful.
- Boster's Pathways Library
- Protein Databases
- Bioscience Research Protocol Resources
- Data Processing & Analysis Software
- Photo Editing Software
- Scientific Literature Resources
- Research Paper Management Tools
- Molecular Biology Software
- Primer Design Tools
- Bioinformatics Tools
- Phylogenetic Tree Analysis
Customer Reviews
Have you used Anti-Nucleolin/NCL Antibody Picoband®?
Share your experimental results or join a short interview to earn up to $1,000 in product credits or other rewards.
0 Reviews For Anti-Nucleolin/NCL Antibody Picoband®
Customer Q&As
Have a question?
Find answers in Q&As, reviews.
Can't find your answer?
Submit your question
4 Customer Q&As for Anti-Nucleolin/NCL Antibody Picoband®
Question
We purchased anti-Nucleolin/NCL antibody for WB on prostate cancer last year. I am using rat, and We are going to use the antibody for IHC-F next. I am looking for examining prostate cancer as well as liver in our next experiment. Could you please give me some suggestion on which antibody would work the best for IHC-F?
Verified Customer
Verified customer
Asked: 2020-04-09
Answer
I viewed the website and datasheets of our anti-Nucleolin/NCL antibody and it seems that A00228-1 has been validated on rat in both WB and IHC-F. Thus A00228-1 should work for your application. Our Boster satisfaction guarantee will cover this product for IHC-F in rat even if the specific tissue type has not been validated. We do have a comprehensive range of products for IHC-F detection and you can check out our website bosterbio.com to find out more information about them.
Boster Scientific Support
Answered: 2020-04-09
Question
We are currently using anti-Nucleolin/NCL antibody A00228-1 for rat tissue, and we are satisfied with the ELISA results. The species of reactivity given in the datasheet says human, rat. Is it likely that the antibody can work on zebrafish tissues as well?
Verified Customer
Verified customer
Asked: 2019-09-16
Answer
The anti-Nucleolin/NCL antibody (A00228-1) has not been validated for cross reactivity specifically with zebrafish tissues, though there is a good chance of cross reactivity. We have an innovator award program that if you test this antibody and show it works in zebrafish you can get your next antibody for free. Please contact me if I can help you with anything.
Boster Scientific Support
Answered: 2019-09-16
Question
We have seen staining in rat liver. Any tips? Is anti-Nucleolin/NCL antibody supposed to stain liver positively?
R. Wu
Verified customer
Asked: 2018-06-07
Answer
Based on literature liver does express NCL. Based on Uniprot.org, NCL is expressed in testis, retina, hair follicle dermal papilla, lymphoma, cervix carcinoma, lymphoblast, prostate cancer, leukemic t-cell, cervix carcinoma erythroleukemia, liver, colon carcinoma, among other tissues. Regarding which tissues have NCL expression, here are a few articles citing expression in various tissues:
Cervix carcinoma, Pubmed ID: 8321232, 12429849, 16964243, 17081983, 17924679, 18669648, 20068231
Cervix carcinoma, and Erythroleukemia, Pubmed ID: 23186163
Colon carcinoma, Pubmed ID: 24129315
Hair follicle dermal papilla, Pubmed ID: 14702039
Leukemic T-cell, Pubmed ID: 19690332
Liver, Pubmed ID: 24275569
Lymphoblast, Pubmed ID: 14654843
Lymphoma, Pubmed ID: 7718615
Prostate cancer, Pubmed ID: 17487921
Retina, Pubmed ID: 2737305
Boster Scientific Support
Answered: 2018-06-07
Question
Our team were happy with the WB result of your anti-Nucleolin/NCL antibody. However we have seen positive staining in lymphoblast nucleus using this antibody. Is that expected? Could you tell me where is NCL supposed to be expressed?
Verified Customer
Verified customer
Asked: 2017-08-04
Answer
Based on literature, lymphoblast does express NCL. Generally NCL expresses in nucleus, nucleolus. cytoplasm. Regarding which tissues have NCL expression, here are a few articles citing expression in various tissues:
Cervix carcinoma, Pubmed ID: 8321232, 12429849, 16964243, 17081983, 17924679, 18669648, 20068231
Cervix carcinoma, and Erythroleukemia, Pubmed ID: 23186163
Colon carcinoma, Pubmed ID: 24129315
Hair follicle dermal papilla, Pubmed ID: 14702039
Leukemic T-cell, Pubmed ID: 19690332
Liver, Pubmed ID: 24275569
Lymphoblast, Pubmed ID: 14654843
Lymphoma, Pubmed ID: 7718615
Prostate cancer, Pubmed ID: 17487921
Retina, Pubmed ID: 2737305
Boster Scientific Support
Answered: 2017-08-04
