Click image to see more details
-

-
-
-
-
+4
Product Info Summary
| SKU: | M01970 |
|---|---|
| Size: | 100 μl |
| Reactive Species: | Human, Mouse |
| Host: | Rabbit |
| Application: | IF, IHC, ICC, WB |
Customers Who Bought This Also Bought

Product info
Product Name
Anti-Ubiquitin D UBD Rabbit Monoclonal Antibody
SKU/Catalog Number
M01970
BM4765 is an alternative SKU for this antibody, used in previous lots.
Size
100 μl
Form
Liquid
Description
Boster Bio Anti-Ubiquitin D UBD Rabbit Monoclonal Antibody catalog # M01970. Tested in WB, IHC, ICC/IF applications. This antibody reacts with Human, Mouse.
Storage & Handling
Store at -20°C for one year. For short term storage and frequent use, store at 4°C for up to one month. Avoid repeated freeze-thaw cycles.
Cite This Product
Anti-Ubiquitin D UBD Rabbit Monoclonal Antibody (Boster Biological Technology, Pleasanton CA, USA, Catalog # M01970)
Host
Rabbit
Contents
Rabbit IgG in stabilizing components, phosphate buffered saline, pH 7.4, 150mM NaCl, 0.02% sodium azide and 50% glycerol.
*This antibody is supplied in a stabilized formulation.
Compatibility with conjugation reactions depends on the chemistry of the conjugation method used.
For conjugation methods that are not compatible with the stabilizing components present in this formulation, a carrier-free antibody format is required.
Clonality
Monoclonal
Clone Number
HID-21
Isotype
Rabbit IgG
Immunogen
A synthesized peptide derived from human Ubiquitin D
Reactive Species
M01970 is reactive to UBD in Human, Mouse
Observed Molecular Weight
23 kDa
Calculated molecular weight
18.5 kDa
Antibody Validation
Boster validates all antibodies on WB, IHC, ICC, Immunofluorescence, and ELISA with known positive control and negative samples to ensure specificity and high affinity, including thorough antibody incubations.
Application & Images
Applications
M01970 is guaranteed for IF, IHC, ICC, WB Boster Guarantee
Recommend Dilution
WB 1:500-2000
IHC 1:50-200
ICC/IF 1:50-200
Tested application
Suggested blocking solution with 5% non-fat milk or BSA; (*)Recommended protein loading: 20-40 µg per lane
Validation Images & Assay Conditions
Click image to see more details
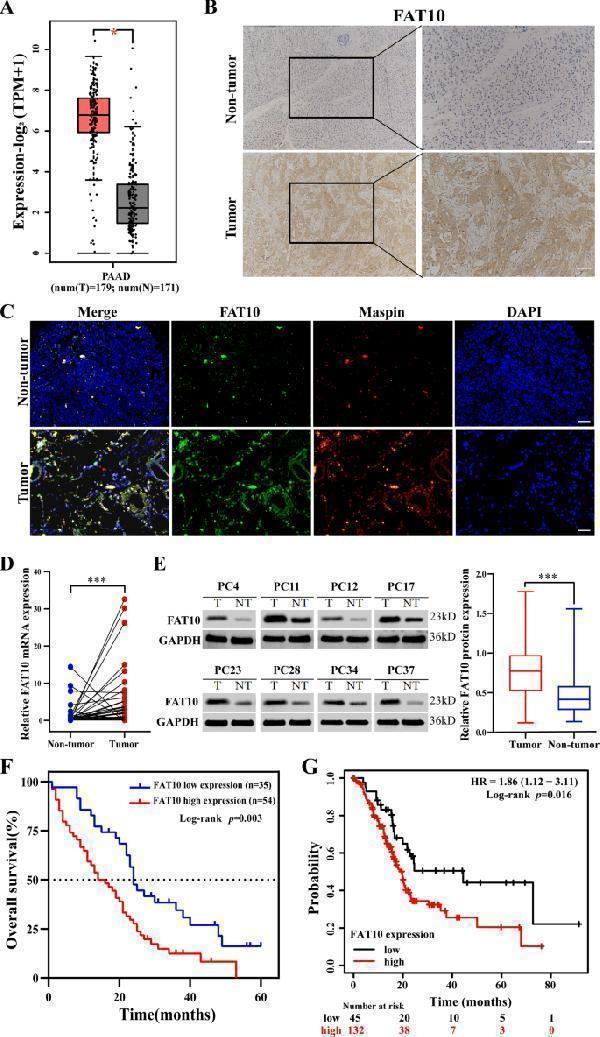
High FAT10 expression is associated with poor prognosis in patients with PC. A The GEPIA2 server was used to analyze the expression of FAT10 in PAAD (T, tumor; N, nontumorous tissues; * p < 0.05). B Representative IHC image showing the increase in FAT10 protein levels in PC tissue (magnification: 100×, inset magnification: 200×). Scale bar, 200 μm. C Immunofluorescence localization of FAT10 protein expression in PC and paracancerous tissues using the anti-FAT10 antibody (1:100, green) and anti-Maspin antibody (1:100, red), followed by DAPI nuclear counterstaining (blue). Merged images of FAT10 (green) and Maspin (red) with DAPI (blue) are also shown. Scale bar, 100 μm. D qRT–PCR analysis of FAT10 mRNA levels in PC tissues and corresponding adjacent tissues ( n = 40, p = 0.001; Wilcoxon signed-rank test). GAPDH was used as a loading control. E Western blot analysis of FAT10 protein expression in PC tissues and corresponding adjacent noncancerous tissues ( n = 40; Student’s t-test). GAPDH was used as a loading control. F Kaplan–Meier survival curve of the relationship between FAT10 high and low expression groups and the prognosis of PC patients ( n = 89, p = 0.003; Log-rank test). G Kaplan–Meier survival curves of prognosis-related FAT10 expression in the Kaplan–Meier plotter cohort ( n = 177, p = 0.016; Log-rank test).
Index in PubMed under a CC BY license. PMID: 35614040

Click image to see more details
FAT10 expression is correlated with chemoresistance of PC cells to GEM. A Protein expression of FAT10 in noncancerous pancreatic ductal epithelial cells and PC cell lines was analyzed by western blotting. B The mRNA expression of FAT10 in normal pancreatic ductal epithelial cells and PC cell lines was analyzed by qRT–PCR. C Viabilities of PC cells were determined in response to different concentrations of GEM. Inhibition curves were fitted by nonlinear regression, and GEM IC50s were calculated using GraphPad Prism 8 software. D Western blotting was used to analyze expression levels of FAT10 in GEM-resistant (GR) PC cells. Data represent the mean ± SD of triplicate experiments and were statistically analyzed with Student’s t-test, * p < 0.05, ** p < 0.01.
Index in PubMed under a CC BY license. PMID: 35614040

Click image to see more details
Inhibition of FAT10 increases the chemotherapeutic sensitivity of PC to GEM. A – C The IC50 of PC cells (FAT10 knockdown or overexpression) exposed to different concentrations of GEM was determined by cell viability experiments. D – F The effect of knocking down FAT10 on the proliferation rate of PC cells treated with GEM was detected by EdU staining. G – I The apoptosis rate of PC cells with FAT10 knockdown was detected by AO/EB staining after GEM treatment. Data represent the mean ± SD of triplicate experiments and were statistically analyzed by one-way ANOVA. J Representative images of different groups of tumors removed from mice are shown. K Growth curve showing changes in tumor volume in mice from different groups. Growth was assessed every 5 days beginning from the day of injection and during GEM treatment. At the end of the experiment, the tumor was dissected and photographed, and the tumor volume (V) was calculated as follows: V = 0.52 × length × width 2 and analyzed by one-way ANOVA. * p < 0.05, ** p < 0.01, *** p < 0.001.
Index in PubMed under a CC BY license. PMID: 35614040

Click image to see more details
FAT10 regulates EMT to promote chemotherapeutic resistance in PC cells. A Spearman correlation analysis of the correlation between FAT10 ( UBD ) and EMT pathway score. FAT10 expression is represented by the abscissa, and the EMT pathway score is represented by the ordinate. A density curve to the right represents the trend in the distribution of pathway scores, a density curve to the upper part represents the trend in the distribution of gene expression. The top part shows the p -value, correlation coefficient, and correlation calculation method. B Immunofluorescence analysis of the effect of inhibiting FAT10 on the expression of EMT-related proteins (E-cadherin and Vimentin) in PC cells. Scale bar, 50 μm. C – F GEM-resistant PC cell lines (PANC-1/GR and BxPC-3/GR) were transfected with interfering plasmid sh-FAT10#2 and or EMT activator (TGF-β, 10 ng/mL) for 48 h. C , E Western blot analysis was used to observe the expression of EMT-related proteins in each treatment group. D , F Cell viability experiments were used to calculate the half-inhibitory concentration (IC50) of GEM-treated PC-resistant cells in each treatment group. Data represent the mean ± SD of triplicate experiments and were statistically analyzed by one-way ANOVA. * p < 0.05, ** p < 0.01, *** p < 0.001.
Index in PubMed under a CC BY license. PMID: 35614040

Click image to see more details
FAT10 regulates EMT through FOXM1. A Top 10 proteins co-precipitated with FAT10 analyzed by LC-MS/MS. #PSMs, peptide spectrum matches. B Mass spectrum showing unique peptides of FOXM1 identified by 2D-LC-MS/MS from the protein lysates prepared from PANC-1 cells following immunoprecipitation with anti-FAT10. C Representative western blot analysis of FAT10 and FOXM1 protein expression in PC and paired paracancerous tissues (T, tumor; NT, non-tumor tissue). D Scatter plots showing a positive correlation between FAT10 and FOXM1 protein expression levels in 40 PC samples ( n = 40, r = 0.4642, p = 0.0025, Pearson test). E , F Western blot analyses were used to detect FAT10 and FOXM1 protein expression in cells stably transfected with the shFAT10 or HA-FAT10 plasmid. G Western blot analysis confirming FAT10 silencing and FOXM1 restoration and their effects on EMT-related proteins. H Western blot analysis showing the levels of FAT10 overexpression and FOXM1 inhibition and their effects on EMT-related proteins.
Index in PubMed under a CC BY license. PMID: 35614040

Click image to see more details
FAT10 increases FOXM1 protein levels by inhibiting the ubiquitination and degradation of FOXM1 in PC cells. A Co-IP was used to detect the interaction between FOXM1 and ubiquitin in PANC-1 and BxPC-3 cells. HC, heavy chain. B With MG132 (10 μM) added to PANC-1 and BxPC-3 cells, western blotting was used to detect protein levels of FOXM1 at different times. C MG132 (10 μM) was added to PANC-1 and BxPC-3 cells while the expression of FAT10 was altered. Western blotting was used to detect protein expression levels of FOXM1. D PANC-1 and BxPC-3 cells were treated with CHX (20 μM) for a specified time with or without the addition of the FAT10 overexpression plasmid, and FOXM1 protein levels were detected by western blotting. Data represent the mean ± SD of triplicate experiments and were statistically analyzed with Student’s t-test, * p < 0.05, ** p < 0.01.
Index in PubMed under a CC BY license. PMID: 35614040

Click image to see more details
FAT10 competes with ubiquitin to bind and stabilize FOXM1. A Co-IP was used to detect the interaction between FOXM1 and FAT10 in PANC-1 and BxPC-3 cells. HC, heavy chain. B MG132 (10 μM) was added to PANC-1 and BxPC-3 cells, shFAT10 or HA-FAT10 plasmid was transfected at the same time, and then co-IP was used to detect the levels of ubiquitin bound to FOXM1 protein. C PANC-1 and BxPC-3 cells were transfected with different amounts of HA-FAT10 plasmid, and the level of FAT10 binding to FOXM1 protein was detected by co-IP. D PANC-1 and BxPC-3 cells were transfected with different amounts of HA-FAT10 plasmid, and the level of Ub binding to FOXM1 protein was detected by co-IP. E Docking conformation of the first ranking score. Three-dimensional structure of FAT10 and FOXM1. FAT10 is shown in green. FOXM1 is shown in cyan. F The Flag-FOXM1 plasmid was transfected into PANC-1 and BxPC-3 cells, the HA-FAT10 or HA-FAT10ΔGG plasmid was transfected at the same time, and then the protein level of Flag-FOXM1 bound to the HA-tagged protein was detected by co-IP. HC, heavy chain.
Index in PubMed under a CC BY license. PMID: 35614040

Click image to see more details
Western blot analysis of Ubiquitin D using anti-Ubiquitin D antibody (M04905-1).
Electrophoresis was performed on a 12% SDS-PAGE gel at 80V (Stacking gel) / 120V (Resolving gel) for 2 hours. The sample well of each lane was loaded with 30 ug of sample under reducing conditions.
Lane 1: human Hela whole cell lysates,
Lane 2: human HepG2 whole cell lysates,
Lane 3: human Jurkat whole cell lysates,
Lane 4: human MCF-7 whole cell lysates,
Lane 5: human SH-SY5Y whole cell lysates,
Lane 6: human K562 whole cell lysates,
Lane 7: mouse liver tissue lysates,
Lane 8: mouse HEPA1/6 whole cell lysates.
After electrophoresis, proteins were transferred to a nitrocellulose membrane at 150 mA for 50-90 minutes. Blocked the membrane with 5% non-fat milk/TBS for 1.5 hour at RT. The membrane was incubated with rabbit anti-Ubiquitin D antigen affinity purified monoclonal antibody (M04905-1) at 1:500 overnight at 4°C, then washed with TBS-0.1%Tween 3 times with 5 minutes each and probed with a goat anti-rabbit IgG-HRP secondary antibody at a dilution of 1:500 for 1.5 hour at RT. The signal is developed using an ECL Plus Western Blotting Substrate (Catalog # AR1196-200) with Tanon 5200 system. A specific band was detected for Ubiquitin D at approximately 23 kDa. The expected band size for Ubiquitin D is at 18 kDa.
Specific Publications For Anti-Ubiquitin D UBD Rabbit Monoclonal Antibody (M01970)
Loading publications
Recommended Resources
Here are featured tools and databases that you might find useful.
- Boster's Pathways Library
- Protein Databases
- Bioscience Research Protocol Resources
- Data Processing & Analysis Software
- Photo Editing Software
- Scientific Literature Resources
- Research Paper Management Tools
- Molecular Biology Software
- Primer Design Tools
- Bioinformatics Tools
- Phylogenetic Tree Analysis
Customer Reviews
Have you used Anti-Ubiquitin D UBD Rabbit Monoclonal Antibody?
Share your experimental results or join a short interview to earn up to $1,000 in product credits or other rewards.
0 Reviews For Anti-Ubiquitin D UBD Rabbit Monoclonal Antibody
Customer Q&As
Have a question?
Find answers in Q&As, reviews.
Can't find your answer?
Submit your question
5 Customer Q&As for Anti-Ubiquitin D UBD Rabbit Monoclonal Antibody
Question
Does anti-Ubiquitin D Rabbit Monoclonal antibody M01970 work for WB with urinary bladder?
Verified Customer
Verified customer
Asked: 2020-01-15
Answer
According to the expression profile of urinary bladder, UBD is highly expressed in urinary bladder. So, it is likely that anti-Ubiquitin D Rabbit Monoclonal antibody M01970 will work for WB with urinary bladder.
Boster Scientific Support
Answered: 2020-01-15
Question
I see that the anti-Ubiquitin D Rabbit Monoclonal antibody M01970 works with WB, what is the protocol used to produce the result images on the product page?
C. Jackson
Verified customer
Asked: 2019-07-29
Answer
You can find protocols for WB on the "support/technical resources" section of our navigation menu. If you have any further questions, please send an email to support@bosterbio.com
Boster Scientific Support
Answered: 2019-07-29
Question
Would M01970 anti-Ubiquitin D Rabbit Monoclonal antibody work on parafin embedded sections? If so, which fixation method do you recommend we use (PFA, paraformaldehyde, other)?
Verified Customer
Verified customer
Asked: 2019-05-27
Answer
It shows on the product datasheet, M01970 anti-Ubiquitin D Rabbit Monoclonal antibody as been tested on WB. It is best to use PFA for fixation because it has better tissue penetration ability. PFA needs to be prepared fresh before use. Long term stored PFA turns into formalin, as the PFA molecules congregate and become formalin.
Boster Scientific Support
Answered: 2019-05-27
Question
Would anti-Ubiquitin D Rabbit Monoclonal antibody M01970 work on zebrafish IF with urinary bladder?
Verified Customer
Verified customer
Asked: 2019-03-29
Answer
Our lab technicians have not validated anti-Ubiquitin D Rabbit Monoclonal antibody M01970 on zebrafish. You can run a BLAST between zebrafish and the immunogen sequence of anti-Ubiquitin D Rabbit Monoclonal antibody M01970 to see if they may cross-react. If the sequence homology is close, then you can perform a pilot test. Keep in mind that since we have not validated zebrafish samples, this use of the antibody is not covered by our guarantee. However we have an innovator award program that if you test this antibody and show it works in zebrafish urinary bladder in IF, you can get your next antibody for free.
Boster Scientific Support
Answered: 2019-03-29
Question
I was wanting to use your anti-Ubiquitin D Rabbit Monoclonal antibody for WB for mouse urinary bladder on frozen tissues, but I want to know if it has been validated for this particular application. Has this antibody been validated and is this antibody a good choice for mouse urinary bladder identification?
Verified Customer
Verified customer
Asked: 2018-08-20
Answer
You can see on the product datasheet, M01970 anti-Ubiquitin D Rabbit Monoclonal antibody has been tested for IF, WB on human, mouse tissues. We have an innovator award program that if you test this antibody and show it works in mouse urinary bladder in IHC-frozen, you can get your next antibody for free.
Boster Scientific Support
Answered: 2018-08-20
