Click image to see more details
-

-
-
-
-
+8
Product Info Summary
| SKU: | M01263-4 |
|---|---|
| Size: | 100 μl/vial |
| Reactive Species: | Chicken, Human, Mouse, Pig, Rabbit, Rat |
| Host: | Mouse |
| Application: | IF, IHC, ICC, WB |
Customers Who Bought This Also Bought

Product info
Product Name
Anti-beta Actin Mouse Monoclonal Antibody
SKU/Catalog Number
M01263-4
Size
100 μl/vial
Form
Liquid
Description
Boster Bio Anti-beta Actin Mouse Monoclonal Antibody catalog # M01263-4. Tested in WB, IHC, ICC/IF applications. This antibody reacts with Human, Mouse, Rat, Chicken, Rabbit.
Storage & Handling
Store at -20°C for one year. For short term storage and frequent use, store at 4°C for up to one month. Avoid repeated freeze-thaw cycles.
Cite This Product
Anti-beta Actin Mouse Monoclonal Antibody (Boster Biological Technology, Pleasanton CA, USA, Catalog # M01263-4)
Host
Mouse
Contents
Mouse IgG in stabilizing components, phosphate buffered saline, pH 7.4, 150mM NaCl, 0.02% sodium azide and 50% glycerol.
*This antibody is supplied in a stabilized formulation.
Compatibility with conjugation reactions depends on the chemistry of the conjugation method used.
For conjugation methods that are not compatible with the stabilizing components present in this formulation, a carrier-free antibody format is required.
Clonality
Monoclonal
Clone Number
17A10
Isotype
IgG1
Immunogen
A synthesized peptide derived from human beta Actin
Reactive Species
M01263-4 is reactive to ACTB in Chicken, Human, Mouse, Pig, Rabbit, Rat
Observed Molecular Weight
42 kDa
Calculated molecular weight
41.7 kDa
Antibody Validation
Boster validates all antibodies on WB, IHC, ICC, Immunofluorescence, and ELISA with known positive control and negative samples to ensure specificity and high affinity, including thorough antibody incubations.
Application & Images
Applications
M01263-4 is guaranteed for IF, IHC, ICC, WB Boster Guarantee
Recommend Dilution
WB 1:3000-10000
IHC 1:100-1:200
ICC/IF 1:100-200
Tested application
Suggested blocking solution with 5% non-fat milk or BSA; (*)Recommended protein loading: 20-40 µg per lane
Use TE buffer pH 9.0 for antigen retrieval; (*) citrate buffer pH 6.0 is an alternative.
Validation Images & Assay Conditions
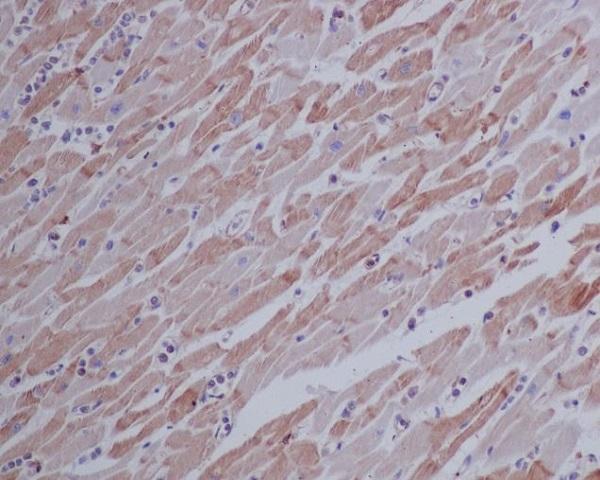
Click image to see more details
Immunohistochemical analysis of paraffin-embedded human heart, using beta Actin Mouse Monoclonal Antibody.

Click image to see more details
Immunofluorescent analysis of HepG2 cells, using beta Actin mAb.

Click image to see more details
Effects of overexpressing SLIT2 on the expression of the ROBO1, ROBO2 , ROBO3 and ROBO4 genes. The granulosa cells were transfected with a reconstructed pYr-adshuttle-4-SLIT2 vector, a pYr-adshuttle-4 empty vector (negative control) or no plasmid (blank control). ( A ) The expression of the SLIT2 gene before and after the GCs were transfected with the pYr-adshuttle-4-SLIT2 expression vector for 24 h was examined by qRT-PCR. The mRNA expression was normalized to that of the 18S rRNA gene; the values on the bar graphs represent the mean ± SEM of 10 hens (n = 10) from a representative experiment. ( B ) The expression levels of the SLIT2 protein in the GCs before and after the transfection with the pYr-adshuttle-4-SLIT2 vector were detected by western blotting. β-actin was used as a loading control. The blots were cropped, and the gels were run under the same experimental conditions. ( C ) The influence of the SLIT2 overexpression on the ROBO1 , ROBO2, ROBO3 and ROBO4 mRNA abundance in the granulosa cells from the prehierarchical follicles (6 to 8 mm in diameter) was examined. ( D ) The effects of the SLIT2 overexpression on the protein levels of ROBO1 and ROBO2. For each group, the superscript symbol above the bar indicates that the difference was significant compared to the control group **P < 0.01, *P < 0.05.
Index in PubMed under a CC BY license. PMID: 29907785

Click image to see more details
Effects of the SLIT2 knockdown on the expression of the ROBO1 and ROBO2 genes. The granulosa cells were transfected with the SLIT2 -specific siRNA, scrambled siRNA (negative control) or no siRNA (blank control). ( A ) The expression of the SLIT2 gene in the GCs with or without the interference of the specific siRNA was determined by qRT-PCR. The mRNA expression was normalized to that of the 18S rRNA gene; the values of the bar graphs represent the mean ± SEM of 10 hens (n = 10) from a representative experiment. ( B ) The expression levels of the SLIT2 protein in the GCs with or without the siRNA interference were detected by western blotting. β-actin was used as a loading control. ( C ) The influence of the SLIT2 knockdown on the ROBO1 and ROBO2 mRNA abundance in the granulosa cells. ( D ) The effects of the SLIT2 knockdown on the protein levels of ROBO1 and ROBO2. All blots were cropped, and the gels were run under the same experimental conditions. For each group, the superscript symbol above the bar indicates that the difference was significant compared to the control group **P < 0.01, *P < 0.05.
Index in PubMed under a CC BY license. PMID: 29907785

Click image to see more details
Effects of the overexpressed SLIT2 on SRGAP1 expression and GTPase activity of CDC42 and RAC1 in GCs. The granulosa cells were transfected with the reconstructed pYr-adshuttle-4-SLIT2 plasmids, a pYr-adshuttle-4 empty vector (negative control) or no plasmid (blank control). ( A ) The expression of the SRGAP1 gene before and after the GCs were transfected with the pYr-adshuttle-4-SLIT2 expression vector for 24 h was examined by qRT-PCR. The mRNA expression was normalized to that of the 18S rRNA gene; the values on the bar graphs represent the mean ± SEM of 10 hens (n = 10) from a representative experiment. ( B ) The expression levels of the SRGAP1 protein in the GCs before and after the transfection with the pYr-adshuttle-4-SLIT2 vector was detected by western blotting. β-actin was used as a loading control. ( C ) The coimmunoprecipitation of CDC42 and RAC1 with the recombinant GST-PBD in vitro . The stimulation by the SLIT2 overexpression of GTP-bound CDC42 and RAC1 in the granulosa cells from the prehierarchical follicles (6 to 8 mm in diameter) was examined by western blotting after performing a GST pull-down assay in which cell lysates were incubated with glutathione S-transferase (GST) and the recombinant GST-PBD. The immunoprecipitation (IP) with the PBD antibody was revealed by immunoblotting (IB) using monoclonal anti-CDC42 or anti-RAC1 antibodies (in the right-hand column). −, negative control; +, SLIT2 overexpressed group. All blots were cropped, and the gels were run under the same experimental conditions. ( D ) The effects of the SLIT2 overexpression on the expression levels of GTP-bound CDC42 and RAC1 were detected by western blotting. β-actin was used as a loading control. For each group, the different superscript above the bar indicates that the difference was significant (P < 0.01).
Index in PubMed under a CC BY license. PMID: 29907785

Click image to see more details
Effects of silencing SLIT2 on SRGAP1 expression and the GTPase activity of CDC42 and RAC1 in GCs. The granulosa cells were transfected with specific siRNAs targeting the SLIT2 gene, scrambled siRNA (negative control) or no siRNA (blank control). ( A ) The expression of the SRGAP1 gene before and after the GCs were transfected with the specific siRNA for 48 h was examined by qRT-PCR. The mRNA expression was normalized to that of the 18S rRNA gene; the values on the bar graphs represent the mean ± SEM of 10 hens (n = 10) from a representative experiment. ( B ) The expression levels of the SRGAP1 protein in the GCs with and without specific siRNA interference (RNAi) was detected by western blotting. β-actin was used as a loading control. ( C ) The immunoprecipitation (IP) with the PBD antibody was revealed by immunoblotting (IB) using monoclonal anti-CDC42 or anti-RAC1 antibodies (in the right-hand column). −, negative control; +, SLIT2 silencing group. All blots were cropped, and the gels were run under the same experimental conditions. ( D ) The expression levels of GTP-bound CDC42 and RAC1 under SLIT2 silencing were determined by western blotting. β-actin was used as a loading control. For each group, the different superscript above the bar indicates that the difference was significant (P < 0.01).
Index in PubMed under a CC BY license. PMID: 29907785

Click image to see more details
SLIT2 overexpression-induced reduction in the phosphorylation levels of PAKs, RAFs and ERK1/2. The granulosa cells were transfected with the reconstructed pYr-adshuttle-4-SLIT2 plasmids, a pYr-adshuttle-4 empty vector (negative control) or no plasmid (blank control). ( A ) The immunoprecipitants were analyzed by western blotting for an in vitro phosphorylation assay. β-actin was used as a loading control. The blots were cropped, and the gels were run under the same experimental conditions. ( B , C ) The blotting signal intensity was quantified densitometrically after phosphorimaging (shown in A ) and normalized for loading by comparison to the signal of β-actin. The signal intensity of the targeted proteins or phosphorylated proteins was expressed as a ratio to the β-actin signal in arbitrary units (n = 5 per mean ± SEM). Five independent experiments were carried out in triplicate. The results are representative of at least three independent experiments. significance is marked with different superscript symbols **P < 0.01, *P < 0.05.
Index in PubMed under a CC BY license. PMID: 29907785

Click image to see more details
Knockdown of SLIT2 enhances the phosphorylation levels of PAKs, RAFs and ERK1/2. The granulosa cells were transfected with the SLIT2-specific siRNA, scrambled siRNA (negative control) or no siRNA (blank control). ( A ) An in vitro phosphorylation assay was performed by western blotting. β-actin was used as a loading control. The blots were cropped, and the gels were run under the same experimental conditions. ( B , C ) The blotting signal intensity was quantified densitometrically after phosphorimaging (shown in A ) and normalized for loading by comparison to the signal of β-actin. The signal intensity of the targeted proteins or phosphorylated proteins was expressed as a ratio to the β-actin signal in arbitrary units (n = 5 per mean ± SEM). Five independent experiments were carried out in triplicate. The results are representative of at least three independent experiments. The statistical significance is marked with different superscript symbols **P < 0.01, *P < 0.05.
Index in PubMed under a CC BY license. PMID: 29907785

Click image to see more details
Effect of RAF RNAi on the SLIT2 overexpression-induced inhibition of the phosphorylation levels of MEK1/2 and ERK1/2. The granulosa cells were transfected with B-RAF and/or RAF1 specific siRNA, scrambled siRNA (negative control) or no siRNA (blank control). ( A ) The expression of the B-RAF and RAF1 genes before and after the GCs were transfected with specific siRNA for 48 h was examined by qRT-PCR. The mRNA expression was normalized to that of the 18S rRNA gene; the values on the bar graphs represent the mean ± SEM of 10 hens (n = 10). ( B ) The immunoprecipitants were analyzed by western blotting. β-actin was used as a loading control. The blots were cropped, and the gels were run under the same experimental conditions. ( C ) The protein expression levels of B-RAF and RAF1 in the GCs with and without specific siRNA interference were detected by western blotting and normalized for loading by comparison to the signal of β-actin. ( D ) The granulosa cells were transfected with the reconstructed pYr-adshuttle-4-SLIT2 plasmids and co-infected with or without B-RAF and RAF1 specific siRNA. The negative controls refer to the phosphorylation levels of MEK1/2 and ERK1/2 shown in Fig. . −, neither SLIT2 overexpression nor knockdown of RAFs ; +, SLIT2 overexpression or knockdown of RAFs . The signal intensity of the phosphorylated proteins was expressed as a ratio to the β-actin signal in arbitrary units (n = 5 per mean ± SEM). The statistical significance is indicated with different superscript characters (P < 0.005).
Index in PubMed under a CC BY license. PMID: 29907785

Click image to see more details
Figure 11 Regulation of the phosphorylation of B-RAF, RAF1, ERK1/2 and GC proliferation through the kinase PAKs. The granulosa cells were transfected with the reconstructed pYr-adshuttle-4-SLIT2 plasmids and co-infected with or without PAK1 , PAK2 and PAK3 specific siRNA. ( A ) The phosphorylation levels of B-RAF and RAF1 proteins in the GCs with or without the specific siRNA interference were detected by western blotting and normalized for loading by comparison to the signal of β-actin. ( B ) The phosphorylation levels of the ERK1/2 proteins in the GCs with and without the specific siRNA interference were detected by western blotting and normalized for loading by comparison to the signal of β-actin. The signal intensity of the phosphorylated proteins was expressed as a ratio to the β-actin signal in arbitrary units (n = 10 per mean ± SEM). ( C ) Proliferation levels of the GCs with and without the specific siRNA interference were examined using an EdU Cell Proliferation Assay Kit. The statistical significance is indicated with different superscript characters (P < 0.01).
Index in PubMed under a CC BY license. PMID: 29907785

Click image to see more details
Western blot analysis of β-Actin using anti-β-Actin antibody (M01263-4).
Electrophoresis was performed on a 10% SDS-PAGE gel at 80V (Stacking gel) / 120V (Resolving gel) for 2 hours. The sample well of each lane was loaded with 30 ug of sample under reducing conditions.
Lane 1: human Hela whole cell lysates,
Lane 2: human K562 whole cell lysates,
Lane 3: pig brain tissue lysates.
After electrophoresis, proteins were transferred to a nitrocellulose membrane at 150 mA for 50-90 minutes. Blocked the membrane with 5% non-fat milk/TBS for 1.5 hour at RT. The membrane was incubated with mouse anti-beta-Actin antigen affinity purified monoclonal antibody (M01263-4) at 1:5000 overnight at 4°C, then washed with TBS-0.1%Tween 3 times with 5 minutes each and probed with a goat anti-mouse IgG-HRP secondary antibody at a dilution of 1:5000 for 1.5 hour at RT. The signal is developed using an ECL Plus Western Blotting Substrate (Catalog # AR1196-200) with Tanon 5200 system. A specific band was detected for beta-Actin at approximately 42 kDa. The expected band size for beta-Actin is at 42 kDa.

Click image to see more details
Western blot analysis of β-Actin using anti-β-Actin antibody (M01263-4).
Electrophoresis was performed on a 10% SDS-PAGE gel at 80V (Stacking gel) / 120V (Resolving gel) for 2 hours. The sample well of each lane was loaded with 30 ug of sample under reducing conditions.
Lane 1: human Hela whole cell lysates,
Lane 2: human K562 whole cell lysates,
Lane 3: pig brain tissue lysates.
After electrophoresis, proteins were transferred to a nitrocellulose membrane at 150 mA for 50-90 minutes. Blocked the membrane with 5% non-fat milk/TBS for 1.5 hour at RT. The membrane was incubated with mouse anti-β-Actin antigen affinity purified monoclonal antibody (M01263-4) at 1:5000 overnight at 4°C, then washed with TBS-0.1%Tween 3 times with 5 minutes each and probed with a goat anti-mouse IgG-HRP secondary antibody at a dilution of 1:5000 for 1.5 hour at RT. The signal is developed using an ECL Plus Western Blotting Substrate (Catalog # AR1196-200) with Tanon 5200 system. A specific band was detected for beta-Actin at approximately 42 kDa. The expected band size for β-Actin is at 42 kDa.
Specific Publications For Anti-beta Actin Mouse Monoclonal Antibody (M01263-4)
Loading publications
Recommended Resources
Here are featured tools and databases that you might find useful.
- Boster's Pathways Library
- Protein Databases
- Bioscience Research Protocol Resources
- Data Processing & Analysis Software
- Photo Editing Software
- Scientific Literature Resources
- Research Paper Management Tools
- Molecular Biology Software
- Primer Design Tools
- Bioinformatics Tools
- Phylogenetic Tree Analysis
Customer Reviews
Have you used Anti-beta Actin Mouse Monoclonal Antibody?
Share your experimental results or join a short interview to earn up to $1,000 in product credits or other rewards.
0 Reviews For Anti-beta Actin Mouse Monoclonal Antibody
Customer Q&As
Have a question?
Find answers in Q&As, reviews.
Can't find your answer?
Submit your question
