Click image to see more details
-

-
-
-
-
+8
Product Info Summary
| SKU: | A01469 |
|---|---|
| Size: | 100 μg/vial |
| Reactive Species: | Human, Mouse, Rat |
| Host: | Rabbit |
| Application: | WB |
Customers Who Bought This Also Bought

Product info
Product Name
Anti-BNIP3 Antibody Picoband®
SKU/Catalog Number
A01469
Size
100 μg/vial
Form
Lyophilized
Description
Boster Bio Anti-BNIP3 Antibody Picoband® catalog # A01469. Tested in WB applications. This antibody reacts with Human, Mouse, Rat. The brand Picoband indicates this is a premium antibody that guarantees superior quality, high affinity, and strong signals with minimal background in Western blot applications. Only our best-performing antibodies are designated as Picoband, ensuring unmatched performance.
Storage & Handling
Store at -20˚C for one year from date of receipt. After reconstitution, at 4˚C for one month. It can also be aliquotted and stored frozen at -20˚C for six months. Avoid repeated freeze-thaw cycles.
Cite This Product
Anti-BNIP3 Antibody Picoband® (Boster Biological Technology, Pleasanton CA, USA, Catalog # A01469)
Host
Rabbit
Contents
Each vial contains 4mg Trehalose, 0.9mg NaCl, 0.2mg Na2HPO4, 0.05mg NaN3.
Clonality
Polyclonal
Isotype
Rabbit IgG
Immunogen
A synthetic peptide corresponding to a sequence at the C-terminus of human BNIP3, identical to the related mouse and rat sequences.
Cross-reactivity
No cross-reactivity with other proteins.
Reactive Species
A01469 is reactive to BNIP3 in Human, Mouse, Rat
Observed Molecular Weight
21 kDa
Calculated molecular weight
27.8 kDa
Background of BNIP3
The Bcl-2 nineteen kilodalton interacting protein 3 (BNIP3 or NIP3), is a hypoxia-inducible proapoptotic member of the Bcl-2 family that induces cell death by associating with the mitochondria. BNIP3, expressed in skeletal muscle and in the brain at low levels, is primarily localized to the nucleus of glial cells of the normal human brain, as well as in the malignant glioma cell line U251. BNIP3 expression in the cytoplasm increases and localizes with the mitochondria, contributing to induction of cell death. Cellular protein BNIP3 interacts with E1B-19K, BCL-2, BCL-xL, and EBV-BHRF1. BNIP3 contains Bcl-2 homology 3 (BH3) domain and COOH-terminal transmembrane (TM) domain. The BH3 domain of BNIP3 mediates Bcl-2/Bcl-X (L) heterodimerization and confers pro-apoptotic activity; whereas the TM domain is critical for homodimerization, pro-apoptotic function, and mitochondrial targeting.
Antibody Validation
Boster validates all antibodies on WB, IHC, ICC, Immunofluorescence, and ELISA with known positive control and negative samples to ensure specificity and high affinity, including thorough antibody incubations.
Application & Images
Applications
A01469 is guaranteed for WB Boster Guarantee
Recommend Dilution
| Application | Dilution | Species |
|---|---|---|
| Western blot | 0.1-0.5μg/ml |
Tested application
Suggested blocking solution with 5% non-fat milk or BSA; (*)Recommended protein loading: 20-40 µg per lane
Validation Images & Assay Conditions
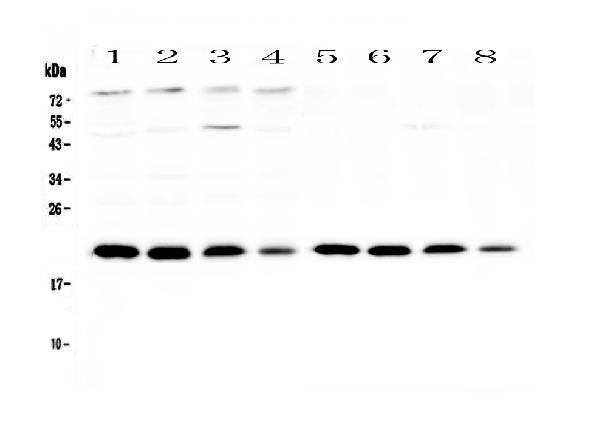
Click image to see more details
Western blot analysis of BNIP3 using anti-BNIP3 antibody (A01469).
Electrophoresis was performed on a 5-20% SDS-PAGE gel at 70V (Stacking gel) / 90V (Resolving gel) for 2-3 hours. The sample well of each lane was loaded with 50ug of sample under reducing conditions.
Lane 1: rat brain tissue lysates,
Lane 2: rat kidney tissue lysates,
Lane 3: rat heart tissue lysates,
Lane 4: rat testis tissue lysates,
Lane 5: mouse brain tissue lysates,
Lane 6: mouse kidney tissue lysates,
Lane 7: mouse heart tissue lysates,
Lane 8: mouse testis tissue lysates.
After Electrophoresis, proteins were transferred to a Nitrocellulose membrane at 150mA for 50-90 minutes. Blocked the membrane with 5% Non-fat Milk/ TBS for 1.5 hour at RT. The membrane was incubated with rabbit anti-BNIP3 antigen affinity purified polyclonal antibody (Catalog # A01469) at 0.5 μg/mL overnight at 4°C, then washed with TBS-0.1%Tween 3 times with 5 minutes each and probed with a goat anti-rabbit IgG-HRP secondary antibody at a dilution of 1:10000 for 1.5 hour at RT. The signal is developed using an Enhanced Chemiluminescent detection (ECL) kit (Catalog # EK1002) with Tanon 5200 system. A specific band was detected for BNIP3 at approximately 21KD. The expected band size for BNIP3 is at 21KD.

Click image to see more details
Knockdown of BNIP3 induces glioma cells apoptosis. (A) Western blot was performed to detect the expression levels of Bax, Bcl-2 and Active Caspase-3.
Index in PubMed under a CC BY license. PMID: 28977881

Click image to see more details
Down-regulation of miR-145 and up-regulation of BNIP3 expression in gliomas. (A) Quantitative real-time PCR of miR-145 expression in glioma samples (n = 19) compared with normal samples (n = 10). (B) quantitative real-time PCR of miR-145 expression in rat glioma tissues (n = 6) and U87, U251 glioma cells compared to normal tissues (n = 6). (C) Quantitative real-time PCR of BNIP3 mRNA expression in glioma samples (n = 19) compared with normal samples (n = 10). (D) quantitative real-time PCR of BNIP3 mRNA expression in rat glioma tissues and U87, U251 glioma cells compared to normal tissues. (E) Pathology observation of mice brain tissues sections stained with IHC (×100, ×200, ×400). (F) Immunofluorescence with BNIP3 (green) in rat normal tissues and glioma tissues (×200).*p < 0.05, **p < 0.01 versus control group.
Index in PubMed under a CC BY license. PMID: 28977881

Click image to see more details
Down-regulation of miR-145 and up-regulation of BNIP3 expression in gliomas. (A) Western analysis of BNIP3 and control β-actin in glioma samples compared with normal samples. (B) Western analysis of BNIP3 and control β-actin in rat glioma tissues compared to normal tissues. *p < 0.05, **p < 0.01 versus control group.
Index in PubMed under a CC BY license. PMID: 28977881

Click image to see more details
miR-145 inhibits mRNA and protein expression of BNIP3. (A) Bioinformatics analysis shows the seed sequence of miR-145 binding to the 3′-UTR of BNIP3 mRNA. (B) , (C) Quantitative real-time PCR analysis of mRNA expression of BNIP3 in U87 cells treated with miR-145 mimics and inhibitor for 48 h. (D) Western analysis of protein expression of BNIP3 in U87 and U251 cells treated with miR-145 mimics and inhibitor for 48 h. (E) Immunofluorescence with BNIP3 (green) in U87 and U251 cells after miR-145 mimics or mimics NC treatment.*p < 0.05, **p < 0.01 versus control group.
Index in PubMed under a CC BY license. PMID: 28977881

Click image to see more details
miR-145 inhibits mRNA and protein expression of BNIP3. (A) Western analysis of BNIP3, which is localized in the nucleus or the cytoplasm in U87 and U251 cells treated with miR-145 mimics and inhibitor for 48 h. (B) Wild-type 3′-UTR of BNIP3 gene was cloned into the firefly and Renilla reporter plasmid. The BNIP3-3′UTR constructs or blank plasmid were transfected into U87 and U251 cells with control or miR-145 mimics, followed by dual luciferase assays. *p < 0.05, **p < 0.01 versus control group.
Index in PubMed under a CC BY license. PMID: 28977881

Click image to see more details
Knockdown of BNIP3 induces glioma cells apoptosis. (A, B) Transfection effect of BNIP3-siRNA or BNIP3-vector was confirmed by quantitative real-time PCR. (C) U87 cells and U251 cells were stained with Hoechst 33342 dye after BNIP3-siRNA or control treatment. (D) U87 and U251 cells were stained with Tunel after BNIP3-siRNA or control treatment. (E) U87 cell apoptosis after BNIP3-siRNA or control treatment was determined by FACS. *p < 0.05, **p < 0.01 versus control group.
Index in PubMed under a CC BY license. PMID: 28977881

Click image to see more details
miR-145 regulates Notch signaling by targeting BNIP3. (A, B) Protein expression of Notch1, p21 and Hes1 was determined by western blot analysis in U87 and U251 cells transfected with miR-145 mimics and mimics-NC, or miR-145 inhibitor and inhibitor-NC. (C, D) Western analysis of Notch1-related proteins in U87 and U251 cells transfected with Bnip3 siRNA and siRNA control, or BNIP3 expression vector and blank vector. *p < 0.05, **p < 0.01 versus control group.
Index in PubMed under a CC BY license. PMID: 28977881

Click image to see more details
miR-145 can regulate Notch signaling pathway by targeting BNIP3. (A) Protein expression of Notch1, p21, Hes1 was determined by western blot analysis in U87 and U251 cells co-transfected with miR-145 inhibitor and BNIP3-siRNA, or with miR-145 inhibitor. *p < 0.05, **p < 0.01 versus control group.
Index in PubMed under a CC BY license. PMID: 28977881

Click image to see more details
DMOG treatment activates hypoxia- and mitophagy-related pathways in aged MSCs. ( A , C ) Volcano plots of differentially expressed genes (DEGs) in P5 ( A ) and P24 ( C ) MSCs after DMOG treatment. Key mitophagy-related genes, BNIP3 and BNIP3L, were consistently upregulated in both groups. ( B , D ) KEGG pathway enrichment analysis in P5 ( B ) and P24 ( D ) MSCs showing that DMOG activated HIF-1 signaling, glycolysis/gluconeogenesis, and mitophagy-related pathways in both young and aged MSCs. ( E ) Heatmap of DEGs in the P5, P5 + DMOG, P24, and P24 + DMOG groups. Each group has three biological replicates. ( F ) KEGG pathway analysis of all groups highlights the key pathways activated by DMOG, including HIF-1 signaling and glycolysis. ( G ) Heatmap showing the expression levels of key mitophagy-related genes (e.g., BNIP3, BNIP3L, HIF-1 A) upregulated by DMOG treatment. ( H ) Venn diagram illustrating the shared and unique DEGs across comparisons. A total of 79 genes were co-regulated by DMOG in both P5 and P24 MSCs. ( I - K ) GO and pathway analyses of co-regulated genes revealed enrichment in hypoxia response, glycolysis, and other metabolic processes Full size image
Index in PubMed under a CC BY license. PMID: 40457488

Click image to see more details
DMOG rejuvenates senescent MSCs through BNIP3-dependent mitophagy. ( A , B ) Western blot analysis ( A ) and quantification ( B ) showing the expression of mitophagy-related proteins BNIP3 and BNIP3L in P5, P15, and H₂O₂-treated P5 MSCs with or without DMOG treatment. ( C , D ) Western blot analysis ( C ) and quantification ( D ) of BNIP3 expression in P15 MSCs after BNIP3 knockdown with siRNA. ( E ) Real-time PCR analysis of BNIP3 expression in P15 MSCs with or without DMOG treatment and BNIP3 knockdown. ( F , G ) SA-β-gal staining ( F ) and quantification ( G ) showing the percentage of senescent cells in P15 MSCs. Scale bar = 500 μm. ( H , I ) Confocal images (H) and quantification (I) of colocalization between mitochondria (Mitotracker Green) and lysosomes (Lysotracker Red) in P15 MSCs. Scale bar = 10 μm. Data are expressed as mean ± SEM ( n = 3). ** p < 0.01, *** p < 0.001. Full-length blots are presented in Supplementary Materials - WB Raw Data Full size image
Index in PubMed under a CC BY license. PMID: 40457488

Click image to see more details
Western blot analysis of BNIP3 using anti-BNIP3 antibody (A01469).
Electrophoresis was performed on a 5-20% SDS-PAGE gel at 70V (Stacking gel) / 90V (Resolving gel) for 2-3 hours. The sample well of each lane was loaded with 50ug of sample under reducing conditions.
Lane 1: human Hela whole cell lysates,
Lane 2: human A375 whole cell lysates,
Lane 3: human A549 whole cell lysates.
After Electrophoresis, proteins were transferred to a Nitrocellulose membrane at 150mA for 50-90 minutes. Blocked the membrane with 5% Non-fat Milk/ TBS for 1.5 hour at RT. The membrane was incubated with rabbit anti-BNIP3 antigen affinity purified polyclonal antibody (Catalog # A01469) at 0.5 μg/mL overnight at 4°C, then washed with TBS-0.1%Tween 3 times with 5 minutes each and probed with a goat anti-rabbit IgG-HRP secondary antibody at a dilution of 1:10000 for 1.5 hour at RT. The signal is developed using an Enhanced Chemiluminescent detection (ECL) kit (Catalog # EK1002) with Tanon 5200 system. A specific band was detected for BNIP3 at approximately 21KD. The expected band size for BNIP3 is at 21KD.
Specific Publications For Anti-BNIP3 Antibody Picoband® (A01469)
Loading publications
Recommended Resources
Here are featured tools and databases that you might find useful.
- Boster's Pathways Library
- Protein Databases
- Bioscience Research Protocol Resources
- Data Processing & Analysis Software
- Photo Editing Software
- Scientific Literature Resources
- Research Paper Management Tools
- Molecular Biology Software
- Primer Design Tools
- Bioinformatics Tools
- Phylogenetic Tree Analysis
Customer Reviews
Have you used Anti-BNIP3 Antibody Picoband®?
Share your experimental results or join a short interview to earn up to $1,000 in product credits or other rewards.
0 Reviews For Anti-BNIP3 Antibody Picoband®
Customer Q&As
Have a question?
Find answers in Q&As, reviews.
Can't find your answer?
Submit your question
