Click image to see more details
-

-
-
-
-
+3
Product Info Summary
| SKU: | A00455-3 |
|---|---|
| Size: | 100 μg/vial |
| Reactive Species: | Human |
| Host: | Rabbit |
| Application: | ELISA, Flow Cytometry, WB |
Customers Who Bought This Also Bought

Product info
Product Name
Anti-CXCR2 Antibody Picoband®
SKU/Catalog Number
A00455-3
Size
100 μg/vial
Form
Lyophilized
Description
Boster Bio Anti-CXCR2 Antibody Picoband® catalog # A00455-3. Tested in ELISA, Flow Cytometry, WB applications. This antibody reacts with Human. The brand Picoband indicates this is a premium antibody that guarantees superior quality, high affinity, and strong signals with minimal background in Western blot applications. Only our best-performing antibodies are designated as Picoband, ensuring unmatched performance.
Storage & Handling
At -20°C for one year from date of receipt. After reconstitution, at 4°C for one month. It can also be aliquotted and stored frozen at -20°C for six months. Avoid repeated freezing and thawing.
Cite This Product
Anti-CXCR2 Antibody Picoband® (Boster Biological Technology, Pleasanton CA, USA, Catalog # A00455-3)
Host
Rabbit
Contents
Each vial contains 4 mg Trehalose, 0.9 mg NaCl, 0.2 mg Na2HPO4.
Clonality
Polyclonal
Isotype
Rabbit IgG
Immunogen
E.coli-derived human CXCR2 recombinant protein (Position: M1-Q216).
Cross-reactivity
No cross-reactivity with other proteins
Reactive Species
A00455-3 is reactive to CXCR2 in Human
Observed Molecular Weight
41-50 kDa
Calculated molecular weight
40.8 kDa
Background of CXCR2
CXCR2 is a receptor for Interleukin 8, which is a powerful neutrophil chemotactic factor. It is a member of the GPCR family (subfamily, chemokine). Binding of IL8 to the receptor causes activation of neutrophils. This response is mediated via a G-protein that activate a phosphatidylinositol-calcium second messenger system. This receptor binds to IL8 with a high affinity and to GRO/MGSA and NAP2 also with a high affinity. It has been reported to be expressed in a wide variety of tissues. ESTs have been isolated from human placenta and thymus libraries.
Antibody Validation
Boster validates all antibodies on WB, IHC, ICC, Immunofluorescence, and ELISA with known positive control and negative samples to ensure specificity and high affinity, including thorough antibody incubations.
Application & Images
Applications
A00455-3 is guaranteed for ELISA, Flow Cytometry, WB Boster Guarantee
Recommend Dilution
| Application | Dilution | Species |
|---|---|---|
| Western blot | 0.25-0.5 μg/ml | Human |
| Flow Cytometry (Fixed) | 1-3 μg/1x106 cells | Human |
| ELISA | 0.1-0.5 μg/ml | - |
Tested application
Suggested blocking solution with 5% non-fat milk or BSA; (*)Recommended protein loading: 20-40 µg per lane
Validation Images & Assay Conditions
Click image to see more details
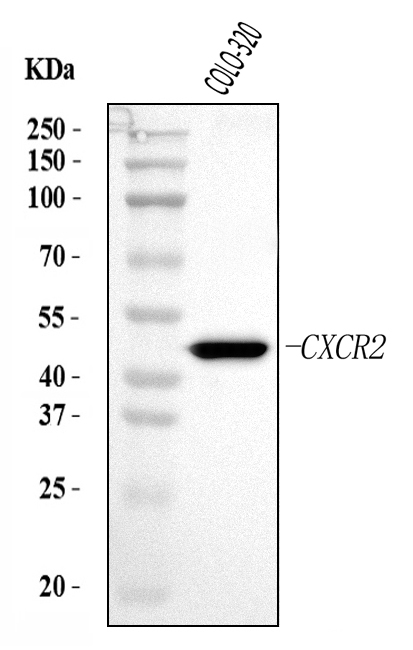
Western blot analysis of CXCR2 using anti-CXCR2 antibody (A00455-3).
Electrophoresis was performed on a 5-20% SDS-PAGE gel at 70V (Stacking gel) / 90V (Resolving gel) for 2-3 hours. The sample well of each lane was loaded with 30 ug of sample under reducing conditions.
Lane 1: human COLO-320 whole cell lysates.
After electrophoresis, proteins were transferred to a nitrocellulose membrane at 150 mA for 50-90 minutes. Blocked the membrane with 5% non-fat milk/TBS for 1.5 hour at RT. The membrane was incubated with rabbit anti-CXCR2 antigen affinity purified polyclonal antibody (Catalog # A00455-3) at 0.5 μg/mL overnight at 4°C, then washed with TBS-0.1%Tween 3 times with 5 minutes each and probed with a goat anti-rabbit IgG-HRP secondary antibody at a dilution of 1:5000 for 1.5 hour at RT. The signal is developed using an Enhanced Chemiluminescent detection (ECL) kit (Catalog # EK1002) with Tanon 5200 system. A specific band was detected for CXCR2 at approximately 41-50 kDa. The expected band size for CXCR2 is at 41 kDa.

Click image to see more details
Expressions of CXCL6, CXCR1, and CXCR2 in osteosarcoma (OS) cells. The mRNA expressions of CXCL6 (A) , CXCR1 (B) , and CXCR2 (C) in multiple OS cell lines were evaluated by real-time PCR. The protein levels of CXCL6 (D) , CXCR1 (E) , and CXCR2 (F) in multiple OS cell lines were detected by western blot assay. (G–I) The protein quantification histograms were shown.
Index in PubMed under a CC BY license. PMID: 30984000

Click image to see more details
CXCL6/CXCR2 axis contributed to migration and invasion of OS cells. After transfection with siRNAs for 24 h, OS cells were treated with 100 ng/ml rhCXCL6 for 24 h. The mRNA expression of CXCR2 in SaOS-2 (A) and U2OS (B) cells was detected by real-time PCR. The protein expression of CXCR2 in SaOS-2 (C) and U2OS (D) cells was assessed by western blot assay. The protein quantification histograms were shown. (E) The migration of SaOS-2 and U2OS cells was detected by Transwell assay (no matrigel). Scal bar = 100 μm. (F,G) The number of migrated cells was shown. (H) The invasion of SaOS-2 and U2OS cells was determined by Transwell assay (matrigel). Scal bar = 100 μm. (I,J) The number of invasive cells was shown. (K) The protein levels of MMP9 and Snail in SaOS-2 and U2OS cells were detected by western blot assay. (L–O) The protein quantification histograms were shown. (P) MMP-9 activity in the supernatant fluid of cultured SaOS-2 and U2OS cells was determined by gelatin zymography method. (Q,R) The quantification histograms were shown. ∗∗ P < 0.01, ∗∗∗ P < 0.001, versus the SaOS-2+NC or U2OS+NC group. # P < 0.05, ## P < 0.01, ### P < 0.001, versus the rhCXCL6+NC group.
Index in PubMed under a CC BY license. PMID: 30984000

Click image to see more details
Effect of CXCL6/CXCR2 axis on E-cadherin and N-cadherin expressions. The expressions of E-cadherin (A) and N-cadherin (B) in SaOS-2 and U2OS cells with different treatments were determined by immunofluorescence assay. Scal bar = 50 μm.
Index in PubMed under a CC BY license. PMID: 30984000

Click image to see more details
PI3K/AKT and β-catenin signaling pathways participated in the regulation of migration, invasion and EMT by CXCL6/CXCR2 axis in OS cells. After transfection with siRNAs for 24 h, OS cells were treated with 100 ng/ml rhCXCL6 for 24 h. (A) The protein levels of p-AKT, AKT, and nuclear β-catenin in SaOS-2 and U2OS cells were detected by western blot assay. β-actin and Histone H3 were used as loading controls. (B–E) The protein quantification histograms were shown. OS cells were pre-treated with 50 μM LY294002 or 10 μM XAV939 for 1 h, then treated with 100 ng/ml rhCXCL6 for 24 h. (F) The migration of SaOS-2 and U2OS cells was detected by Transwell assay (no matrigel). Scal bar = 100 μm. (G,H) The number of migrated cells was shown. (I) The invasion of SaOS-2 and U2OS cells was determined by Transwell assay (matrigel). Scal bar = 100 μm. (J,K) The number of invasive cells was shown. (L) The protein levels of E-cadherin, N-cadherin, Snail, and MMP9 in SaOS-2 and U2OS cells were detected by western blot assay. (M–T) The protein quantification histograms were shown. (U) MMP-9 activity in the supernatant fluid of cultured SaOS-2 and U2OS cells was assessed by gelatin zymography assay. (V,W) The quantification histograms were shown. ∗∗∗ P < 0.001, versus the OS cell or OS cell +NC group. # P < 0.05, ## P < 0.01, ### P < 0.001, versus the rhCXCL6+NC or rhCXCL6 group.
Index in PubMed under a CC BY license. PMID: 30984000

Click image to see more details
Effect of CXCL6/CXCR2 axis on OS tumor growth and pulmonary metastasis in vivo . U2OS cells were infected with lentivirus expressing CXCL6 or NC. The mRNA (A) and protein level (B) of CXCL6 in U2OS cells were determined by real-time PCR and western blot assay. (C) After the injection of LV-CXCL6 or LV-NC U2OS cells for 21 days, the representative images of nude mice and their removed xenograft tumors were shown. (D) The tumor volume was calculated and the tumor growth-curve was shown. (E) The weight of xenograft tumors was shown. (F) The expression of PCNA in tumor tissues was detected by immunohistochemical staining. Scal bar = 50 μm. (G) The percentage of PCNA positive cells were calculated and shown. (H) The protein levels of p-AKT, AKT, and nuclear β-catenin in tumor tissues were detected by western blot assay. β-actin and Histone H3 were used as loading controls. (I,J) The protein quantification histograms were shown. (K) Representative images of the lung of nude mice. (L) The number of lung metastatic nodes was quantified. ∗∗∗ P < 0.001, versus the LV-NC group. ## P < 0.01, ### P < 0.001, versus the LV-CXCL6 group.
Index in PubMed under a CC BY license. PMID: 30984000

Click image to see more details
Flow Cytometry analysis of THP-1 cells using anti-CXCR2 antibody (A00455-3).
Overlay histogram showing THP-1 cells stained with A00455-3 (Blue line). To facilitate intracellular staining, cells were fixed with 4% paraformaldehyde and permeabilized with permeabilization buffer. The cells were blocked with 10% normal goat serum. And then incubated with rabbit anti-CXCR2 Antibody (A00455-3, 1 μg/1x106 cells) for 30 min at 20°C. DyLight®488 conjugated goat anti-rabbit IgG (BA1127, 5-10 μg/1x106 cells) was used as secondary antibody for 30 minutes at 20°C. Isotype control antibody (Green line) was rabbit IgG (1 μg/1x106) used under the same conditions. Unlabelled sample without incubation with primary antibody and secondary antibody (Red line) was used as a blank control.
Specific Publications For Anti-CXCR2 Antibody Picoband® (A00455-3)
Loading publications
Recommended Resources
Here are featured tools and databases that you might find useful.
- Boster's Pathways Library
- Protein Databases
- Bioscience Research Protocol Resources
- Data Processing & Analysis Software
- Photo Editing Software
- Scientific Literature Resources
- Research Paper Management Tools
- Molecular Biology Software
- Primer Design Tools
- Bioinformatics Tools
- Phylogenetic Tree Analysis
Customer Reviews
Have you used Anti-CXCR2 Antibody Picoband®?
Share your experimental results or join a short interview to earn up to $1,000 in product credits or other rewards.
0 Reviews For Anti-CXCR2 Antibody Picoband®
Customer Q&As
Have a question?
Find answers in Q&As, reviews.
Can't find your answer?
Submit your question
