Click image to see more details
-

-
-
-
-
+1
Product Info Summary
| SKU: | A00002-5 |
|---|---|
| Size: | 100 μg/vial |
| Reactive Species: | Mouse, Rat |
| Host: | Rabbit |
| Application: | ELISA, WB |
Customers Who Bought This Also Bought

Product info
Product Name
Anti-TNF alpha Antibody Picoband®
SKU/Catalog Number
A00002-5
Size
100 μg/vial
Form
Lyophilized
Description
Boster Bio Anti-TNF alpha/Tnf Antibody Picoband® catalog # A00002-5. Tested in ELISA, WB applications. This antibody reacts with Mouse, Rat, offering an essential tool for scientific applications such as cell lysate analysis and breast adenocarcinoma cell line research. The brand Picoband indicates this is a premium antibody that guarantees superior quality, high affinity, and strong signals with minimal background in Western blot applications. Only our best-performing antibodies are designated as Picoband, ensuring unmatched performance.
Storage & Handling
Store at -20˚C for one year from date of receipt. After reconstitution, at 4˚C for one month. It can also be aliquotted and stored frozen at -20˚C for six months. Avoid repeated freeze-thaw cycles.
Cite This Product
Anti-TNF alpha Antibody Picoband® (Boster Biological Technology, Pleasanton CA, USA, Catalog # A00002-5)
Host
Rabbit
Contents
Each vial contains 4mg Trehalose, 0.9mg NaCl and 0.2mg Na2HPO4.
Clonality
Polyclonal
Isotype
Rabbit IgG
Immunogen
E.coli-derived mouse TNF alpha/Tnf recombinant protein (Position: D89-E185).
Cross-reactivity
No cross-reactivity with other proteins.
Reactive Species
A00002-5 is reactive to Tnf in Mouse, Rat
Observed Molecular Weight
17 kDa
Calculated molecular weight
25.9 kDa
Background of Tnf
TNF alpha (Tumor Necrosis Factor alpha) gene encodes a multifunctional proinflammatory cytokine that belongs to the tumor necrosis factor (TNF) superfamily. This cytokine is mainly secreted by macrophages. It can bind to, and thus functions through its receptors TNFRSF1A/TNFR1 and TNFRSF1B/TNFBR. This cytokine is involved in the regulation of a wide spectrum of biological processes including cell proliferation, differentiation, apoptosis, lipid metabolism, and coagulation. This cytokine has been implicated in a variety of diseases, including autoimmune diseases, insulin resistance, and cancer. Knockout studies in mice also suggested the neuroprotective function of this cytokine.
Antibody Validation
Boster validates all antibodies on WB, IHC, ICC, Immunofluorescence, and ELISA with known positive control and negative samples to ensure specificity and high affinity, including thorough antibody incubations.
Application & Images
Applications
A00002-5 is guaranteed for ELISA, WB Boster Guarantee
Recommend Dilution
| Application | Dilution | Species |
|---|---|---|
| Western blot | 0.25-0.5μg/ml | Mouse, Rat |
| ELISA | 0.1-0.5μg/ml | - |
Tested application
Suggested blocking solution with 5% non-fat milk or BSA; (*)Recommended protein loading: 20-40 µg per lane
Validation Images & Assay Conditions
Click image to see more details
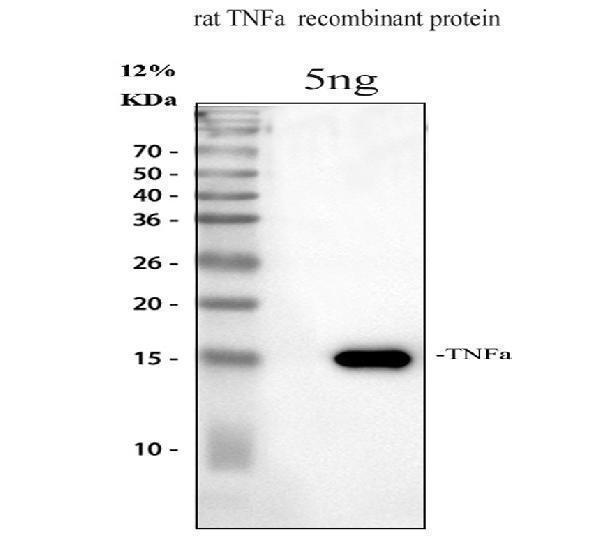
Western blot analysis of TNF alpha using anti-TNF alpha antibody (A00002-5).
Electrophoresis was performed on a 12% SDS-PAGE gel at 80V (Stacking gel) / 120V (Resolving gel) for 2 hours.
Lane 1: recombinant rat TNF alpha protein 5 ng,
After electrophoresis, proteins were transferred to a nitrocellulose membrane at 150 mA for 50-90 minutes. Blocked the membrane with 5% non-fat milk/TBS for 1.5 hour at RT. The membrane was incubated with rabbit anti-TNF alpha antigen affinity purified polyclonal antibody (A00002-5) at 0.5 μg/mL overnight at 4°C, then washed with TBS-0.1%Tween 3 times with 5 minutes each and probed with a goat anti-rabbit IgG-HRP secondary antibody (Catalog # BA1054) at a dilution of 1:5000 for 1.5 hour at RT. The signal is developed using an ECL Plus Western Blotting Substrate (Catalog # AR1196-200) with Tanon 5200 system. A specific band was detected for TNF alpha at approximately 17 kDa.

Click image to see more details
Western blot analysis of TNF alpha using anti-TNF alpha antibody (A00002-5).
Electrophoresis was performed on a 12% SDS-PAGE gel at 80V (Stacking gel) / 120V (Resolving gel) for 2 hours.
Lane 1: recombinant mouse TNF alpha protein 5 ng.
After electrophoresis, proteins were transferred to a nitrocellulose membrane at 150 mA for 50-90 minutes. Blocked the membrane with 5% non-fat milk/TBS for 1.5 hour at RT. The membrane was incubated with rabbit anti-TNF alpha antigen affinity purified polyclonal antibody (A00002-5) at 0.5 μg/mL overnight at 4°C, then washed with TBS-0.1%Tween 3 times with 5 minutes each and probed with a goat anti-rabbit IgG-HRP secondary antibody (Catalog # BA1054) at a dilution of 1:5000 for 1.5 hour at RT. The signal is developed using an ECL Plus Western Blotting Substrate (Catalog # AR1196-200) with Tanon 5200 system. A specific band was detected for TNF alpha at approximately 17 kDa.

Click image to see more details
The role of gastric cancer cells in transforming macrophages in the TME. a The expression of M1 macrophage marker proteins in different groups. b The expression of M2 macrophage marker proteins in different groups. c Differential gene expression between M0 and gastric cancer cell metabolite intervention group. d Differential gene expression between M2 and gastric cancer cell metabolite intervention group. e Intersection statistics of differentially expressed genes between M2 and gastric cancer cell metabolite intervention group. f Intersection gene enrichment statistics. g RT-qPCR was used to detect the expression of CD86 mRNA. h RT-qPCR was used to detect the expression of iNOS mRNA. i RT-qPCR was used to detect the expression of CD206 mRNA. j RT-qPCR was used to detect the expression of IL1R2 mRNA. k RT-qPCR was used to detect the expression of CD163 mRNA. l RT-qPCR was used to detect the expression of TGFβ mRNA. m ELISA was used to detect TNF-α levels. n ELISA detects IL-10 levels. o ELISA detects the content of TGFβ1. *p<0.05; **p<0.01; ***p<0.001.
Index in PubMed under a CC BY license. PMID: 39991579

Click image to see more details
The effect of M2 subtype macrophages on TGFβ1 related pathway and epithelial mesenchymal transition in gastric cancer cells. a Cell intervention pattern diagram. b RT-qPCR was used to detect the levels of TGFβ mRNA in different intervention groups. c ELISA was used to test the expression of TNF-α in different intervention groups. d ELISA test the expression of IL-10 in different intervention groups. e ELISA was used to test the expression of TGFβ1 in different intervention groups. f The expression results of TGFβ1 protein. g The WB results of different interventions on histone expression. h The expression results of p-Smad2 protein. i The expression results of Smad2 protein. j The expression results of p-Smad3 protein. k The expression results of Smad3 protein. l The expression results of E-cadherin protein. m Results of N-cadherin protein expression. n Results of Vimentin protein expression. o RT-qPCR was used to detect the content of TGFβ mRNA at different intervention times. p ELISA was used to test the expression of TNF-α at different intervention times. q ELISA test the expression of IL-10 at different intervention times. r ELISA was used to test the expression of TGFβ1 at different intervention times. s WB results of protein expression at different intervention times. t The expression results of E-cadherin protein. u The expression results of N-cadherin protein. v Results of Vimentin protein expression. w Fluorescence results of mitochondrial membrane potential at different intervention times. Scale bar=50 μm. *p<0.05, **p<0.01, ***p<0.001.
Index in PubMed under a CC BY license. PMID: 39991579

Click image to see more details
Different inducers promote polarization of different subtypes of macrophages. a The CCK-8 method was used to detect the survival of M0 macrophages after 24 h of IL-4 intervention. b The CCK-8 method was used to detect the survival of M0 macrophages after 24 h of intervention with TGFβ1. c The CCK-8 method was used to detect the survival of M0 macrophages after LPS intervention for 24 h. d RT-qPCR was used to detect the expression of CD86 mRNA. e RT-qPCR was used to detect the expression of iNOS mRNA. f RT-qPCR was used to detect the expression of CD206 mRNA. g RT-qPCR was used to detect the expression of IL1R2 mRNA. h RT-qPCR was used to detect the expression of CD163 mRNA. i RT-qPCR was used to detect the expression of TGFβ mRNA. j ELISA detects TNF - α levels. k ELISA was used to detect IL-10 levels. l ELISA detects the content of TGFβ1. m The WB results of different interventions on histone expression. f TNF-α protein expression results. f IL-10 protein expression results. f TGFβ1 protein expression results. *p<0.05, **p<0.01, ***p<0.001.
Index in PubMed under a CC BY license. PMID: 39991579
Specific Publications For Anti-TNF alpha Antibody Picoband® (A00002-5)
Loading publications
Recommended Resources
Here are featured tools and databases that you might find useful.
- Boster's Pathways Library
- Protein Databases
- Bioscience Research Protocol Resources
- Data Processing & Analysis Software
- Photo Editing Software
- Scientific Literature Resources
- Research Paper Management Tools
- Molecular Biology Software
- Primer Design Tools
- Bioinformatics Tools
- Phylogenetic Tree Analysis
Customer Reviews
Have you used Anti-TNF alpha Antibody Picoband®?
Share your experimental results or join a short interview to earn up to $1,000 in product credits or other rewards.
0 Reviews For Anti-TNF alpha Antibody Picoband®
Customer Q&As
Have a question?
Find answers in Q&As, reviews.
Can't find your answer?
Submit your question
