
Click image to see more details
-

-
-
-
-
+15
Product Info Summary
| SKU: | PA1079 |
|---|---|
| Size: | 100 μg/vial |
| Reactive Species: | Human, Mouse, Rat |
| Host: | Rabbit |
| Application: | Flow Cytometry, IHC, WB |
Customers Who Bought This Also Bought

Product info
Product Name
Anti-TNF alpha Antibody Picoband®
SKU/Catalog Number
PA1079
BA0131 is an alternative SKU for this antibody, used in previous lots.
Size
100 μg/vial
Form
Lyophilized
Description
Boster Bio Anti-TNF alpha Antibody catalog # PA1079. Tested in Flow Cytometry, IHC, WB applications. This antibody reacts with Human, Mouse, Rat. The brand Picoband indicates this is a premium antibody that guarantees superior quality, high affinity, and strong signals with minimal background in Western blot applications. Only our best-performing antibodies are designated as Picoband, ensuring unmatched performance.
Storage & Handling
Store at -20˚C for one year from date of receipt. After reconstitution, at 4˚C for one month. It can also be aliquotted and stored frozen at -20˚C for six months. Avoid repeated freeze-thaw cycles.
Cite This Product
Anti-TNF alpha Antibody Picoband® (Boster Biological Technology, Pleasanton CA, USA, Catalog # PA1079)
Host
Rabbit
Contents
Each vial contains 4 mg Trehalose, 0.9 mg NaCl and 0.2 mg Na2HPO4.
Clonality
Polyclonal
Isotype
Rabbit IgG
Immunogen
A synthetic peptide corresponding to a sequence at the C-terminus of human TNF alpha, different from the related mouse sequence by five amino acids, and rat sequence by seven amino acids.
Cross-reactivity
No cross-reactivity with other proteins
Reactive Species
PA1079 is reactive to TNF in Human, Mouse, Rat
Observed Molecular Weight
25 kDa
Calculated molecular weight
25.6 kDa
Background of TNF
TNF alpha (Tumor Necrosis Factor alpha) gene encodes a multifunctional proinflammatory cytokine that belongs to the tumor necrosis factor (TNF) superfamily. This cytokine is mainly secreted by macrophages. It can bind to, and thus functions through its receptors TNFRSF1A/TNFR1 and TNFRSF1B/TNFBR. This cytokine is involved in the regulation of a wide spectrum of biological processes including cell proliferation, differentiation, apoptosis, lipid metabolism, and coagulation. This cytokine has been implicated in a variety of diseases, including autoimmune diseases, insulin resistance, and cancer. Knockout studies in mice also suggested the neuroprotective function of this cytokine.
Antibody Validation
Boster validates all antibodies on WB, IHC, ICC, Immunofluorescence, and ELISA with known positive control and negative samples to ensure specificity and high affinity, including thorough antibody incubations.
Application & Images
Applications
PA1079 is guaranteed for Flow Cytometry, IHC, WB Boster Guarantee
Assay Dilutions Recommendation
The recommendations below provide a starting point for assay optimization. The actual working concentration varies and should be decided by the user.
Western blot, 0.1-0.5μg/ml, Human, Mouse, Rat
Immunohistochemistry (Paraffin-embedded Section), 2-5μg/ml, Human
Flow Cytometry (Fixed), 1-3 μg/1x106 cells, Human
Positive Control
WB: human U937 whole cell, rat spleen tissue, rat C6 whole cell, mouse spleen tissue
IHC: human B lymphocytic tumor tissue
FCM: CACO-2 cell
Validation Images & Assay Conditions
Click image to see more details
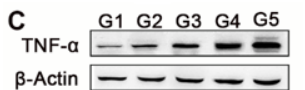
Western blot analysis of TNF alpha using anti-TNF alpha antibody (PA1079).
Electrophoresis was performed on a 5-20% SDS-PAGE gel at 80V (Stacking gel) / 120V (Resolving gel) for 2 hours. The sample well of each lane was loaded with 30 ug of sample under reducing conditions.
Lane 1-5: mouse lung cancer tissue.
After electrophoresis, proteins were transferred to a nitrocellulose membrane at 150 mA for 50-90 minutes. Blocked the membrane with 5% non-fat milk/TBS for 1.5 hour at RT. The membrane was incubated with rabbit anti-TNF alpha antigen affinity purified polyclonal antibody (PA1079) at 1:1000 overnight at 4°C, then washed with TBS-0.1%Tween 3 times with 5 minutes each and probed with a goat anti-rabbit IgG-HRP secondary antibody for 1 hour at RT. The signal is developed using an ECL Plus Western Blotting Substrate (Catalog # AR1196-200) with Tanon 5200 system. The expected band size for TNF alpha is at 26 kDa.

Click image to see more details
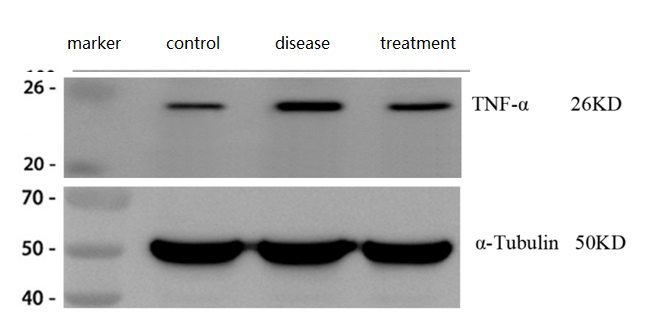
Western blot analysis of TNF alpha using anti-TNF alpha antibody (PA1079).
Electrophoresis was performed on a 5-20% SDS-PAGE gel at 70V (Stacking gel) / 90V (Resolving gel) for 2-3 hours. The sample well of each lane was loaded with 30 ug of sample under reducing conditions.
Lane 1: control group-normal mouse hippocampal tissue lysates,
Lane 2: hippocampal tissue from Alzheimer’s disease model mouse,
Lane 3: hippocampal tissue from Alzheimer’s disease model mouse treated with a self-developed drug.
After electrophoresis, proteins were transferred to a nitrocellulose membrane at 150 mA for 50-90 minutes. Blocked the membrane with 5% non-fat milk/TBS for 1.5 hour at RT. The membrane was incubated with rabbit anti-TNF alpha antigen affinity purified polyclonal antibody (Catalog # PA1079) at 1:1000 overnight at 4°C, then washed with TBS-0.1%Tween 3 times with 5 minutes each and probed with a goat anti-rabbit IgG-HRP secondary antibody at a dilution of 1:10000 for 1 hour at RT. The signal is developed using an Enhanced Chemiluminescent detection (ECL) kit (Catalog # EK1002) with ChemiDoc MP system. A specific band was detected for TNF alpha at approximately 26 kDa. The expected band size for TNF alpha is at 26 kDa.

Click image to see more details
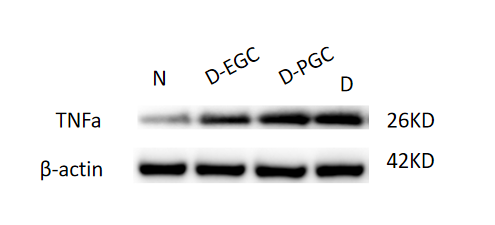
Western blot analysis of TNF alpha using anti-TNF alpha antibody (PA1079).
Electrophoresis was performed on a 5-20% SDS-PAGE gel at 70V (Stacking gel) / 90V (Resolving gel) for 2-3 hours. The sample well of each lane was loaded with 30 ug of sample under reducing conditions.
Lane 1: normal rat alveolar bone tissue lysates,
Lane 2: alveolar bone from a diabetic bone defect model treated with EGCG,
Lane 3: alveolar bone from a diabetic bone defect model treated with PGC-1α,
Lane 4: alveolar bone from a diabetic bone defect model.
After electrophoresis, proteins were transferred to a nitrocellulose membrane at 150 mA for 50-90 minutes. Blocked the membrane with 5% non-fat milk/TBS for 1.5 hour at RT. The membrane was incubated with rabbit anti-TNF alpha antigen affinity purified polyclonal antibody (Catalog # PA1079) at 1:1000 overnight at 4°C, then washed with TBS-0.1%Tween 3 times with 5 minutes each and probed with a goat anti-rabbit IgG-HRP secondary antibody at a dilution of 1:10000 for 1 hour at RT. The signal is developed using an Enhanced Chemiluminescent detection (ECL) kit (Catalog # EK1002) with ChemiDoc MP system. A specific band was detected for TNF alpha at approximately 26 kDa. The expected band size for TNF alpha is at 26 kDa.

Click image to see more details
Wound healing with different hydrogels in vivo . (A) Preparation and observation of diabetic chronic wounds related to orthopedics. (B) Photographs of the wound treated with the hydrogel in different hydrogel groups. (C) Wound recovery curve of different hydrogel groups. (D) H&E staining and Masson staining of wound tissue on day 10 in different hydrogel groups. (E) IHC staining of wound tissue in iNOS and CD206.
Index in PubMed under a CC BY license. PMID: 41190287

Click image to see more details
Immunomodulatory properties pathway of the hydrogel. (A, B) Flow cytometry analysis of the macrophage surface markers CD11C and CD86. (C) Representative immunofluorescence images of iNOS in RAW264.7 cells. (D, E) Quantitative analysis of flow cytometry in CD11C and CD86. (F) Quantitative analysis of the mean fluorescence intensity of iNOS. (G) Western blot of IκB-α, p65, and p-p65. (H) Quantitative analysis of the relative expression of IκB-α, p65, and p-p65 in different hydrogels.
Index in PubMed under a CC BY license. PMID: 41190287

Click image to see more details
Western blot analysis of TNF alpha using anti-TNF alpha antibody (PA1079).
Electrophoresis was performed on a 5-20% SDS-PAGE gel at 70V (Stacking gel) / 90V (Resolving gel) for 2-3 hours. The sample well of each lane was loaded with 30 ug of sample under reducing conditions.
Lane 1: human U937 whole cell lysates,
Lane 2: rat spleen tissue lysates,
Lane 3: rat C6 whole cell lysates,
Lane 4: mouse spleen tissue lysates.
After electrophoresis, proteins were transferred to a nitrocellulose membrane at 150 mA for 50-90 minutes. Blocked the membrane with 5% non-fat milk/TBS for 1.5 hour at RT. The membrane was incubated with rabbit anti-TNF alpha antigen affinity purified polyclonal antibody (Catalog # PA1079) at 0.5 μg/mL overnight at 4°C, then washed with TBS-0.1%Tween 3 times with 5 minutes each and probed with a goat anti-rabbit IgG-HRP secondary antibody at a dilution of 1:5000 for 1.5 hour at RT. The signal is developed using an Enhanced Chemiluminescent detection (ECL) kit (Catalog # EK1002) with Tanon 5200 system. A specific band was detected for TNF alpha at approximately 25 kDa. The expected band size for TNF alpha is at 26 kDa.

Click image to see more details
Pathological evaluation of IL-1RA−/− mice synovial tissue. HE staining showed synovial hyperplasia (A) and inflammation (B). (C) IHC staining of TNF-α in synovial tissue. (D) IHC staining of IL-10 in synovial tissue.(E and F) Levels of TNF-α and IL-10 in the blood of IL1RA−/ -deficient mice. ##P < 0.01 versus Ctrl; ∗∗P < 0.01versus Model. n = 6 mice for each group. Control is wild-type mice, and the model is IL1RA−/− mice.
Index in PubMed under a CC BY license. PMID: 40688514

Click image to see more details
IHC analysis of TNF alpha using anti-TNF alpha antibody (PA1079).
TNF alpha was detected in a paraffin-embedded section of human B lymphocytic tumor tissue. Heat mediated antigen retrieval was performed in EDTA buffer (pH 8.0, epitope retrieval solution). The tissue section was blocked with 10% goat serum. The tissue section was then incubated with 2 μg/ml rabbit anti-TNF alpha Antibody (PA1079) overnight at 4°C. Peroxidase Conjugated Goat Anti-rabbit IgG was used as secondary antibody and incubated for 30 minutes at 37°C. The tissue section was developed using HRP Conjugated Rabbit IgG Super Vision Assay Kit (Catalog # SV0002) with DAB as the chromogen.

Click image to see more details
SADS inhibited Raw264.7 and fibroblast-like synoviocyte inflammation in vitro. (A) The effect of SADS on the viability of Raw264.7. (B–D) RT-PCR analysis of TNF-α, IL-6 and IL-10 in Raw264.7 treated with SADS.(E) The effect of SADS on the viability of fibroblast-like synoviocytes. (F–H) RT-PCR analysis of TNF-α, IL-6 and IL-10 in fibroblast-like synoviocytes treated with SADS.(I) The phenotype of Raw264.7 was analyzed by flow cytometry.(J and K) Statistics of the proportion of M2 and M1 macrophages. (L and M) TNF-α protein expression level detection. ##P < 0.01 versus Ctrl; ∗∗P < 0.01versus LPS. n = 6.
Index in PubMed under a CC BY license. PMID: 40688514

Click image to see more details
Flow Cytometry analysis of CACO-2 cells using anti-TNF alpha antibody (PA1079).
Overlay histogram showing CACO-2 cells stained with PA1079 (Blue line). The cells were blocked with 10% normal goat serum. And then incubated with rabbit anti-TNF alpha Antibody (PA1079, 1 μg/1x106 cells) for 30 min at 20°C. DyLight®488 conjugated goat anti-rabbit IgG (BA1127, 5-10 μg/1x106 cells) was used as secondary antibody for 30 minutes at 20°C. Isotype control antibody (Green line) was rabbit IgG (1 μg/1x106) used under the same conditions. Unlabelled sample (Red line) was also used as a control.

Click image to see more details
Influence of the invasion of pannus in the cartilage area on cartilaginous structures and related inflammation expression (10 × 20 magnification). a - e In sacroiliitis, abundant fibrovascular tissue formed and invaded into cartilage, chondrocytes and matrix degenerated ( a ), accompanied by high levels of vascular endothelial growth factor (VEGF) ( b ), caspase-3 ( c ), matrix metalloproteinase-3 MMP-3 ( d ) and TNF-α ( e ) expressed in the cartilage. f - j In sacroiliitis, fibrovascular tissue formed in the subchondral area without invading into cartilage ( f ), accompanied by significantly lower levels of VEGF ( g ), caspase-3 ( h ), MMP-3 ( i ) and TNF-α ( j ) expressed in the cartilage. k - o In autopsy controls, there was no fibrovascular tissue formation and only partial superficial chondrocytes expressed low levels of VEGF ( l ), caspase-3 ( m ) and TNF-α ( o ). a , f , k , AP-Red staining; b - e , g - j , l - o , 3,3-diaminobenzidine staining. SpA, spondyloarthritis
Index in PubMed under a CC BY license. PMID: 29884210

Click image to see more details
Effects of polysaccharide extract from XJEK on TNF-α, IL-1β and IL-10 in L -NAME-induced hypertensive mice. ( a ) TNF-α expression level in plasma. ( b ) IL-1β expression level in plasma. ( c ) IL-10 expression level in plasma. ( d ) IL-1β expression level in cardiac tissues. ( e ) TNF-α expression level in cardiac tissues. ( f ) IL-10 expression level in cardiac tissues. ( g ) Representative image of IL-1β immunocytochemistry. ( h ) Representative image of TNF-α immunocytochemistry.( i ) Representative image of IL-10 immunocytochemistry.1,negative group; 2,control group; 3, model group; 4, L -NAME+AqE group; 5, L -NAME+XJEK group; 6, L -NAME+fosinopril group. Data are presented as the mean ± SD ( n = 10). ** P < 0.01 vs. control group; # P < 0.05, ## P < 0.01 vs, model group
Index in PubMed under a CC BY license. PMID: 31196042

Click image to see more details
The infiltration of MPO + neutrophils, and the cellular distribution and relative expression level detection of the TNF and IL-10 in the small intestinal and colonic mucosa at 7 days after the termination of DSS administration. (A) The MPO immunohistochemistry staining of the small intestinal mucosa: (A1) the normal group: few neutrophils were observed in the small intestinal mucosa; (A2) the DSS group: a number of accumulative MPO + neutrophils (brown) infiltrated into the mucosa epithelium; (A3) the DSS + B. subtilis- fermented milk group: only limited neutrophil infiltration could be observed in the small intestinal mucosa. (B) The MPO immunohistochemistry staining of the colonic mucosa: (B1) the normal group: few neutrophils were observed in the colonic mucosa; (B2) the DSS group: colonic epithelium and the glands disappeared, and the ulcer was locally replaced by scars and a number of accumulative MPO + neutrophils (brown) were observed in the scars; (B3) the DSS + B. subtilis -fermented milk group: only limited MPO + neutrophils observed in the colonic mucosa. (C) The TNF immunohistochemistry staining of the small intestinal mucosa: (C1) the normal group: the epithelium was integrated with faint yellow staining, suggesting low expression of TNF; (C2) the DSS group: the villus structure is not integrated, and the epithelial cells showed black brown, suggesting overexpression of TNF; (C3) the DSS + B. subtilis -fermented milk group: the villus and the glands were almost integrated, and the staining of epithelial cells was similar to that of the normal group (C1) , suggesting low expression of TNF. (D) The TNF immunohistochemistry staining of the colonic mucosa: (D1) the normal colonic mucosa: the epithelium was integrated with low TNF expression (faint yellow); ( D2 ) the DSS group: the epithelium structure and the glands were destroyed and replaced by a scar, and there were a number of TNF + inflammatory cells (black brown) in the scar; (D3) the DSS + B. subtilis -fermented milk group: the recovered epithelium showed faint yellow, suggesting low TNF expression. (E) The IL-10 immunohistochemistry staining of the small intestinal mucosa: (E1) the normal small intestinal mucosa: the IL-10 staining dispersed in the villi and the crypts with faint yellow, suggesting low-level expression of IL-10; (E2) the DSS group, the residual epithelium and the crypts were light brown, suggesting mid-level of IL-10 expression; (E3) the DSS + B. subtilis -fermented milk group: the dark brown staining of the regenerative epithelium represented high-level expression of IL-10. (F) The IL-10 immunohistochemistry staining of the colonic mucosa: (F1) the normal group: the IL-10 staining dispersed in the glands with bright yellow, suggesting low-level expression of IL-10; (F2) the DSS group: there were few IL-10 + cells in the scars; (F3) the DSS + B. subtilis -fermented milk group, the dark brown staining of the epithelial cells represented high-level expression of IL-10. (G,H) Western blotting analysis for the expression of MPO, TNF, and IL-10 in the samples containing equivalent ileum and colon. The expression level of MPO, TNF, and IL-10 in the DSS group was significantly higher than that of the normal (control) group. The expression level of MPO and TNF in the DSS + B. subtilis -fermented milk (FM) group was significantly lower than that of the DSS group, while the expression level of IL-10 in the DSS + B. subtilis -fermented milk (FM) group was significantly higher than that of the DSS group ( n = 5, * represents p < 0.05, ** represents p < 0.01).
Index in PubMed under a CC BY license. PMID: 33519783

Click image to see more details
Effects of polysaccharide extract from XJEK on TNF-α, IL-1β and IL-10 of HUVECs induced by Ang II. ( a ) TNF-α level in supernatants of HUVECs; ( b ) IL-1β level in supernatants of HUVECs; ( c ) IL-10 level in supernatants of HUVECs. 1, blank control group; 2, Ang II (10 − 5 mol/L) group; 3, Ang II (10 − 5 mol/L) + AqE (0.15 mg/ml) group; 4, Ang II (10 − 5 mol/L) + AqE (0.3 mg/ml) group; 5, Ang II (10 − 5 mol/L) + AqE (0.6 mg/ml) group; 6, Ang II (10 − 5 mol/L) + AqE (1.2 mg/ml) group; 7, Ang II (10 − 5 mol/L) + XJEK (1.6 mg/ml) group. Data are expressed as mean ± SD, n = 6. ** P < 0.01 vs control group; ## P < 0.01 vs Ang II group
Index in PubMed under a CC BY license. PMID: 31196042

Click image to see more details
MT inhibited the production of pro-inflammatory proteins in sleep-deprived rats. (A) Western blot bands showing the protein expression levels of IL-1β, IL-6, TNF-α, iNOS, and COX2 in the HP, respectively. (B–F) Relative protein expression level of IL-1β, IL-6, TNF-α, iNOS, and COX2 in the HP, respectively. The data are expressed as the means ± SEM. # p < 0.05, ## p < 0.01, ### p < 0.001 vs Control group; * p < 0.05, ** p < 0.01 vs. Model group.
Index in PubMed under a CC BY license. PMID: 39101143

Click image to see more details
Skin phenotype in Krt32 KO mice induced by TNF. A Schematic representation of the experimental schedule. Eight-week-old Krt32 wildtype (WT) and knockout (KO) C57BL/6J mice ( n = 8 mice/group) were subcutaneously injected with TNF at a dose of 6 μg/kg/day body weight into their shaved dorsal skin for a duration of 48 h. The dorsal skin of Krt32 ( −/−) mice exhibited pronounced thickening and extensive yellow scaling, resembling the cutaneous manifestations observed in human patients with pityriasis rubra pilaris (PRP). Skin, hair, and nail samples were collected for RNA-seq, H&E staining, transmission electron microscopy (TEM), and scanning electron microscopy (SEM) analysis. B , C Two representative photos of the dorsal skin of WT and Krt32 KO mice ( n = 8 mice/group) treated by TNF, along with H&E staining showing lymphocytes and hair follicular plugging indicated by red and black arrows respectively. Results from another six mice are presented in Supplementary Fig. A, B. D Selected KEGG signal transduction pathways identified for significant DEGs (P < 0.05 and log 2 FC > 0.585) through RNA sequencing of between Krt32 WT and KO C57BL/6J mice ( n = 8 mice/group) treated by TNF. The statistical test was hypergeometric test, and the level of significance was set at a two-sided P < 0.05 without multiple comparisons. E Selected NF-κB pathway-associated genes are highlighted. Colored points denote P < 0.05, which means −log ( P ) > 1.30, dashed line), with red indicating upregulated genes (log 2 FC > 0.585) and blue indicating downregulated genes (log 2 FC < −0.585). The statistical test was Wald test, and the level of significance was set at a two-sided P < 0.05 without multiple comparisons. FC denotes fold change. F , G RT-qPCR analysis of Il1b and Il6 expression in the epidermis of Krt32 (−/−) mice ( n = 8) and WT mice ( n = 8) with pre- and post-TNF stimulation. Data are shown as means ± SEM in ( F ) and ( G ). P value was calculated using a two-sided unpaired Student’s t test. Representative immunohistochemical staining of the dorsal skin of Krt32 WT and KO mice treated with TNF for detecting IL-1β ( H ) Ki67 ( I ) and NEMO ( J ). Scale bar = 150 μm. Results from another six mice are presented in Supplementary Fig. C–E. K Western blot analysis of NEMO and p-p65 in the skin tissue lysates from Krt32 ( −/− ) mice ( n = 3) and WT mice ( n = 3) with TNF treatment. L Statistical analysis the expression of NEMO and p-p65 in ( K ). Data are shown as means ± SEM in ( L ). P value was calculated using a two-sided unpaired Student’s t test. M Western blot analysis of NEMO and p-p65 in epidermal cell lysates from a mixture of cells from four Krt32 WT and KO suckling mice with and without TNF treatment. One representative experiment from two independent experiments with similar results is shown in ( M ). Source data are provided as file.
Index in PubMed under a CC BY license. PMID: 39048559

Click image to see more details
The interaction of KRT32 with NEMO promotes NEMO degradation via K48-linked polyubiquitination modification and also inhibits the formation of the IKK complex. KRT32 expression level does not affect the transcription of IKBKG (the gene encoding NEMO) in Ker-CT cells. The mRNA level of NEMO in Ker-CT cells overexpressing KRT32 detected using RNA-seq ( A ) and in KRT32 knockdown cells detected by RT-qPCR analysis ( B ). Data are means ± SEM of three independent experiments in ( A ) and ( B ), and P value was calculated using a two-sided unpaired Student’s t test. C , D Immunoblotting of NEMO in Ker-CT cells with overexpressing KRT32 and knockdown with and without TNF treatment. E The impact of KRT32 wildtype and mutations overexpression on NEMO protein level in Ker-CT cells analyzed by Western blot. F Cycloheximide (CHX) chase assay to analyze the protein stability of NEMO in Ker-CT cells overexpressing KRT32. Cells were treated with 50 µg/ml CHX for indicated time. G The levels of NEMO were measured by western blotting with 5 μM MG132 in Ker-CT cells overexpressing KRT32 wildtype or negative control for 12 h. H Co-immunoprecipitation of HA-KRT32 and Flag-NEMO in HEK 293T cells, followed by detection of ubiquitin levels of NEMO by Western blotting. I Co-transfection of Flag-NEMO with HA-Ub-WT, HA-Ub-K48 or K48R (containing lysine at residue K48 or lysine to arginine mutation at residue K48) along with Myc-KRT32 in HEK 293 T cells, followed by immunoprecipitation and Western blotting analysis. J Immunoprecipitation of lysates with NEMO antibody from Ker-CT cells overexpressing KRT32 wildtype or mutations, and then detect the Ub-K48 modification of NEMO. PLA analysis in Ker-CT cells overexpression KRT32 wildtype and mutations to assess the interaction of Ub with NEMO ( K ) and IKKα with NEMO ( M ). Scale bars represent 10 μm. L , N Quantification of the number of PLA foci per cell detected in ( K ) and ( M ), separately. Each dot on the graph corresponds to a specific analyzed cell. Red bars represent the mean ± SEM from the indicated number ( N ) of cells. The number of cells analyzed per group varies as follows: N = 315, 302, 302, 310, 302, 315, 313, 311 in ( L ) and N = 243, 211, 214, 220, 217, 214, 205, 208 in ( N ), with each group consisting of three biological replicates. P value was calculated using a two-sided unpaired Student’s t test. O GST-NEMO (120-419aa) fusion protein was incubated with excess E. coli extracts containing His-KRT32 (wildtype or six mutants), His-IKKα, and His-IKKβ. GST complex was pulled down with glutathione-Sepharose beads, and the protein complexes were analyzed by western blotting. P Statistical analysis was performed on the binding ability of IKKα/β and NEMO with wildtype KRT32 and its mutations addition from tree-independent experiments of ( O ). Data shown as means ± SEM of three independent experiments in ( P ). P value was calculated using a two-sided unpaired Student’s t test. Q Immunoblotting assay of phosphorylated IKKα/β in Ker-CT cells overexpressing KRT32 wildtype and mutations. One representative experiment from two independent experiments with similar results is shown in ( C – G ) and ( J , Q ). One representative experiment from three independent experiments with similar results is shown in ( O ). Source data are provided as file.
Index in PubMed under a CC BY license. PMID: 39048559

Click image to see more details
KRT32 inhibits the activation of NF-κB signaling pathway. A Selected KEGG signal transduction pathway enrichment analysis with significant DEGs (FDR < 0.05 and log 2 FC < −0.585) through RNA sequencing of Ker-CT cells with KRT32 overexpression. The statistical test was hypergeometric test, and the level of significance was set at a two-sided P < 0.05 without multiple comparisons. B Volcano plot illustrating significant DEGs between KRT32 overexpression and negative control in Ker-CT cells. Upregulated genes were labelled by red dots with FDR < 1e −20 , log 2 FC > 0.585; and downregulated genes was labelled by blue dots with FDR < 1e −20, log 2 FC < −0.585. Selected NF-κB pathway-associated genes are highlighted. FC denotes fold change. The statistical test was Wald test and the level of significance was set at a two-sided FDR < 0.05 with multiple comparisons by Benjamini-Hochberg method. C NF-κB-dependent luciferase activation assay in HEK293T cells to analyze concentration-dependent role of KRT32 in NF-κB activation under the stimulation with TNF (20 ng/mL). D The phosphorylated p65 expression in KRT32 knockdown Ker-CT cells with and without TNF (20 ng/mL) treatment for the indicated time. E – G Detection of IL1β, IL-6, IL8 secretion in supernatant of KRT32 knockdown Ker-CT cells with or without TNF treatment by MSD assay. H – I The phosphorylated p65 expression in primary keratinocytes and Ker-CT cells with Flag-tagged KRT32 overexpression. J – L MSD assay detection of IL1β, IL-6, IL8 secretion of Ker-CT cells overexpressing KRT32. M The phosphorylated p65 expression in Ker-CT cells overexpressing Flag-tagged KRT32 wildtype and mutations. N , O MSD assay detection of IL1β, IL-8 secretion of Ker-CT cells overexpressing KRT32 wildtype and mutations with and without TNF treatment. P Analysis of luciferase activity after transfection with expression vectors encoding KRT32 wildtype and the variants (6 rare (MAF < 0.0005) and predicted to be damaging variants, 3 rare (MAF < 0.0005) and predicted to be benign variants, and 12 common (MAF > 0.0005) variants) in stimulated with TNF (20 ng/mL) for 12 h. Data are shown as means ± SEM of three independent biological repeats in ( C , E – G , J – L and N – P ). The P value was calculated using ordinary one-way ANOVA with Dunnett’s multiple comparisons test in ( C , P ); a two-sided unpaired Student’s t test in ( E – G , J – L ); and two-ANOVA with Dunnett’s multiple comparisons test in ( N ) and ( O ). Floating bars show the minimum, average, and maximum values within each group in ( P ). One representative experiment from two independent experiments with similar results is shown in ( D , H , I and M ). Source data are provided as file.
Index in PubMed under a CC BY license. PMID: 39048559

Click image to see more details
PF-127/hADSCs-Exos complex treatment inhibits inflammatory reaction. a Representative images of TNF-α immunostaining at 4, 7, and 10 days after treatment. Scale bar = 20 µm. b Quantification of TNF-α + IHC stained tissues. c Representative images illustrating IHC results of IL-6 at 4, 7, and 10 days after surgery. Scale bar = 20 µm. d Quantification of IL-6 + IHC stained tissues. e IHC images of wound sections stained with CD68 on days 4, 7, and 10 post-wounding. Scale bar = 20 µm. f Quantification of the number of CD68 positive cells in the wound area on days 4, 7, and 10. g IHC images of wound sections stained with CD206 at days 4, 7, and 10 post-wounding. Scale bar = 20 µm. h Quantification of the number of CD206 positive cells in the wound area on days 4, 7, and 10. In b, d, and f , data are shown as mean ± SEM; n = 6 for each group. * p < 0.05, ** p < 0.01, *** p < 0.001, and **** p < 0.0001 versus vehicle control group
Index in PubMed under a CC BY license. PMID: 35941707
Specific Publications For Anti-TNF alpha Antibody Picoband® (PA1079)
Loading publications
Recommended Resources
Here are featured tools and databases that you might find useful.
- Boster's Pathways Library
- Protein Databases
- Bioscience Research Protocol Resources
- Data Processing & Analysis Software
- Photo Editing Software
- Scientific Literature Resources
- Research Paper Management Tools
- Molecular Biology Software
- Primer Design Tools
- Bioinformatics Tools
- Phylogenetic Tree Analysis
Customer Reviews
Have you used Anti-TNF alpha Antibody Picoband®?
Share your experimental results or join a short interview to earn up to $1,000 in product credits or other rewards.
3 Reviews For Anti-TNF alpha Antibody Picoband®
Using the Anti-TNFα antibody (Cat# PA1079) in WB on rat alveolar bone, TNFα levels were highest in diabetes-induced bone defect models and were effectively suppressed by EGCG and PGC-1α treatments, with clear and correctly positioned bands.
Excellent
| SKU | PA1079 |
|---|---|
| Application | Western Blot |
| Sample | rat alveolar bone |
| Sample Processing Description | ① Normal mouse hippocampal tissue, ② Hippocampal tissue from Alzheimer’s disease model mouse, ③ Hippocampal tissue from Alzheimer’s disease model mouse treated with a self-developed drug. Total protein was extracted from all samples. |
| Other Reagents | RIPA lysis buffer, Protease inhibitor, Running buffer, Transfer buffer, Blocking buffer |
| Primary Antibody | TNF alpha Antibody Picoband® |
| Primary Incubation | 1:1000, overnight at 4 ℃ |
| Secondary Antibody | HRP Conjugated AffiniPure Goat Anti-Rabbit IgG (H+L) (BA1054) |
| Secondary Incubation | 1:10000, 1 h in RT |
| Detection | Substrate: ECL substrate, Image system: ChemiDoc MP |
| Results Summary | TNFα is a typical pro-inflammatory factor that enhances inflammation, inhibits osteogenesis, and promotes bone resorption in bone defect models. The experimental results show that in rat alveolar bone tissue, TNFα levels increase in the following order: ① N: normal rats’ alveolar bone, ② D-EGC: EGCG-treated diabetic bone defect model, ③ D-PGC: PGC-1α-treated diabetic bone defect model, ④ D: diabetic bone defect model, indicating that both EGCG and PGC-1α can suppress TNFα expression. |
Yurou Chen, Shanxi Medical University, Stomatology Hospital
Verified customer
Submitted 2026-03-30
TNFα Antibody (PA1079) shows clear, specific bands in mouse brain tissues by WB, with elevated expression in Alzheimer’s disease models and reduced levels after treatment, consistent with expected results.
Excellent
| SKU | PA1079 |
|---|---|
| Application | Western Blot |
| Sample | mouse brain tissue |
| Sample Processing Description | ① Normal mouse hippocampal tissue, ② Hippocampal tissue from Alzheimer’s disease model mouse, ③ Hippocampal tissue from Alzheimer’s disease model mouse treated with a self-developed drug. Total protein was extracted from all samples. |
| Other Reagents | RIPA lysis buffer, Protease inhibitor, Running buffer, Transfer buffer, Blocking buffer |
| Primary Antibody | TNF alpha Antibody Picoband® |
| Primary Incubation | 1:1000, overnight at 4 ℃ |
| Secondary Antibody | HRP Conjugated AffiniPure Goat Anti-Rabbit IgG (H+L) (BA1054) |
| Secondary Incubation | 1:10000, 1 h in RT |
| Detection | Substrate: ECL substrate, Image system: ChemiDoc MP |
| Results Summary | TNFα (tumor necrosis factor-alpha) is a key pro-inflammatory cytokine in the immune system, playing an essential role in normal immune defense and tissue homeostasis, with levels typically rising rapidly after inflammation. The results showed that TNFα expression was significantly increased in the brains of Alzheimer’s disease model mice and decreased after treatment. |
Huili Yin, Shandong First Medical University
Verified customer
Submitted 2026-03-27
This antibody shows excellent consistency and reproducibility across batches, ensuring reliable and stable experimental results. Its performance remains consistent across different experiments, providing strong technical support for our research.
Excellent
| SKU | PA1079 |
|---|---|
| Application | Western Blot |
| Sample | Mouse lung tissue |
| Sample Processing Description | Tissue samples were directly lysed in RIPA buffer, mixed with loading buffer at the appropriate ratio, and denatured by heating at 98 °C. Load 20 µL of protein sample per lane onto SDS-PAGE. |
| Primary Incubation | The membrane was incubated with TNF-α primary antibodies (1:1000) overnight at 4 °C. |
| Secondary Antibody | HRP-conjugated Goat Anti-Rabbit IgG Secondary Antibody |
| Secondary Incubation | Incubate at room temperature for 1 hour |
| Other Reagents used | 5% Non-fat milk |
| Detection | Signal was developed using ECL substrate on an ChemiDoc MP system. |
| Results Summary | This antibody shows excellent consistency and reproducibility across batches, ensuring reliable and stable experimental results. Its performance remains consistent across different experiments, providing strong technical support for our research. |
Jiahui Yan, College of Chemistry and Chemical Engineering, Ocean University of China
Verified customer
Submitted 2025-09-25
Customer Q&As
Have a question?
Find answers in Q&As, reviews.
Can't find your answer?
Submit your question
16 Customer Q&As for Anti-TNF alpha Antibody Picoband®
Question
We are currently using anti-TNF alpha antibody PA1079 for rat tissue, and we are happy with the IF results. The species of reactivity given in the datasheet says human, mouse, rat. Is it likely that the antibody can work on bovine tissues as well?
Verified Customer
Verified customer
Asked: 2020-05-01
Answer
The anti-TNF alpha antibody (PA1079) has not been validated for cross reactivity specifically with bovine tissues, though there is a good chance of cross reactivity. We have an innovator award program that if you test this antibody and show it works in bovine you can get your next antibody for free. Please contact me if I can help you with anything.
Boster Scientific Support
Answered: 2020-05-01
Question
I see that the anti-TNF alpha antibody PA1079 works with IF, what is the protocol used to produce the result images on the product page?
Verified Customer
Verified customer
Asked: 2020-04-17
Answer
You can find protocols for IF on the "support/technical resources" section of our navigation menu. If you have any further questions, please send an email to support@bosterbio.com
Boster Scientific Support
Answered: 2020-04-17
Question
Do you have a BSA free version of anti-TNF alpha antibody PA1079 available?
Verified Customer
Verified customer
Asked: 2020-02-25
Answer
Thanks for your recent telephone inquiry. I can confirm that some lots of this anti-TNF alpha antibody PA1079 are BSA free. For now, these lots are available and we can make a BSA free formula for you free of charge. It will take 3 extra days to prepare. If you require this antibody BSA free again in future, please do not hesitate to contact me and I will be pleased to check which lots we have in stock that are BSA free.
Boster Scientific Support
Answered: 2020-02-25
Question
My lab would like using your anti-TNF alpha antibody for positive regulation of membrane protein ectodomain proteolysis studies. Has this antibody been tested with western blotting on a431 whole cell lysates? We would like to see some validation images before ordering.
Verified Customer
Verified customer
Asked: 2019-12-23
Answer
We appreciate your inquiry. This PA1079 anti-TNF alpha antibody is tested on human placenta tissue, hela whole cell lysates, a431 whole cell lysates, a549 whole cell lysates, k562 whole cell lysates. It is guaranteed to work for IF, IHC-P, ICC, WB in human, mouse, rat. Our Boster guarantee will cover your intended experiment even if the sample type has not been be directly tested.
Boster Scientific Support
Answered: 2019-12-23
Question
Our lab want to know about to test anti-TNF alpha antibody PA1079 on mouse prostatic carcinoma for research purposes, then I may be interested in using anti-TNF alpha antibody PA1079 for diagnostic purposes as well. Is the antibody suitable for diagnostic purposes?
W. Wu
Verified customer
Asked: 2019-11-18
Answer
The products we sell, including anti-TNF alpha antibody PA1079, are only intended for research use. They would not be suitable for use in diagnostic work. If you have the means to develop a product into diagnostic use, and are interested in collaborating with us and develop our product into an IVD product, please contact us for more discussions.
Boster Scientific Support
Answered: 2019-11-18
Question
Is a blocking peptide available for product anti-TNF alpha antibody (PA1079)?
Verified Customer
Verified customer
Asked: 2019-06-13
Answer
We do provide the blocking peptide for product anti-TNF alpha antibody (PA1079). If you would like to place an order for it please contact support@bosterbio.com and make a special request.
Boster Scientific Support
Answered: 2019-06-13
Question
See attached the WB image, lot number and protocol we used for prostatic carcinoma using anti-TNF alpha antibody PA1079. Please let me know if you require anything else.
R. Thomas
Verified customer
Asked: 2019-06-12
Answer
Thank you very much for the data. Our lab team are working to resolve this as quickly as possible, and we appreciate your patience and understanding! You have provided everything we needed. Please let me know if there is anything you need in the meantime.
Boster Scientific Support
Answered: 2019-06-12
Question
We ordered your anti-TNF alpha antibody for IHC-P on leukocyte a few years ago. I am using rat, and We are going to use the antibody for WB next. I am interested in examining leukocyte as well as prostatic carcinoma in our next experiment. Could you please give me some suggestion on which antibody would work the best for WB?
J. Krishna
Verified customer
Asked: 2019-05-31
Answer
I viewed the website and datasheets of our anti-TNF alpha antibody and it appears that PA1079 has been tested on rat in both IHC-P and WB. Thus PA1079 should work for your application. Our Boster satisfaction guarantee will cover this product for WB in rat even if the specific tissue type has not been validated. We do have a comprehensive range of products for WB detection and you can check out our website bosterbio.com to find out more information about them.
Boster Scientific Support
Answered: 2019-05-31
Question
My question regarding product PA1079, anti-TNF alpha antibody. I was wondering if it would be possible to conjugate this antibody with biotin. I would need it to be without BSA or sodium azide. I am planning on using a buffer exchange of sodium azide with PBS only. Would there be problems for me to conjugate the antibody and store it in -20 degrees in small aliquots?
Verified Customer
Verified customer
Asked: 2018-08-06
Answer
We do not recommend storing this antibody with PBS buffer only in -20 degrees. If you want to store it in -20 degrees it is best to add some cryoprotectant like glycerol. If you want carrier free PA1079 anti-TNF alpha antibody, we can provide it to you in a special formula with trehalose and/or glycerol. These molecules will not interfere with conjugation chemistry and provide a good level of protection for the antibody from degradation. Please be sure to specify this in your purchase order.
Boster Scientific Support
Answered: 2018-08-06
Question
Our lab were well pleased with the WB result of your anti-TNF alpha antibody. However we have observed positive staining in blood cell membrane using this antibody. Is that expected? Could you tell me where is TNF supposed to be expressed?
Verified Customer
Verified customer
Asked: 2017-07-24
Answer
From literature, blood does express TNF. Generally TNF expresses in cell membrane. Regarding which tissues have TNF expression, here are a few articles citing expression in various tissues:
Blood, Pubmed ID: 15489334
Prostatic carcinoma, Pubmed ID: 8597870, 10205166
Boster Scientific Support
Answered: 2017-07-24
Question
We have observed staining in human leukocyte. Are there any suggestions? Is anti-TNF alpha antibody supposed to stain leukocyte positively?
Verified Customer
Verified customer
Asked: 2017-07-19
Answer
According to literature leukocyte does express TNF. According to Uniprot.org, TNF is expressed in leukocyte, blood, prostatic carcinoma, among other tissues. Regarding which tissues have TNF expression, here are a few articles citing expression in various tissues:
Blood, Pubmed ID: 15489334
Prostatic carcinoma, Pubmed ID: 8597870, 10205166
Boster Scientific Support
Answered: 2017-07-19
Question
I was wanting to use your anti-TNF alpha antibody for IF for mouse prostatic carcinoma on frozen tissues, but I want to know if it has been tested for this particular application. Has this antibody been tested and is this antibody a good choice for mouse prostatic carcinoma identification?
L. Thomas
Verified customer
Asked: 2016-12-01
Answer
It shows on the product datasheet, PA1079 anti-TNF alpha antibody has been validated for IF, IHC-P, ICC, WB on human, mouse, rat tissues. We have an innovator award program that if you test this antibody and show it works in mouse prostatic carcinoma in IHC-frozen, you can get your next antibody for free.
Boster Scientific Support
Answered: 2016-12-01
Question
Is this PA1079 anti-TNF alpha antibody reactive to the isotypes of TNF?
M. Edwards
Verified customer
Asked: 2015-06-18
Answer
The immunogen of PA1079 anti-TNF alpha antibody is A synthetic peptide corresponding to a sequence at the C-terminus of human TNF(201-233aa QLEKGDRLSAEINRPDYLDFAESGQVYFGIIAL), different from the related mouse sequence by five amino acids, and rat sequence by seven amino acids. Could you tell me which isotype you are interested in so I can help see if the immunogen is part of this isotype?
Boster Scientific Support
Answered: 2015-06-18
Question
Thank you for helping with my inquiry over the phone. Here are the WB image, lot number and protocol we used for prostatic carcinoma using anti-TNF alpha antibody PA1079. Let me know if you need anything else.
A. Collins
Verified customer
Asked: 2015-02-18
Answer
We appreciate the data. You have provided everything we needed. Our lab team are working to resolve your inquiry as quickly as possible, and we appreciate your patience and understanding! Please let me know if there is anything you need in the meantime.
Boster Scientific Support
Answered: 2015-02-18
Question
Does anti-TNF alpha antibody PA1079 work for IF with prostatic carcinoma?
E. Anderson
Verified customer
Asked: 2014-03-05
Answer
According to the expression profile of prostatic carcinoma, TNF is highly expressed in prostatic carcinoma. So, it is likely that anti-TNF alpha antibody PA1079 will work for IF with prostatic carcinoma.
Boster Scientific Support
Answered: 2014-03-05
Question
Would PA1079 anti-TNF alpha antibody work on parafin embedded sections? If so, which fixation method do you recommend we use (PFA, paraformaldehyde, other)?
K. Collins
Verified customer
Asked: 2013-07-12
Answer
It shows on the product datasheet, PA1079 anti-TNF alpha antibody as been validated on IF. It is best to use PFA for fixation because it has better tissue penetration ability. PFA needs to be prepared fresh before use. Long term stored PFA turns into formalin, as the PFA molecules congregate and become formalin.
Boster Scientific Support
Answered: 2013-07-12
