This website uses cookies to ensure you get the best experience on our website.
- Table of Contents
Flow cytometry is a cornerstone technique for dissecting heterogeneous cell populations based on physical and biochemical properties. Central to its accuracy is gating—a systematic process to isolate target cell subsets while excluding noise from debris, dead cells, or technical artifacts. This guide integrates fundamental flow cytometry principles, step-by-step workflows, and advanced strategies to empower researchers in designing robust gating protocols.
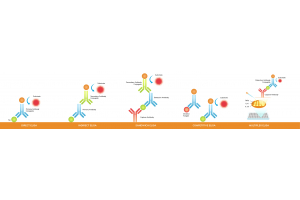
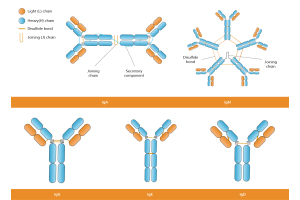
For experiments that depend on newly engineered binding reagents, researchers may also benefit from understanding cell-free antibody synthesis, which enables rapid in vitro production and screening of antibody formats before downstream validation in applications such as flow cytometry.
The first principle is signal-based selection. When cells pass through the flow cytometer, they scatter light and emit fluorescence signals. The forward scatter (FSC) signal is directly proportional to the size of the cell, while the side scatter (SSC) provides information about the cell’s granularity or internal complexity. In addition to these light scattering signals, fluorescence signals are detected when cells are tagged with fluorescent markers. These markers can indicate the presence of specific proteins such as CD3 or CD4, or they can signal functional states, for example, using Propidium Iodide (PI) to detect cell death or measure DNA content.
Building on the foundation of signal-based selection, gating is typically performed in a logical, hierarchical manner. This sequential approach helps refine the cell population step by step to focus on the cells of interest. The first step is to exclude debris and dead cells, which can be identified by their low FSC and SSC values, or by their high fluorescence when stained with viability dyes like PI or 7-AAD. Removing these unwanted events ensures that the subsequent analysis is based on viable, intact cells.
The next step involves removing doublets or cell aggregates. Doublets can distort data by falsely increasing the apparent number of events, and they are typically identified by comparing signals such as FSC-A (area) to FSC-W (width). Single cells tend to fall along a linear relationship in these plots, while doublets deviate from this pattern. Isolating the single-cell population is crucial for ensuring accurate and reproducible results.
Finally, the refined population is further analyzed using fluorescence markers to define target phenotypes. By setting thresholds based on positive and negative controls, researchers can accurately segregate subpopulations, such as identifying specific T-cell subsets (e.g., CD3+CD4+ cells) among the broader population. This hierarchical gating strategy, which combines the initial physical parameters with fluorescence-based markers, allows for a precise and systematic analysis of complex cell mixtures, ultimately enhancing the reliability of flow cytometry data.

The first critical step in a flow cytometry experiment is to eliminate debris and dead cells from your analysis. This is typically achieved by plotting Forward Scatter Area (FSC-A) against Side Scatter Area (SSC-A). In this scatter plot, you draw a gate—commonly labeled as Gate P1—around the main cell population, deliberately excluding events with low FSC and SSC signals that represent debris. When performing viability assays, fluorescent dyes like Propidium Iodide (PI) or 7-AAD are used to mark dead cells, which exhibit high fluorescence, so that these can be gated out. It’s also beneficial to validate your gate placement using the software’s built-in tools (for example, FlowJo’s "Gate Inspector"). Adjusting the axes to include all cells with proper margins ensures that edge artifacts are minimized.
After the initial exclusion of debris and dead cells, the next step is to focus on single cells, thereby removing any cell doublets or aggregates that can skew the data. This is done by plotting FSC-A against FSC-W (or alternatively, FSC-H vs. FSC-W). Single cells display a linear relationship between the total signal (FSC-A) and the signal width (FSC-W). In contrast, doublets or clumped cells appear as outliers due to their increased width. You should draw Gate P2 around the linear cluster representing single cells. For experiments that require DNA analysis, such as cell cycle studies, a plot of PI-W versus PI-A can be used for a more refined exclusion of aggregates. Reporter systems such as HEK293 reporter cell lines are also frequently used to validate signaling pathway activation within gated populations.
The final step involves delineating the target cell population using specific fluorescence markers. For instance, if you are analyzing T cell subsets, you might use a fluorescence scatter plot of FITC versus PE to differentiate between markers such as CD3 and CD4. Begin by setting the thresholds using both unstained (negative control) and single-stained (positive control) samples to establish accurate boundaries. You can use quadrant or contour gating to achieve clear separation; for dense samples, switching to a contour plot often helps to align quadrant lines with natural gaps between cell populations. Additionally, employing Fluorescence Minus One (FMO) controls in multicolor experiments is essential to resolve any ambiguous populations, ensuring that the defined target phenotype is both accurate and reproducible.
Together, these
steps—excluding debris and dead cells, selecting single cells, and defining the
target phenotype—form the foundation of an effective gating strategy in flow
cytometry, leading to reliable and meaningful results.

• Voltage Adjustment:
Fine-tune photomultiplier tube (PMT) voltages to position cell populations within the center of the plot. For example, adjust voltages to clearly distinguish G0/G1 phase cells in DNA cell cycle analysis.
• Compensation:
Correct spectral overlap between fluorochromes using single-stained controls. For instance, subtract FITC spillover into the PE channel to ensure accurate signal detection.
• Density Plots:
Best for high-density samples, where clusters of cells can be visualized as heatmaps, making it easier to distinguish rare populations.
• Color Overlays:
Compare control vs. treated samples by overlaying data in contrasting colors (e.g., blue vs. red) to highlight shifts in fluorescence intensity.
• Histogram Stacking:
Stack histograms vertically (control on top) to directly compare fluorescence distribution between experimental conditions.
• Boolean Logic:
Combine multiple gates using logical operators (e.g., **"CD3+ AND CD4+ AND NOT PI+"**) to isolate highly specific subsets while excluding dead or unwanted cells.
• Backgating:
Validate gating accuracy by overlaying gated populations (e.g., CD4+ T cells) onto FSC vs. SSC plots to confirm alignment with expected size and granularity.

Objective: Quantify cells in G0/G1, S, and G2/M phases based on DNA content.
Key Parameters:
• PI-A (Propidium Iodide-Area): Measures total DNA content.
• PI-W (Propidium Iodide-Width): Discriminates cell doublets from single cells.
Workflow:
1. Debris Exclusion:
• Gate on intact cells using FSC (size) vs. SSC (granularity) to exclude debris and apoptotic bodies.
• Example: Use a polygon gate to capture the main cell population while omitting low-FSC/SSC events.
2. Doublet Exclusion:
• Plot PI-W vs. PI-A to eliminate cell doublets, which show higher PI-W values than single cells.
• Tip: Adjust voltage to ensure singlets cluster diagonally (PI-W proportional to PI-A).
3. DNA Content Analysis:
• Analyze the PI-A histogram to quantify phases:
o G0/G1: Single peak (2N DNA).
o S phase: Intermediate DNA content (between 2N and 4N).
o G2/M: Second peak (4N DNA).
• Example: After drug treatment, observe S-phase accumulation (e.g., hydroxyurea-induced arrest).
Objective: Identify and quantify immune cell subsets (e.g., T cells, B cells, NK cells).
Key Markers:
• CD45 vs. SSC: Gate leukocytes (CD45+) while excluding red blood cells (RBCs) and debris.
• Lineage-specific markers:
o T cells: CD3, CD4, CD8.
o B cells: CD19, CD20.
Workflow:
1. Leukocyte Gating:
• Use CD45 vs. SSC to isolate all leukocytes. CD45 is expressed on all nucleated hematopoietic cells.
• Note: Adjust compensation to avoid spillover from bright markers (e.g., CD45-FITC into PE channels).
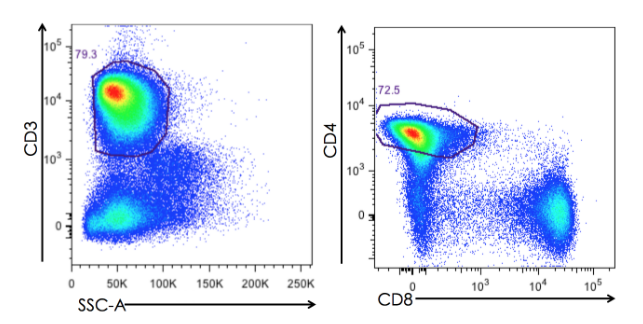
2. Subset Identification:
• T cells: Gate CD3+ cells.
• Helper vs. Cytotoxic T cells: Subdivide into CD4+ (helper) and CD8+ (cytotoxic) populations.
• Example: In HIV studies, monitor CD4+/CD8+ ratio (normal ~2:1; HIV often reduces CD4+).
3. Exclusion Gates:
• Use **"NOT" gates** to exclude dead cells (e.g., PI+) or irrelevant lineages (e.g., CD19- for T-cell analysis).
Objective: Distinguish live, apoptotic, and dead cells.
Key Markers:
• Viability: PI (propidium iodide) or 7-AAD (7-aminoactinomycin D).
• Apoptosis: Annexin V (binds phosphatidylserine exposed on apoptotic cells).
Workflow:
1. Debris Exclusion:
• Gate on intact cells using FSC vs. SSC (similar to cell cycle analysis).
2. Viability Gating:
• Live cells: PI-/7-AAD- (viable cells exclude these dyes).
• Dead cells: PI+/7-AAD+ (membrane-compromised cells).
3. Apoptosis Staging:
• Plot Annexin V vs. PI:
o Early apoptotic: Annexin V+/PI- (intact membrane, PS externalized).
o Late apoptotic/necrotic: Annexin V+/PI+ (membrane permeabilized).
• Example: After chemotherapy treatment, quantify early apoptosis (Annexin V+/PI-) as a marker of drug efficacy.
Critical Controls:
• Include unstained cells to define autofluorescence.
• Use calcium-dependent Annexin V binding: Ensure buffer contains Ca²⁺ (required for PS binding).
叠加直方图.png)
| Error | Solution |
|---|---|
| Over-Gating leading to cell loss | Use backgating to verify population distribution |
| Fluorescence Overlap causing false positives | Recalibrate compensation with single-stained controls |
| Doublets not expanded | Strictly apply FSC-A vs. FSC-W or PI-W vs. PI-A gating |
| Inconsistent Gating across samples | Use FMO controls and align gates using biological references (e.g., lymphocytes in blood) |