This website uses cookies to ensure you get the best experience on our website.


- Table of Contents
Should the brightest dyes go to all the most important markers? No.
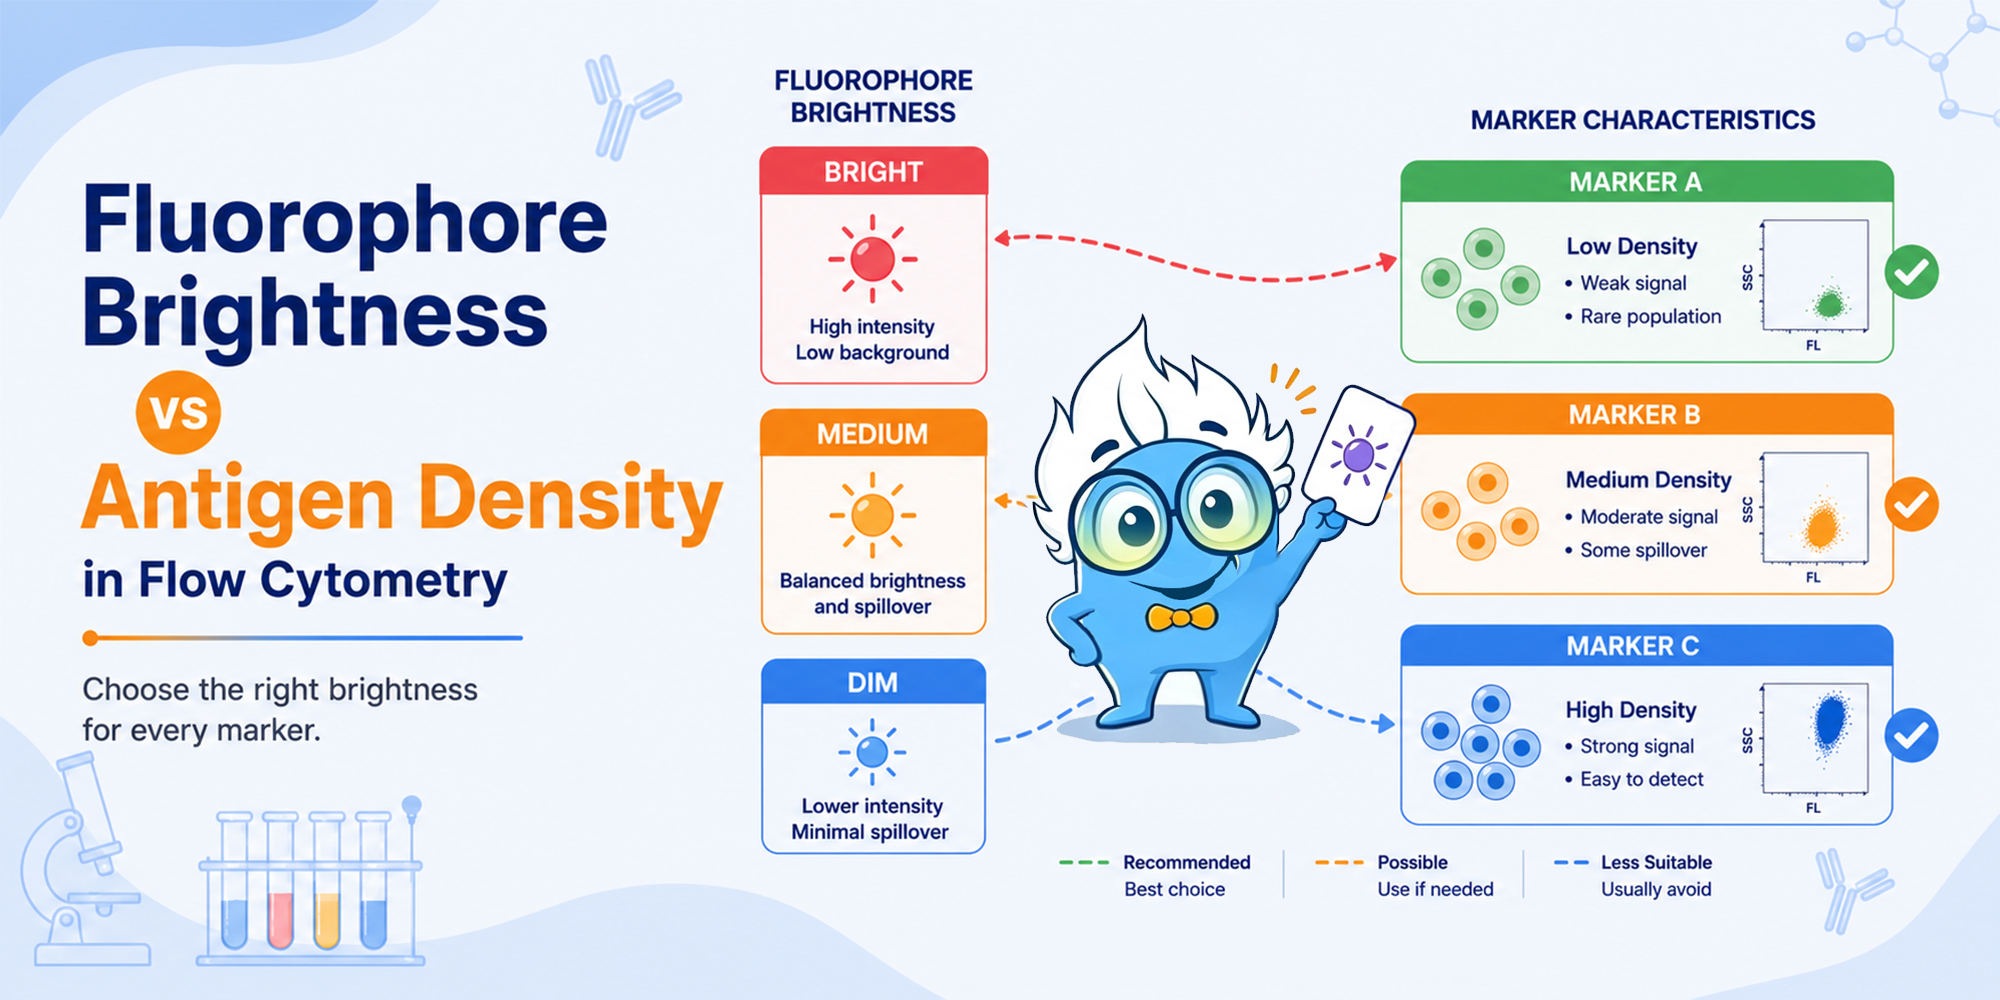
When a multicolor panel is difficult to resolve, the instinct is often to make the important markers brighter. But fluorescence intensity is not the same as useful resolution. A highly expressed lineage marker may already separate cleanly on a moderate fluorophore, while a low-density activation marker can remain buried in background even when the antibody itself is good.
Brightness is therefore a limited panel-design resource. Reserve the brightest conjugates for antigens that actually need the extra separation, place abundant antigens on dimmer dyes when possible, and keep strong spreading sources away from detectors used by dim markers. This simple reallocation can recover a population without changing the cells, the antibody clone, or the instrument.
That pairing rule is only the starting point. Detector linear range, titration, autofluorescence, instrument configuration, compensation or unmixing, and event counts can all determine whether a theoretically good dye assignment works in practice.
The goal of a flow cytometry panel is not to maximize the mean fluorescence intensity of every marker. The goal is to separate the populations that matter. Resolution improves when the distance between positive and negative distributions is large relative to the width of those distributions. That is why practical panel-design metrics emphasize separation relative to spread rather than raw intensity alone (Maecker et al., 2004; Bigos et al., 2007).
Fluorophore brightness describes the detected signal contributed by a bound antibody under a specific optical configuration. It depends on the dye, laser excitation, emission filters, detector sensitivity, and degree of labeling. In other words, brightness is not a universal ranking that can be copied unchanged from one cytometer to another.
In practice, the better question is not "Which dye is brightest?" but "Which conjugate gives this marker the best separation on this instrument?" Maecker et al. (2004) used stain index to compare fluorochrome conjugates, while Bigos et al. (2007) described a related separation index. For the underlying optics, see the flow cytometry principle walkthrough.
Approximate Fluorophore Brightness Categories
Because brightness depends on the instrument, treat these tiers as a starting point and confirm performance with stain index or separation index on your own cytometer.
| Relative brightness | Common examples | Often suited to |
|---|---|---|
| Very bright | PE, APC, BV421 | Low-density markers and dim populations that must be resolved |
| Bright | Alexa Fluor 647, PE-Cy7, BV605 | Low- to moderate-density markers |
| Moderate | Alexa Fluor 488, PerCP-Cy5.5 | Moderately expressed markers |
| Dim | FITC, PerCP, Alexa Fluor 700 | Highly expressed markers with clear separation |
Brightness should be weighed together with antigen density, spillover spreading, and panel size. Putting a very bright dye on an abundant marker can widen the spread in neighboring detectors and hide the dim populations those detectors are meant to resolve.
Tandem dyes such as PE-Cy7 may require additional optimization because their performance can be affected by tandem stability, fixation conditions, and instrument settings.
Antigen density is the number of antibody-binding sites presented by a cell. Within one panel, some targets may be abundant while others are close to the detection limit. The measured value is not purely biological: antibody valency, avidity, clone, and conjugation can affect the apparent density (Davis et al., 1998). Published densities are therefore best treated as ranked expectations rather than fixed constants for every sample and assay.
Biological importance tells you which marker matters to the question. It does not tell you how difficult that marker is to detect. A highly expressed lineage antigen may resolve on many conjugates, so putting the brightest dye there can spend scarce resolution where it was never needed. Meanwhile, a dim marker carrying the key biological result may be left in a noisier channel. High-parameter panel design is therefore an engineering problem, not a ranking of which markers are most interesting (Perfetto et al., 2004).
Start by ranking markers according to expected density, then modify that ranking according to how the population is distributed. A clean bimodal marker can tolerate a less favorable channel. A continuous marker, a small shift in expression, or a dim positive population usually needs more resolution. This brightness-versus-density matching step is one of the highest-yield decisions made before staining begins (Mahnke et al., 2007).
A simple example shows why this matters:
| Marker | Typical detection challenge | Common assignment mistake | Better use of brightness |
|---|---|---|---|
| CD45 | Usually abundant | Give it a top-brightness dye because it is biologically important | Use a moderate dye if separation is already strong |
| PD-1 | Often lower or variable expression | Place it on a convenient dimmer channel | Reserve a brighter, cleaner channel when PD-1 resolution is important |
| Intracellular cytokine | Often limited signal after stimulation and processing | Choose mainly by reagent availability | Prioritize sensitivity and spreading relationships |
The exact assignment still depends on the sample, clone, instrument, and panel. The point is not that one marker always belongs on one dye, but that brightness should be allocated according to detection difficulty rather than biological importance alone.
The cost is not only that a bright dye has been "wasted." Spillover spreading increases as the spilling signal becomes stronger, so an abundant antigen on a very bright conjugate can become a large spreading source and degrade detectors used by dim markers (Nguyen et al., 2013). Extremely strong signals can also exceed the detector's linear range, where downstream correction is no longer based on proportional values.
Each detector has a finite linear range. Set the signal too low and dim positives collapse into background; set it too high and bright events run off scale. Instrument setup therefore precedes dye assignment. A reproducible flow cytometry protocol helps keep gains and acquisition conditions consistent.
The second budget is spread. Compensation and spectral unmixing correct average signal overlap, but the uncertainty associated with spilled photons remains and broadens the receiving channel (Roederer, 2001). Nguyen et al. (2013) quantified this behavior as spillover spreading and showed why the strength of the spilling signal matters during panel design.
As an illustration, imagine a dim population that sits about four standard deviations above background in a clean channel. If a bright neighboring signal roughly doubles the background spread, the same population may sit only about two standard deviations clear and appear as a shoulder rather than a distinct peak. These numbers are illustrative, not measured values. Moving the spreading source to a less sensitive relationship, or using a dimmer conjugate for the abundant marker, can restore separation without changing the biology.
A common misconception is that correct compensation removes all consequences of spectral overlap. It does not. Compensation subtracts the average spillover between detectors, but photon-counting variance remains. A correctly compensated plot can therefore still show a wider negative distribution under a bright neighboring signal (Roederer, 2001). The compensation matrix must also be built from appropriate single-stained controls (Roederer, 2011).
Other sources of spread can mimic a dye-pairing problem. Autofluorescence varies by cell type, tissue, and preparation and is often strongest at shorter wavelengths (Hulspas et al., 2009; Roederer, 2016). Off-scale events can also distort spillover estimates. A structured flow cytometry troubleshooting sequence helps separate a staining problem from an instrument or panel-design problem.
Use antigen density as the starting axis, then apply instrument and panel constraints in a fixed order:
| Question | Fluorophore Brightness | Antigen Density |
|---|---|---|
| What does it describe? | Signal per bound antibody in a specific detector and optical configuration. | Binding sites available per cell for a given epitope. |
| What sets it? | Dye properties, laser excitation, emission filter, detector sensitivity, and degree of labeling. | Cell type, activation and differentiation state, plus clone/conjugation effects on the measured value (Davis et al., 1998). |
| How is it evaluated? | Stain index or separation index from a titrated single stain on the instrument (Maecker et al., 2004; Bigos et al., 2007). | Calibration approaches using beads with known binding capacities, interpreted in the context of the assay. |
| What question does it answer? | Which conjugate gives this marker the most useful separation? | How much detection sensitivity does this marker likely require? |
A titration series can be incorporated into your flow cytometry optimization workflow, while matched isotype control antibodies can support assessment of nonspecific background where appropriate.
For antibody-level specificity evidence, see Boster's knockout and knockdown validated antibodies.
The brightest fluorophore is not a prize for the most interesting marker. It is a limited resource that should be spent where resolution is scarce. Rank markers by expected antigen density and population shape, reserve the best conjugates for dim or difficult targets, and keep strong spreading sources away from the detectors those targets depend on.
Then finish the job that brightness matching cannot do: stay within detector linear range, titrate on the actual sample, characterize autofluorescence, use the correct controls, respect the instrument configuration, and collect enough events. A good dye assignment can improve a panel before a tube is stained; a bad one is often discovered only after the experiment has already been run.
None of this survives an unreliable reagent. Well-validated flow cytometry antibodies, appropriately characterized conjugates, and published antibody validation evidence help ensure that measured separation reflects biology rather than staining artifacts.