This website uses cookies to ensure you get the best experience on our website.


- Table of Contents
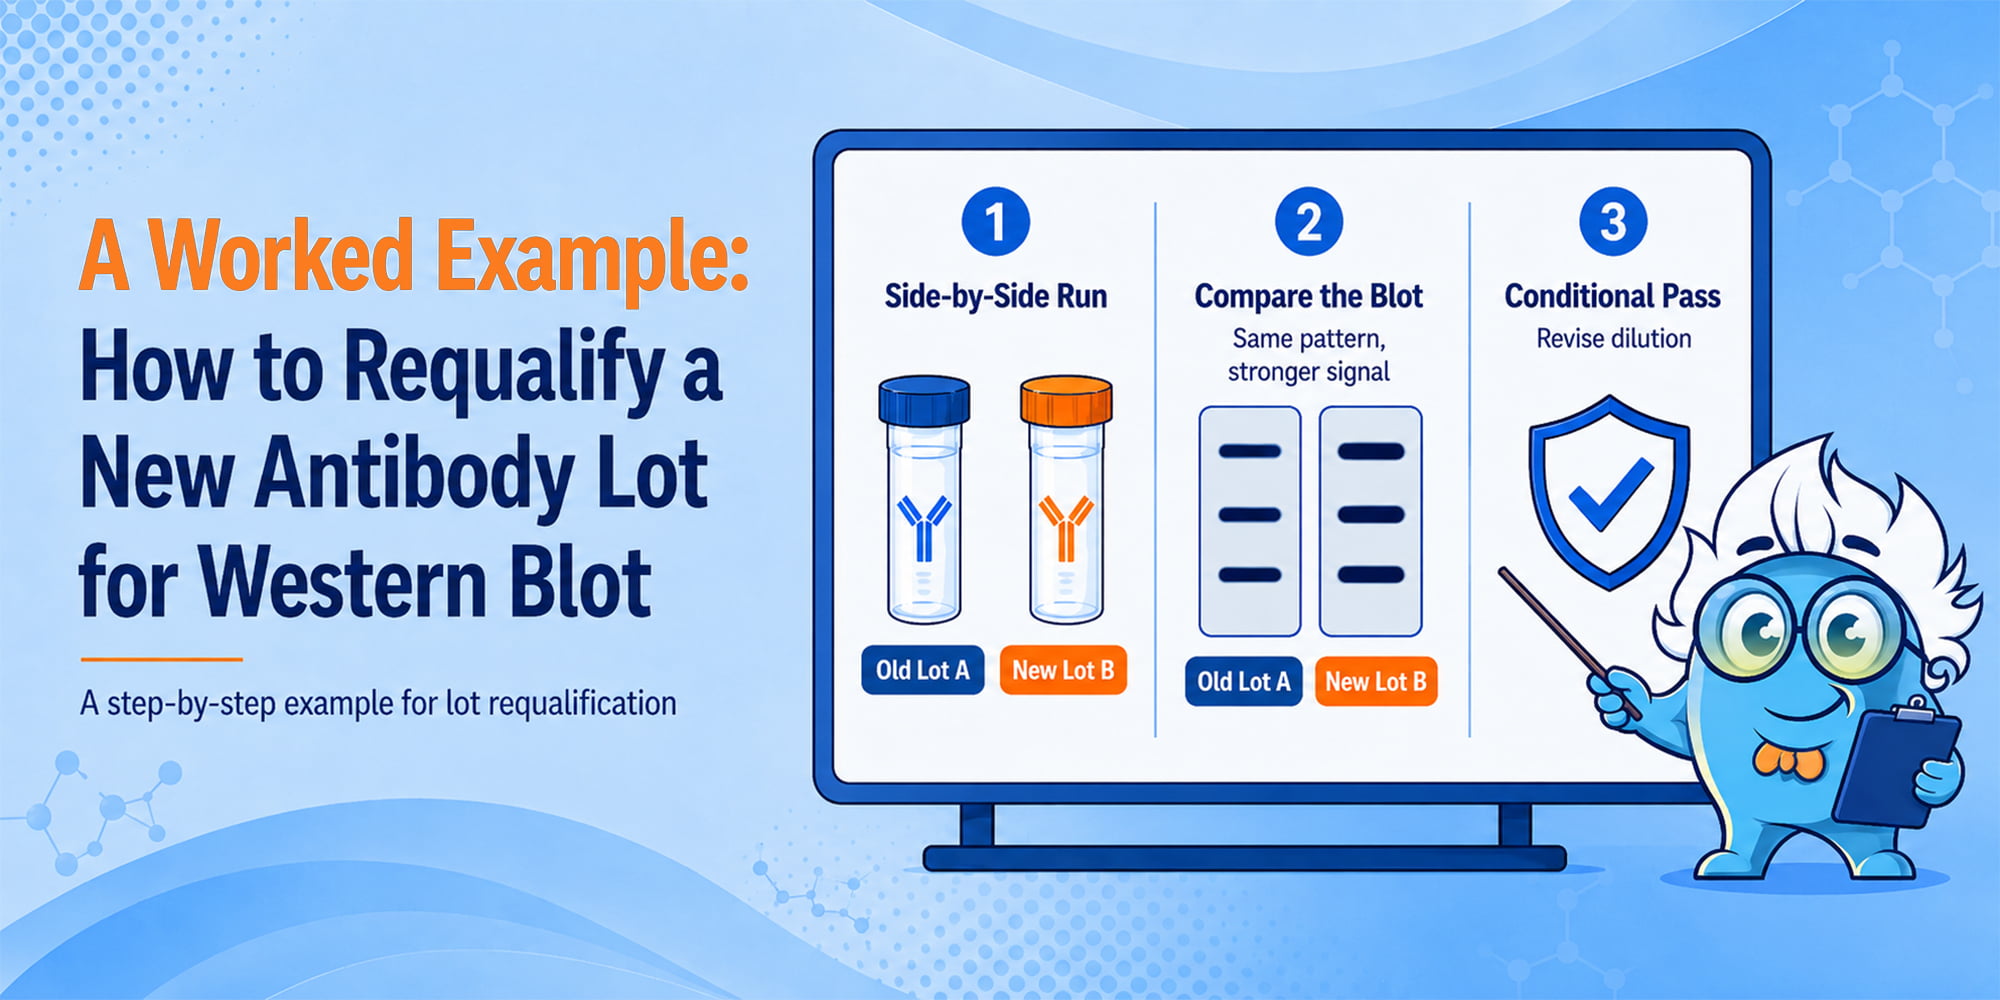
A practical old-versus-new lot comparison that moves from experimental setup to a documented pass, conditional pass, or fail decision.
ANTIBODY LOT BRIDGING SERIES
Western Blot Worked Example — Use this article to see the cross-application requalification framework applied to one semi-quantitative Western blot case.
Estimated reading time: 10–11 minutes
An antibody lot change can look harmless on paper. The catalog number, clone, host species, and recommended dilution may all stay the same. On the membrane, however, the replacement lot may produce a stronger target band, more haze, a new off-target band, or a weaker signal in low-expression samples.
Those differences matter most when the new data will be compared with results generated earlier in the study. A technical shift introduced by the antibody lot can be mistaken for a biological effect, particularly in longitudinal or semi-quantitative work.
This article follows one illustrative Western blot case from setup through approval. It assumes that the laboratory already understands the broader risk-based principles of lot requalification. For that cross-application framework, see the complete antibody lot-to-lot bridging guide.
Case
A laboratory uses a primary antibody to compare a 65 kDa target across samples collected during a 12-month study. The current qualified lot (Lot A) is nearly depleted. The replacement lot (Lot B) must be introduced without breaking data continuity.
The assay is semi-quantitative, so seeing a band is not enough. Lot B must preserve the features that support the study's interpretation.
This is the first point at which the case becomes specific to Western blot. The question is not whether the two images look identical; it is whether Lot B preserves the information the blot is being used to measure.
A single strong positive lysate is a weak challenge for a replacement lot. Even an antibody with reduced sensitivity may still produce a dark band when the target is abundant. The comparison should include samples that test both sensitivity and specificity.
| Sample or control | Why it is included | Expected result |
|---|---|---|
| High-expression lysate | Confirms strong target detection | Strong target band |
| Intermediate-expression lysate | Reveals moderate signal shifts | Intermediate target signal |
| Low-expression lysate | Challenges practical sensitivity | Weak but reproducibly detectable band |
| Knockout or confirmed negative lysate | Tests target-dependent specificity | No target-sized band |
| Banked internal reference lysate | Provides a stable comparison across runs | Consistent reference signal |
| No-primary control | Checks secondary-antibody and detection-system background | No primary-dependent signal |
The controls do different jobs. A knockout lysate tests target dependence; a no-primary control tests the detection system; a loading control or total-protein stain supports normalization. For a broader review, see Boster Bio's Western blot control design guide.
The cleanest lot comparison changes one variable: the primary-antibody lot. Sample preparation, electrophoresis, transfer, blocking, detection, imaging, and analysis should remain matched.
If sample preparation has not already been standardized, review the Western blot sample preparation guide. Laboratories building the workflow for the first time can also use the complete Western blot protocol as the procedural reference.
Using one membrane can reduce run-to-run variation, but exposing different lanes to different primary-antibody lots is not always practical. Depending on the target and available equipment, the laboratory may use duplicate gels transferred in parallel, duplicate sample sets on a membrane that can be divided into equivalent sections, or a multichannel incubation device.
For this case, the laboratory runs matched duplicate gels and processes both membranes together. This is more realistic than claiming a same-membrane comparison when the incubation setup cannot physically isolate the two lots.
The same dilution factor does not always mean the same amount of antibody. If Lot A is supplied at 1 mg/mL and Lot B at 0.5 mg/mL, testing both at 1:1,000 places Lot B at half the working concentration. When reliable stock concentrations are available, compare matched concentrations. When they are not, begin with the qualified dilution and record the limitation.
The first run asks a practical question: can Lot B enter the existing method without a protocol change? Both lots are initially tested at the current qualified condition, with all other variables held constant.
A limited parallel titration is added only if the first comparison shows a meaningful signal or background shift, changes low-expression detection, introduces new bands, or suggests that one condition is close to saturation.
| Condition | Lot A | Lot B |
|---|---|---|
| More concentrated | 1:500 | 1:500 |
| Current condition | 1:1,000 | 1:1,000 |
| More dilute | 1:2,000 | 1:2,000 |
Both lots should be titrated in parallel. Optimizing only the replacement lot creates an unequal comparison. For a more detailed discussion of usable concentration windows, see How to Optimize Primary Antibody Dilution for Western Blot.
Lot B should be evaluated across several linked measurements. A darker band is not automatically better if background rises at the same time, and a small numerical difference may be acceptable when specificity and sample ranking are unchanged.
Confirm the expected band position, then measure background-corrected intensity using a predefined normalization method. Total-protein normalization, a validated loading-control protein, or a stable internal reference sample may be appropriate, depending on the assay.
Do not assume that GAPDH, beta-actin, or another housekeeping protein remains stable under every treatment. When a housekeeping protein is used, select it with the target molecular weight, sample type, treatment, and cellular compartment in mind. Boster Bio's loading control antibody hub provides an experiment-focused selection workflow.
Measure background consistently near the target region or across the relevant lane area. Record any new bands, their approximate molecular weights, and whether they interfere with target identification. A faint band far from the target may not affect the assay; a new band close to 65 kDa may be unacceptable even if it is not intense.
The low-expression sample reveals whether sensitivity has moved close to the practical detection limit. For this semi-quantitative assay, the relative order of samples also matters. A uniform 15% increase across all samples may leave the biological pattern intact. A change from high > intermediate > low to high > low > intermediate would be more serious, even if every lane still contains a visible band.
Optional Metric
Target-to-background ratio = background-corrected target signal divided by local background signal. Use one predefined calculation method for both lots.
The laboratory defines the decision criteria before reviewing the replacement-lot result. The criteria are tied to the assay's intended use and historical variation rather than to a universal percentage cutoff.
| Performance area | Predefined requirement for this case |
|---|---|
| Specificity | No target-sized band in the knockout lysate; no new band that interferes with the 65 kDa target region. |
| Sensitivity | High-, intermediate-, and low-expression samples retain their expected detection status. |
| Biological pattern | The order high > intermediate > low and the direction of group differences are preserved. |
| Background | Background stays within the laboratory's QC range and does not prevent reliable densitometry. |
| Quantitative agreement | Normalized results remain within a range justified by historical analytical variation and do not change interpretation. |
If the laboratory lacks enough historical data to justify a numerical equivalence range, the study should not pretend otherwise. The bridge may support a qualitative or semi-quantitative decision, but not a strong claim of quantitative equivalence.
The first matched run produces the following illustrative results. These numbers demonstrate the decision process; they are not universal acceptance limits.
| Metric | Qualified Lot A | New Lot B | Interpretation |
|---|---|---|---|
| High-expression normalized signal | 1.00 | 1.18 | Stronger signal |
| Intermediate-expression signal | 0.61 | 0.70 | Relative pattern preserved |
| Low-expression signal | 0.24 | 0.27 | Still reliably detected |
| Knockout target-sized band | Not detected | Not detected | Specificity preserved |
| Target-to-background ratio | 8.5 | 8.1 | Comparable |
| New interfering bands | None | None | Acceptable |
| Sample ranking | H > M > L | H > M > L | Preserved |
Lot B is consistently stronger, but it does not change the parts of the blot that matter. The knockout remains negative, the low-expression sample remains detectable, no interfering band appears, and the sample ranking is unchanged.
Because the signal has shifted upward, the laboratory runs a limited parallel titration. A slightly higher dilution brings Lot B into the established working range without increasing background or reducing low-expression detection. The revised condition is confirmed in a second run.
Decision
Lot B is conditionally approved at the revised working dilution. The adjustment restores the expected signal range while preserving specificity, background, low-expression detection, and sample ranking.
This is not a failure disguised as optimization. The adjustment is limited, documented, and confirmed. It does not change the biological interpretation or require a broader redesign of the assay.
Before rejecting the lot, rule out transfer, blocking, washing, secondary-antibody, imaging, and sample-handling problems. Boster Bio's Western blot troubleshooting guide can help separate a true lot effect from a workflow problem.
The bridge is not complete until another scientist can reconstruct what was compared and why the lot was approved.
For the first few routine runs with Lot B, the laboratory continues to include the banked internal reference lysate. This provides an early check that the new working condition remains stable outside the bridging experiment.
| Error | Why it weakens the conclusion |
|---|---|
| Waiting until Lot A is exhausted | Historical images cannot replace a direct side-by-side reference. |
| Testing only a strong positive lysate | A loss of sensitivity may remain hidden. |
| Running the lots on different days | Run-to-run variation may be mistaken for a lot effect. |
| Using the same dilution despite different stock concentrations | The lots may be tested at different working concentrations. |
| Changing exposure independently | Separate optimization can hide a real signal difference. |
| Judging only band darkness | Specificity, background, low-expression detection, and ranking may be more important. |
| Setting limits after seeing the result | The decision becomes vulnerable to hindsight bias. |
A useful Western blot lot bridge evaluates more than whether the expected band is still visible. It asks whether the new lot preserves target-dependent specificity, usable sensitivity, manageable background, sample ranking, and the biological interpretation required by the study.
Begin while enough of the qualified lot remains. Compare both lots in a matched run, include samples that challenge sensitivity as well as specificity, and decide against criteria set before the data are reviewed.
A stronger or weaker signal does not automatically mean the new lot has failed. In this example, a small and documented dilution adjustment supported conditional approval because the assay's scientific meaning did not change.
For additional Western blot protocols, optimization articles, and troubleshooting resources, visit the Western Blotting Technical Resource Center. Researchers evaluating a Boster antibody for a new sample type or application can also review the Free Antibody Validation program for eligible antibodies.