This website uses cookies to ensure you get the best experience on our website.


- Table of Contents
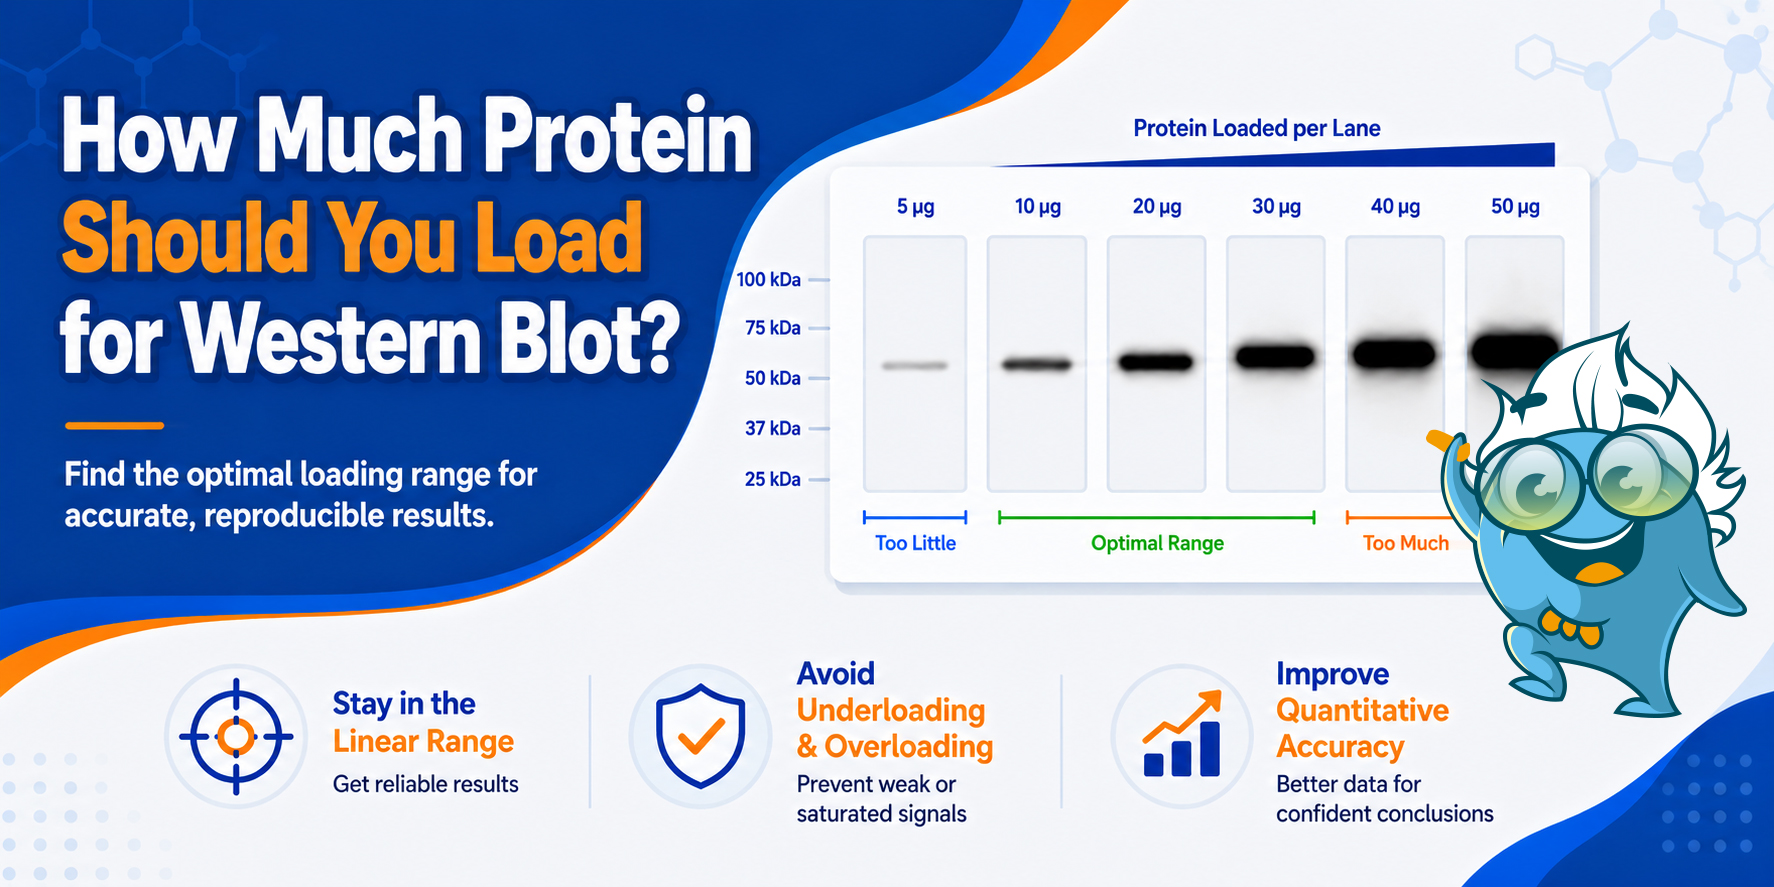
A practical guide to choosing a starting amount, defining the linear range, calculating loading volume, and avoiding saturation.
For a new western blot, 20–30 μg of total lysate per lane is a practical starting point for many targets. Abundant proteins may require less, while low-abundance or modified proteins may require more. When a target remains weak, it may be more effective to optimize western blot sample preparation, enrich the target, or improve detection rather than simply load more protein.
Purified or recombinant proteins should be titrated separately in the nanogram range. For quantitative comparisons, choose a load that produces a clear, unsaturated signal and confirm it with a short loading series.
| Sample or target context | Practical starting range | How to use the range |
|---|---|---|
| Highly abundant structural or housekeeping protein | 5–15 μg total lysate | Start low. These targets can saturate well before a low-abundance target becomes detectable. |
| Moderately abundant target in whole-cell lysate | 15–30 μg total lysate | A useful first bracket for many routine blots; verify signal linearity before quantification. |
| Tissue lysate or complex sample | 20–40 μg total lysate | Tissue composition and extraction efficiency vary. Re-optimize for each tissue and target. |
| Low-abundance or post-translationally modified target | 30–50 μg total lysate as an initial upper bracket | If the band remains weak, optimize extraction, antibody conditions, exposure, or enrichment before automatically loading 80–100 μg. |
| Purified or recombinant protein | 1–100 ng | Titrate separately from lysate. For a positive control, 10–50 ng is often a sensible first test. |
These values are practical pilot brackets rather than validated target-specific recommendations. The final protein load should be established using the actual sample type, antibody, membrane, detection chemistry, and imaging settings used in the experiment.
The amount of protein required for a western blot depends on more than the total protein concentration. Target abundance, sample preparation, antibody performance, and the purpose of the experiment all affect the useful loading range.
When More Protein Is Not the Answer
If the target remains weak as the protein load increases, compare the loading series before adding more sample. A proportional increase suggests that a higher load may help. Little or no increase suggests that antibody conditions, transfer, extraction, or detection may be limiting the signal.
For relative quantitative comparison by western blot , the useful loading range is the interval in which measured band intensity changes proportionally with protein amount. At the low end, the band disappears into background. At the high end, adding more protein no longer increases the measured intensity. Neither region is suitable for comparing samples. In either case, densitometry no longer reflects the true difference between samples. [1–4]
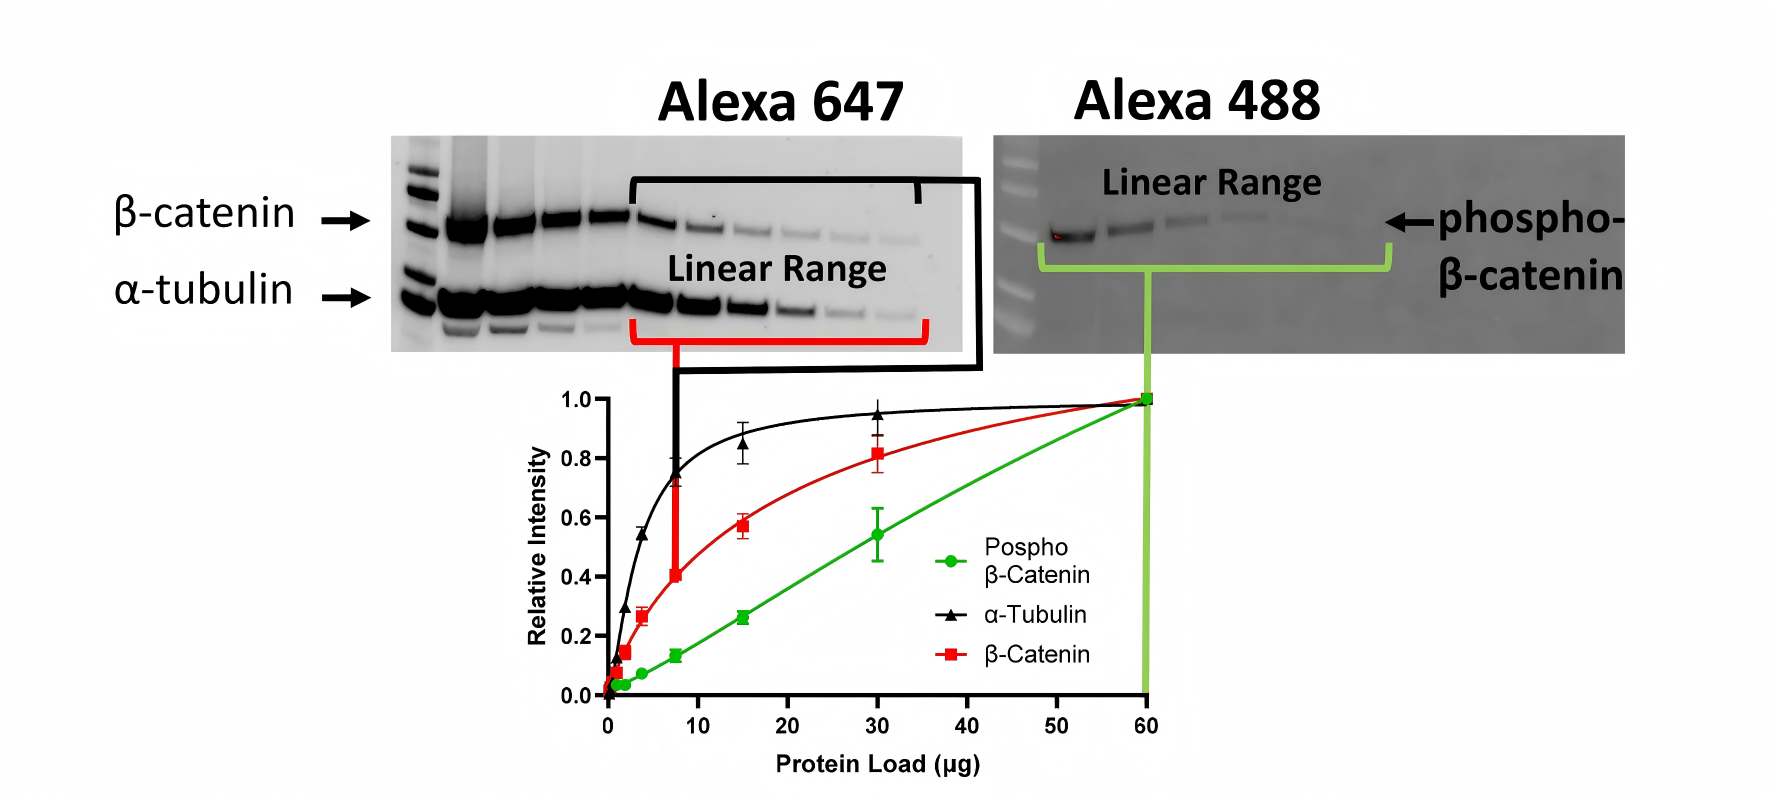
Figure 1. Different protein targets can have different linear loading ranges in the same lysate. Representative fluorescent western blot dilution series and signal-versus-load curves for β-catenin, phospho-β-catenin, and α-tubulin. The usable range shown is specific to the samples, antibodies, and detection conditions used in this study and should not be treated as a universal loading recommendation. Cropped and adapted from Taylor et al. (2022), Figure 1B [1]
A target band can remain within its usable range even when an abundant loading control such as β-actin, GAPDH, and tubulin has already saturated. A clean-looking loading-control band is therefore not enough: the target and reference signals must both respond proportionally at the selected protein load.
Band appearance can suggest a loading problem, but it is not diagnostic on its own. Smearing may result from excessive protein, high salt, viscosity, degradation, or poor electrophoresis. Multiple bands may reflect antibody specificity, isoforms, post-translational modification, or degradation—not simply overloading.
| Observation | Likely possibilities | What to try next |
|---|---|---|
| Target band is faint or absent while total-protein transfer looks normal | Target abundance is low; antibody sensitivity or specificity is insufficient; transfer is suboptimal for the target size. | Increase load modestly within well capacity, optimize antibody and transfer conditions, confirm a positive control, or enrich the target. |
| Lane is broad, streaked, or diffuse | Too much total protein; high salt or detergent; viscous DNA; incomplete clarification. | Reduce the load, shear nucleic acids, clarify the lysate, and clean up or dilute incompatible buffer components. |
| Band intensity stops increasing across the loading series | Detection or membrane saturation. | Use less sample, a more dilute antibody, shorter exposure, or a lower-sensitivity substrate. |
| Loading-control intensity barely changes across the loading series | The loading control is probably saturated. | Increase antibody dilution, reduce load, or use validated total-protein normalization. |
| Sample spills or signal appears in adjacent lanes | Total loading volume exceeds the well capacity or the sample was loaded poorly. | Reduce total volume, concentrate the lysate, verify well specifications, and load slowly. |
| Multiple bands become stronger as load increases | Nonspecific antibody binding, degradation, isoforms, or excessive antibody concentration; overload may contribute but is not the only cause. | Run appropriate controls, use fresh inhibitor-containing lysate, increase antibody dilution, and confirm expected isoforms or cleavage products. |
The same membrane can yield different usable quantitative ranges depending on how the signal is generated and captured. X-ray film can saturate quickly, and saturation may not be obvious from the final image. When film is used, collect multiple exposure times and avoid using very dark bands for densitometry.
Digital chemiluminescence systems make it easier to compare exposures and identify saturated pixels. Fluorescent detection may provide a broader working range and support multiplex detection of the target and reference protein on the same membrane. However, neither method eliminates the need to validate the loading range for the specific antibody, detector, and imaging settings. [1,3,4]
Repeat the loading-series test when changing the substrate, imaging platform, membrane, detection channel, or exposure strategy.
For a moderately abundant target, 20–30 μg is a practical first test, although a broader 10–50 μg range may be useful during optimization. Measure protein concentration with an assay compatible with the lysis buffer, mix samples thoroughly, and equalize the concentration before adding loading buffer.
Tissue composition, extracellular matrix, lipids, and cell-type heterogeneity can change extraction efficiency and lane behavior. Conditions established in a cell line may therefore need to be re-optimized for tissue. A 20–40 μg range is a practical initial bracket.
Purified protein contains a much larger fraction of the target than a complex lysate. Use nanogram-scale loads and run a separate titration. When a recombinant protein is used as a positive control, its band should be visible but not so intense that it blooms, saturates, or affects adjacent lanes.
For immunoprecipitates, reporting a standardized fraction of the input and eluate is usually more informative than claiming a total-protein mass that may be difficult to measure accurately. Include appropriate input, IgG, and bead controls. Do not normalize an IP eluate to a conventional housekeeping protein.
Normalize the collection and concentration workflow to a defined starting volume, cell number, culture area, or another justified reference. The amount loaded should be established empirically after concentration because secretion rate and recovery vary widely between targets and media formulations.
| Requirement | Qualitative detection | Quantitative comparison |
|---|---|---|
| Primary goal | Confirm that a band is present near the expected molecular weight. | Estimate relative differences between biological conditions. |
| Loading-range validation | Helpful but not always essential for a simple presence/absence check. | Required for the target and normalization signal. |
| Exposure | A clear, interpretable image may be sufficient. | Must be unsaturated and acquired under consistent settings. |
| Normalization | Use total-protein staining or an appropriate reference control to document loading and transfer. | Use a validated housekeeping protein or validated total-protein method within range. |
| Replicates | A technical check may be sufficient for preliminary method verification. | Use independent biological replicates for biological comparisons. |
| Reporting | State sample type, protein load, antibody conditions, and expected molecular weight. | Also report range validation, normalization method, image acquisition, background subtraction, and statistical analysis. |
Related resources: Western Blotting Technical Resource Center brings together protocols, optimization guides, troubleshooting resources, and related articles.
There is no universal minimum concentration for detection. The practical minimum is determined by the protein mass required and the maximum volume the well can hold. For example, a 1 mg/mL lysate contains 1 μg/μL, so 20 μg requires 20 μL of lysate before loading buffer is added.
No. A representative pooled sample can be used for calibration. Biological replicates are required for the final experiment, not for every point in the loading series.
Use a more dilute loading-control antibody, choose a lower-abundance validated reference, or switch to a validated total-protein normalization method. Do not normalize a target to a saturated loading-control band.
A central point is often a good start because it provides headroom in both directions. It is not an absolute rule: move within the range when the target is expected to increase or decrease strongly, so every sample remains measurable and unsaturated.
Sometimes, but only when the gel, sample volume, lane resolution, and normalization strategy can support it. Before increasing that far, test extraction efficiency, positive controls, antibody conditions, enrichment, and a more sensitive detection method.
If the loading volume is too large, concentrate the lysate, use a wider well, or improve target enrichment. Avoid excess salt, detergent, viscosity, or particulates, which can impair separation. Do not overfill the well, as this may cause spillover and distorted lanes.
Need help troubleshooting weak, smeared, or saturated western blot bands?
Use Boster Bio’s Western Blotting Troubleshooting Guide or review western blot sample preparation before your next run.
For project support, explore Boster Bio’s Western Blot Service .