This website uses cookies to ensure you get the best experience on our website.


- Table of Contents
You have your chromatin, your antibody, an Input sample, and an IgG control. Then comes the question many ChIP-qPCR users run into:
Which genomic regions should the qPCR primers actually target?
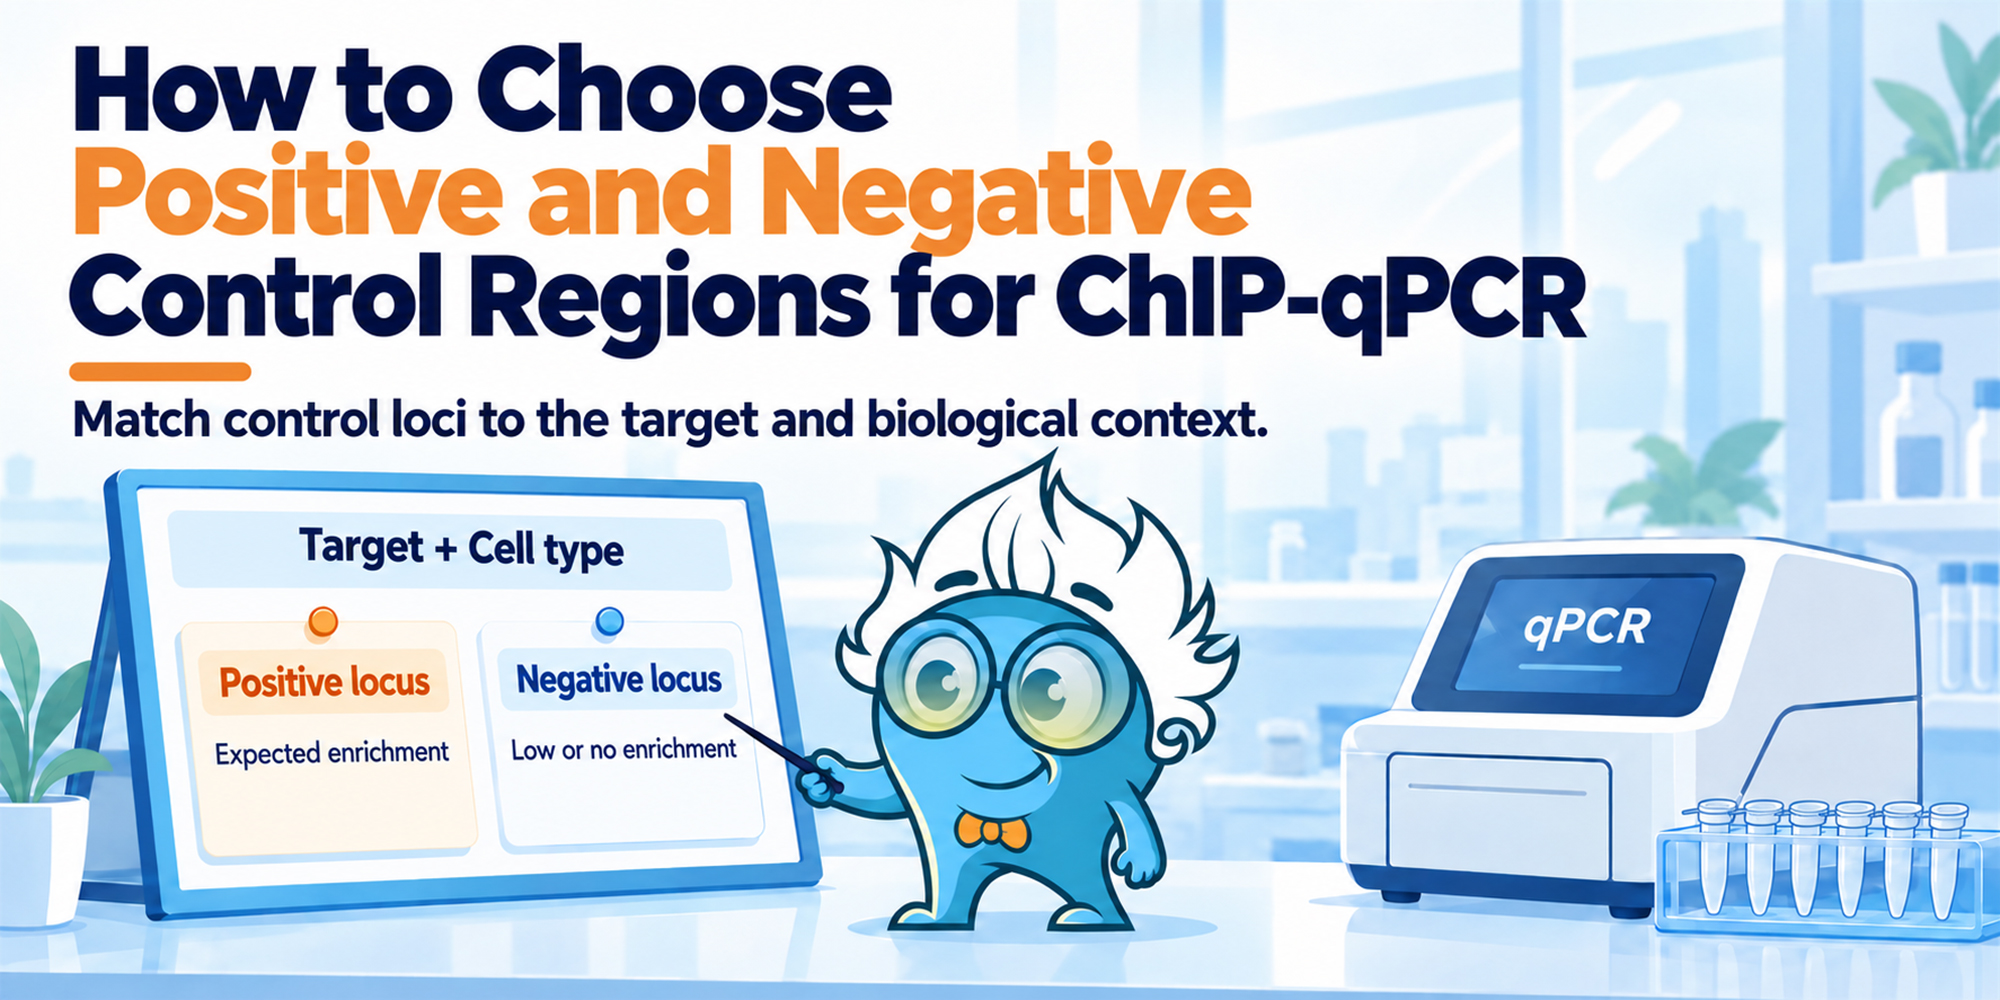
In most cases, you need at least one region where your target is expected to be enriched and at least one region where little or no enrichment is expected. These become your positive and negative control loci.
Input and IgG are still important, but they answer different questions. Input tells you what DNA was present before immunoprecipitation. IgG helps estimate nonspecific pull-down. Positive and negative genomic loci tell you whether enrichment occurs where the biology predicts it should.
That last point is what makes control-locus selection less straightforward than it first appears. A useful positive or negative region depends on the target, the cell type or tissue, and often the treatment condition.
If you need a broader review of ChIP principles, protocol design, optimization, and troubleshooting, Boster's ChIP Handbook provides a useful starting point.
| Control | What it represents | Main question it helps answer |
|---|---|---|
| Input | Chromatin saved before IP | Was this genomic sequence present in the starting material, and how much was there? |
| IgG control | Parallel IP with nonspecific IgG | How much DNA is recovered through nonspecific antibody or bead interactions? |
| Positive control locus | Region expected to be enriched for the target | Can the assay recover a genomic region that should contain this target? |
| Negative control locus | Region expected to show little or no target enrichment | Is enrichment preferential to expected loci rather than broadly distributed? |
Suppose your target locus gives 2% Input while the IgG gives 0.1%. That may look convincing. But if a genomic region where your protein is not expected to bind also gives roughly 2% Input, the result becomes much harder to interpret.
This is why IgG does not replace a negative genomic locus. IgG tells you about nonspecific immunoprecipitation; a negative locus tells you about genomic specificity.
| Target | Where to look | Common starting point |
|---|---|---|
| H3K4me3 | Promoter/TSS of an actively transcribed gene | GAPDH or ACTB promoter |
| RNA Polymerase II | Promoter/TSS or gene body of an active gene | Active housekeeping genes |
| H3K36me3 | Gene body of an actively transcribed gene | Downstream exons of active genes |
| H3K27ac | Active promoter or enhancer | Cell-type-specific active regulatory regions |
| H3K27me3 | Repressed developmental promoter | Silent HOX-region genes in appropriate cells |
| H3K9me3 | Heterochromatic region | Validated mappable heterochromatic loci |
| Transcription factor | Known occupied promoter or enhancer | A documented direct target of the factor |
A good positive control is a region where your ChIP target is expected to be enriched in the system you are actually testing.
For a transcription factor, that may be a validated promoter or enhancer. For an active histone modification, it may be the promoter of a highly expressed gene. For a repressive mark, the positive region may instead be associated with silent chromatin.
The best place to start is usually existing evidence. Published ChIP-qPCR or ChIP-seq data can provide candidate regions, and public resources such as ENCODE, Cistrome DB, and ChIP-Atlas are useful when no validated qPCR locus is already available. For a broader comparison of ChIP-qPCR, ChIP-seq, CUT&RUN, and CUT&Tag, see Boster's A Comprehensive Guide to Epigenomic Profiling.
Antibody validation data can also provide useful starting loci. Boster's Primary Antibodies for ChIP can be filtered by ChIP application when you need to review available ChIP-tested reagents.
When using public ChIP-seq data, look for a strong, reproducible signal in a relevant biological context. Ideally, it should appear across replicates or independent datasets. For transcription factors and narrow histone marks, the qPCR amplicon can usually be placed near the strongest enrichment region or peak summit. For broad marks such as H3K27me3 or H3K9me3, choose a representative region within the enriched domain rather than assuming a single sharp summit exists.
The type of target also changes what a sensible positive locus looks like. The examples below are starting points only. Confirm enrichment or occupancy in your own cell type and experimental condition before using them as controls.
A GAPDH promoter may work well for H3K4me3, but that does not make it a positive control for an arbitrary transcription factor. A HOX promoter may be repressed in one cell type and active in another.
This is where published controls are easy to misuse. A locus validated in another species, cell type, or treatment condition may not behave the same way in your experiment. The problem is particularly obvious with inducible transcription factors, hormone receptors, and dynamic histone marks, where occupancy can change substantially after stimulation or differentiation.
If your target has no well-established binding site, a defined biological stimulus can create a useful treated-versus-untreated comparison. Motif predictions can also identify candidates, especially when combined with ATAC-seq or DNase-seq data showing that the region is accessible. Motif presence alone, however, is not proof of occupancy.
Another option is to validate the general ChIP workflow separately with a well-characterized target such as total histone H3, RNA Polymerase II, or a common histone modification. For transcription-factor experiments, the ChIP Protocol for Transcription Factors provides the broader workflow from crosslinking and chromatin shearing through IP, Input, IgG, and control setup.
A negative control should be a region where the target is expected to show little or no enrichment.
The strongest negative control is not necessarily the most distant or most inactive region in the genome.
A gene desert or intergenic region can be useful, especially if public ChIP-seq data show no signal there. But very compact or inaccessible chromatin may naturally be recovered poorly. In that case, low ChIP signal may partly reflect the region itself rather than antibody specificity.
For many transcription-factor ChIP assays, an accessible but unbound region can provide a more stringent negative control than a random gene desert. For example, you might choose an active promoter with no convincing binding motif, no relevant public ChIP-seq peak, and no known biological reason for occupancy.
If your antibody enriches the expected positive locus but not an accessible, unbound region, the comparison gives stronger evidence of locus-specific enrichment.
Gene deserts can still be useful, but they are better treated as one option rather than the default gold standard. During assay development, using two negative loci is often helpful because one unusually high or low region becomes easier to recognize.
It is also important to remember that “negative” depends on the target. A GAPDH promoter may be positive for H3K4me3 and negative for H3K27me3. A silent developmental locus may show the opposite pattern.
There is no universal negative genomic region.
A well-chosen locus is only useful if the qPCR primers perform properly.
Poor primers can make a true positive locus look weak or make a negative locus appear artificially inconsistent.
Short amplicons are generally preferred for ChIP-qPCR because the chromatin has already been fragmented. A practical starting range is often around 80–150 bp, although the exact design should reflect fragment size and the genomic region being tested.
For a positive locus, place the amplicon close to the expected enrichment region. For a negative locus, place it within the region that has been verified as unbound or minimally enriched.
Primer specificity can be checked with tools such as Primer-BLAST or UCSC In-Silico PCR. If primer specificity or amplification performance is uncertain, Boster's PCR Protocols & Primer Design Guide covers primer design, reaction setup, and common amplification problems.
Repetitive and poorly mappable regions should generally be avoided unless they are central to the biology.
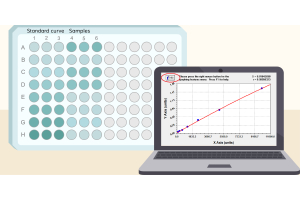
Before interpreting ChIP samples, validate each primer pair on Input DNA. A dilution series can be used to check amplification efficiency, while the melt curve and no-template control help confirm specificity. An efficiency range around 90–110% is commonly used as a practical qPCR benchmark.
Input Ct values across loci should also be broadly comparable. A large difference may point to poor primer performance, copy-number variation, or genomic complexity rather than a true ChIP effect.
| Result pattern | What it may mean |
|---|---|
| Positive locus high, negative locus low, IgG low | Expected locus-specific enrichment |
| Positive locus low, negative locus low | Weak IP, low occupancy, poor antibody performance, or unsuitable positive locus |
| Positive locus high, negative locus also high | High background, poor specificity, or an inappropriate negative locus |
| Target IP and IgG both high | Nonspecific immunoprecipitation |
| Input amplification poor | Primer or DNA-quality problem |
| Positive locus works only after treatment | Could reflect real condition-dependent occupancy |
| One negative locus is high but another remains low | The first negative locus may not actually be negative |
Percent Input is often the most convenient way to normalize recovery to the amount of starting chromatin. If 1% Input was saved, the Input Ct must first be adjusted for that fraction.
Fold enrichment over IgG can also be useful because it shows how far the target IP rises above nonspecific background at the same locus. Comparing the positive locus with a negative locus adds a separate view of locus-specific enrichment.
None of these values should be treated as a universal pass/fail cutoff on their own. Histone modifications often produce very different enrichment ranges from low-abundance transcription factors or cofactors, and a numerical benchmark used by one validation platform may not transfer cleanly to another experiment.
If the positive locus remains weak or background is high across loci, the broader ChIP Troubleshooting Guide covers chromatin shearing, crosslinking, starting material, antibody amount, and wash conditions.
Consider an H3K4me3 ChIP-qPCR experiment.
H3K4me3 is commonly enriched near promoters of actively transcribed genes, so a GAPDH promoter can serve as a reasonable positive locus in many cell types. A negative region should show little H3K4me3 under the same conditions.
Suppose the positive locus is strongly enriched, both negative loci remain low, and IgG is low throughout. That is a convincing pattern because the biological and technical controls agree.
If GAPDH and both negative loci were all similarly high, the interpretation would be very different. High background, poor washing, an unsuitable negative region, or broader specificity problems would need to be considered.
Histone ChIP has somewhat different optimization considerations from transcription-factor ChIP. See the ChIP Protocol for Histones for the full workflow.
A transcription factor ChIP requires a different strategy.
For a signaling-responsive transcription factor, a housekeeping promoter is not automatically useful. A better positive locus is a promoter or enhancer with published binding evidence, a relevant ChIP-seq peak, or a clear biological relationship to the factor. The negative locus should lack convincing occupancy under the same condition.
If the factor is inducible, treated and untreated cells can add another level of validation. A region that becomes enriched only after stimulation may provide stronger evidence than a control borrowed from an unrelated cell type.
Several mistakes recur in practice.
One is reusing the same housekeeping-gene control for unrelated ChIP targets. Another is treating IgG as a substitute for a negative genomic locus. Controls borrowed from another cell type can also be misleading, particularly for inducible transcription factors or dynamic histone marks.
Negative controls are another common weak point. Choosing an intergenic region without checking whether it is accessible or whether public ChIP-seq data show occupancy can make the comparison less informative than expected.
Primer performance can create the same problem from another direction. A biologically appropriate locus is not useful if its qPCR assay is inefficient or nonspecific.
Finally, numerical cutoffs should be treated as context rather than universal rules. A histone-mark ChIP and a transcription-factor ChIP may both be technically successful while producing very different percent-input values.
A straightforward approach is to define the target and biological context first, then use the strongest available evidence to identify a candidate positive region. Public ChIP-seq data, published studies, antibody validation data, and internal results can all help.
Next, choose one or more negative regions that are expected to lack enrichment but remain technically interpretable. For many transcription-factor assays, an accessible but unbound region can be more informative than a completely inactive gene desert.
Once the loci are chosen, design short, specific qPCR assays and validate them on Input DNA before using them to judge ChIP performance.
The final experiment should bring the controls together: Input, IgG, target IP, positive locus, and negative locus. Interpretation should then come from the pattern across all of them rather than from one Ct value, one ratio, or one benchmark.
Input and IgG are important ChIP controls, but they do not tell you whether enrichment occurs at the genomic regions where the target is expected to be found.
Positive and negative loci provide that biological context.
Input and IgG tell you whether the experiment has usable signal and manageable background; positive and negative loci tell you whether that signal is occurring where the biology predicts it should.
The best control strategy combines a region expected to be enriched, one or more regions expected to show little or no enrichment, validated qPCR primers, and controls that match the actual cell type and experimental condition.
A control locus is not simply “positive” or “negative” once and for all.
It is positive or negative for a particular target, in a particular biological context.
For additional protocol, troubleshooting, PCR, and assay resources, visit Boster's All Technical Support Resources.