This website uses cookies to ensure you get the best experience on our website.


- Table of Contents
IMMUNOPHENOTYPING AND CELL ANALYSIS
Custom flow cytometry panels, immunophenotyping and functional assays—planned around your samples and study goals.
Explore Our ServicesFlow cytometry measures size, granularity and fluorescence on thousands of single cells per second, so it can resolve cell populations that bulk assays average together. It is part of Boster's assay services and covers research projects from panel design to analyzed data.
Two kinds of work go by the name:
Most projects need acquisition only. Sorting makes sense when a translational study has to isolate a population for mechanistic follow-up. The two also differ in what they ask of the sample: analytical runs can use fixed cells, while sorting for downstream culture or functional work needs live, viable cells handled with care to keep them healthy.
Many teams come to us as a flow cytometry CRO: they outsource panel design, sample processing, acquisition and analysis so that preclinical and translational studies do not depend on in-house instrument time or cytometry expertise. The service is organized around the study, with one scoped plan and one dataset delivered at the end.
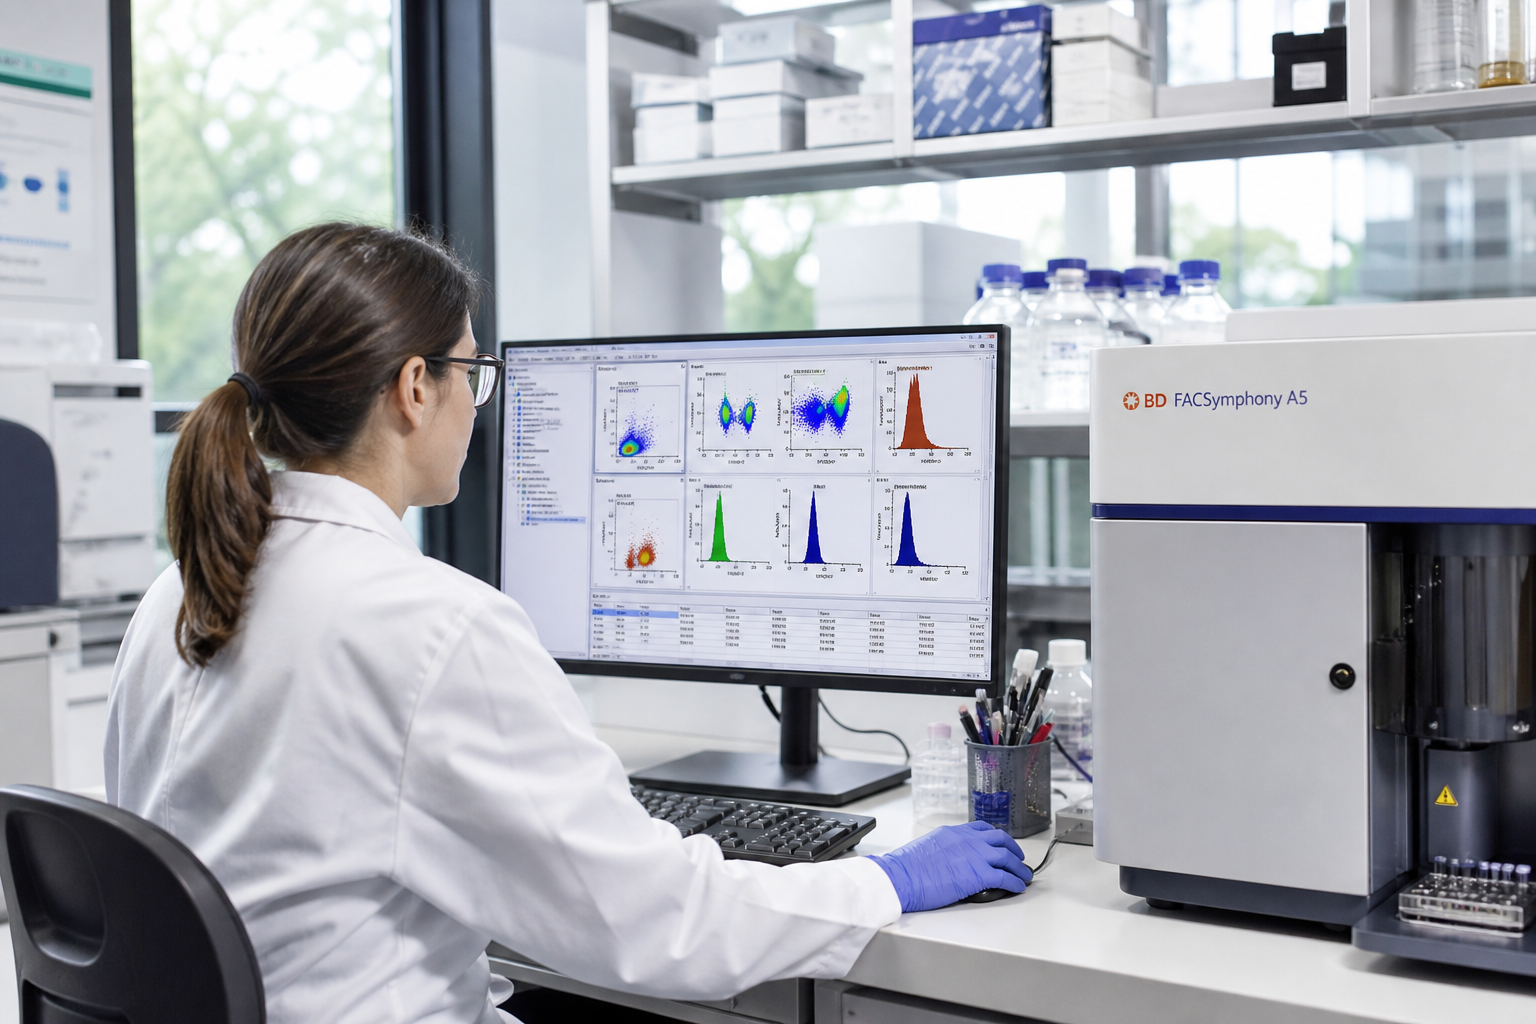
Immune profiling of blood, spleen and tumor digests from in-life and ex vivo work, alongside PK/PD and efficacy readouts.
Exploratory panels, biomarker feasibility work and mechanism-of-action studies that connect discovery findings to disease biology.
Expression, phenotype and persistence readouts for CAR-T and CAR-NK cells in research models.
| Study stage | Typical question | Typical flow cytometry work |
|---|---|---|
| Preclinical | Does the candidate change immune populations, or reach its target, in the model? | Immune profiling of blood, spleen and tumor digests; activation- and exhaustion-associated markers; apoptosis or proliferation readouts; receptor occupancy where feasible. |
| Translational | Which cellular biomarkers link the mechanism of action to disease biology? | Custom exploratory panels with feasibility on the real matrix; phospho-flow; intracellular cytokine staining; antigen-specific and rare-cell detection. |
| Clinical-study research samples | Do samples collected in a study show the expected pharmacodynamic or immune change across time points? | A locked panel and gating template run in batches; PBMC immunophenotyping and lymphocyte subsets; longitudinal comparison per donor. Study endpoints, assay qualification and documentation requirements are reviewed during project scoping. |
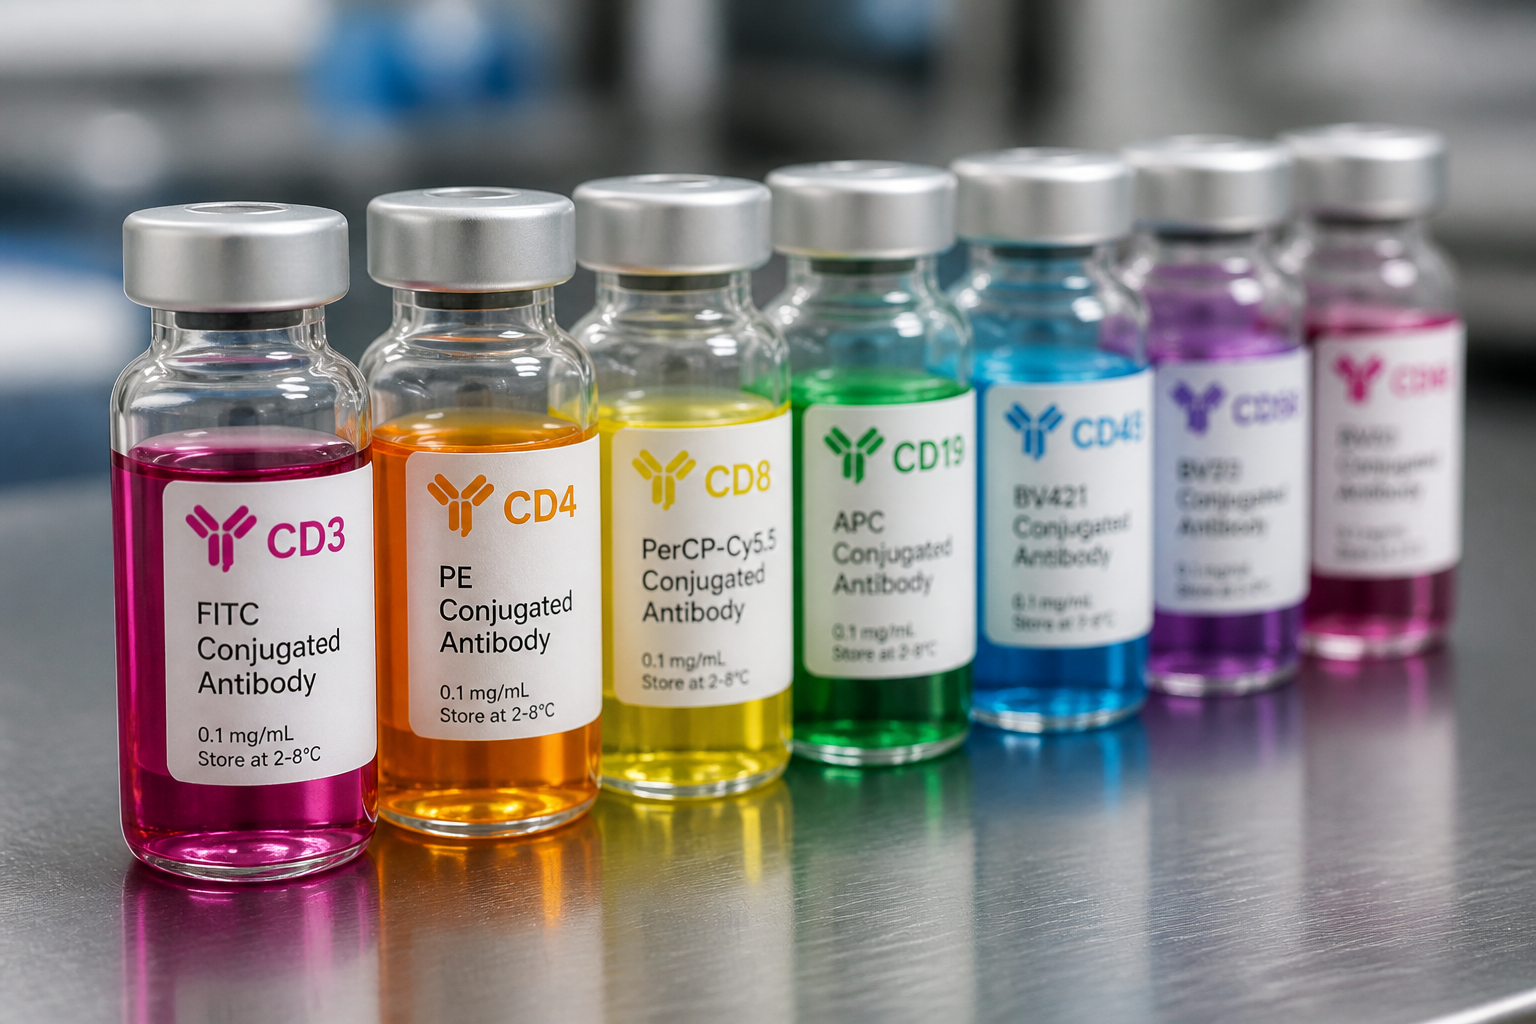
A panel starts from the question the study needs to answer. Design covers these steps before any study samples are stained:
The general staining workflow follows our flow cytometry protocol. Documented panel performance helps support comparable results across cohorts and time points.
Several details in the panel matter as much as the marker list. A viability dye excludes dead cells, which bind antibodies non-specifically and inflate background. An Fc-receptor blocking step reduces non-specific binding to monocytes, B cells and myeloid cells. A dump channel can remove lineages that are not of interest so the cells of interest are easier to gate.
Tandem dyes are checked for lot-to-lot and handling-related changes, because degraded tandem dyes leak signal into neighbouring channels. Antibody clones are confirmed for the species being studied, since a clone that works on human cells may not recognize the mouse or non-human primate ortholog. Fixation and permeabilization are chosen to suit the least tolerant epitope in the panel, especially for intracellular and phospho targets.
Immunophenotyping identifies and counts immune cell subsets by their surface and intracellular markers. It is the most common reason researchers run flow cytometry, and PBMC flow cytometry is the most frequent way it is applied to blood-derived samples.
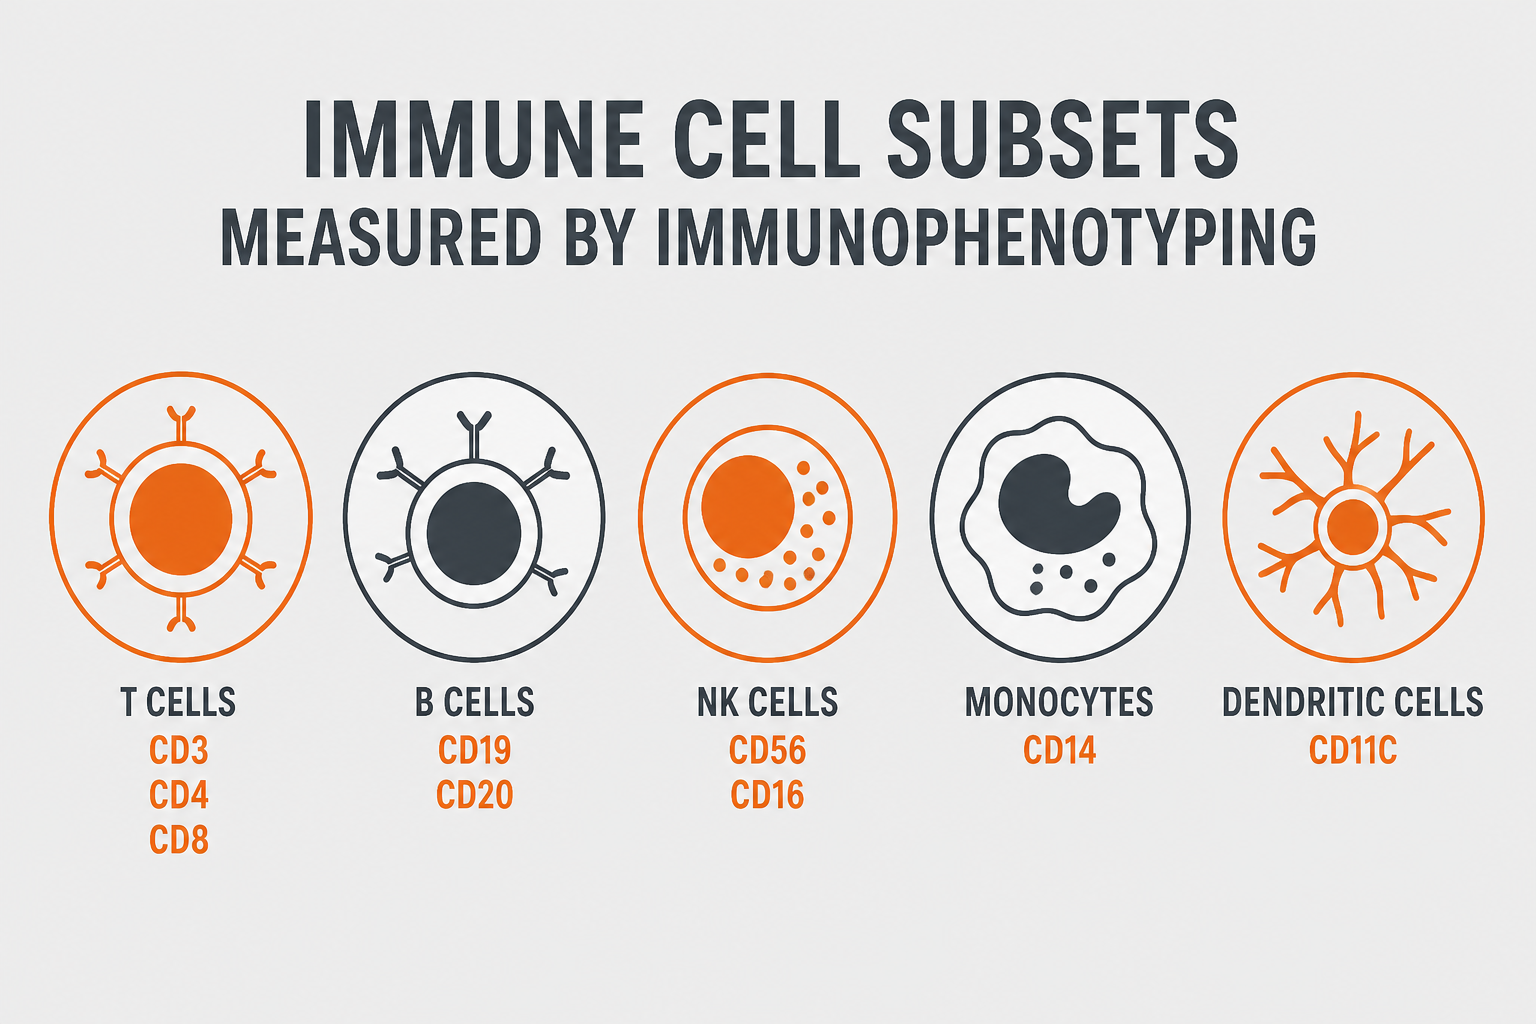
A standard panel resolves the major immune cell subsets: T cells (CD3+, with CD4+ and CD8+ subsets), B cells (CD19+ or CD20+), NK cells (CD3−CD56+), monocytes (CD14+) and dendritic cells. Results are reported as frequencies of parent populations. Absolute counts with counting beads are available on request through partner labs.
Lymphocyte subset analysis can further resolve the T-cell compartment: naive, central memory, effector memory and terminally differentiated effector populations using CD45RA with CCR7 or CD62L, and regulatory T cells using CD25 and FOXP3. B-cell and NK-cell subsets can be added to the same panel when the question calls for them. Marker choices depend on species and are confirmed at feasibility.
A basic lymphocyte subset panel (T, B and NK cells with CD4 and CD8 T-cell subsets) is a compact way to establish a baseline before adding deeper markers. Frequencies are reported as a percentage of lymphocytes or of a defined parent gate, and as absolute counts when counting beads are included.
Immuno-oncology and immunotherapy studies often assess activation-associated markers such as CD25, CD69 and HLA-DR, alongside inhibitory receptors such as PD-1, TIM-3, LAG-3 and CTLA-4. These markers help characterize immune-cell phenotypes, but expression alone does not establish functional activity or exhaustion. Interpretation depends on the marker combination, functional readouts and study context.
Many studies sample at baseline and at several later time points. Running the same panel with the same gating template at every time point helps maintain comparability across the dataset.
Subset frequencies are tracked per animal or donor across time points, so a treatment-related shift in a T-cell or myeloid subset can be told apart from normal biological variation.
PBMC testing for research combines baseline phenotyping with activation, exhaustion and function readouts on the same cell preparation. Because PBMCs can be banked and run together, they suit immune monitoring studies where many time points need to be compared in a single batch.
In immuno-oncology studies, the useful readout is often the balance between populations: cytotoxic CD8+ T cells and their activation- or exhaustion-associated phenotype, regulatory T cells, NK cells, and myeloid compartments in blood and tumor digests. Tracking these together across treatment shows whether a therapy is shifting the immune environment in the intended direction.
| Question | Example markers | Typical use |
|---|---|---|
| Which major lymphocytes are present? | CD3, CD4, CD8, CD19 or CD20, CD56 | Baseline profile and treatment-related shifts |
| What is the T-cell differentiation state? | CD45RA with CCR7 or CD62L | Naive, memory and effector balance |
| Are regulatory T cells changing? | CD4, CD25, FOXP3 | Immunomodulatory and immuno-oncology programs |
| Do T cells show activation- or exhaustion-associated phenotypes? | CD25, CD69, HLA-DR; PD-1, TIM-3, LAG-3, CTLA-4 | Checkpoint and cell-therapy studies |
| Are cells proliferating? | Ki-67 or dye dilution | Response to stimulation or treatment |
Peripheral blood mononuclear cells (PBMCs) are lymphocytes and monocytes separated from whole blood, and they are the working material for most blood-based immune monitoring. Reliable PBMC analysis depends on more than the staining panel: cell recovery, viability and batch consistency decide whether results from different time points can be compared.
Fresh or cryopreserved PBMCs are logged on arrival and counted, and viability is recorded before any staining.
Cryopreserved cells are thawed and washed carefully. A rest period before stimulation is considered for functional readouts, since freshly thawed cells can respond differently.
Surface and intracellular staining follow the locked panel, with viability dye and Fc blocking included.
One gating template is applied to every donor and time point, with results tracked per donor.
On the same PBMC preparation, a study can read out subset frequencies, activation- and exhaustion-associated markers, proliferation, intracellular cytokine production after stimulation, and antigen-specific T cells by tetramer or multimer staining. Which of these belong in the first run depends on how many cells are available per time point.
Banking PBMCs and running all time points for a donor in one batch reduces between-run variability in the comparison. Where several batches are unavoidable, a shared control sample stained in every run shows whether the assay drifted. Cell numbers, viability expectations and shipping conditions are confirmed at quote.
Many studies add a functional readout to the base panel. The right choice depends on whether the question is about which cells are present, how they are signaling, what they produce, or whether a drug is reaching its target.
Annexin V combined with a viability dye helps distinguish viable, early apoptotic and membrane-compromised cell populations. Double-positive cells may include late apoptotic or necrotic cells; the assay alone does not reliably distinguish between these two states. Cell-cycle phase comes from DNA content staining (PI or DAPI), combined with EdU or BrdU incorporation to mark S phase or phospho-histone H3 to mark mitosis. Both are common endpoints in cytotoxicity and proliferation studies.
Best fit: compound or effector-cell studies where the question is how cells die or stop dividing.
Intracellular staining for phosphorylated proteins reads out signaling activity in defined cell subsets. It helps confirm mechanism of action and pharmacodynamic effects in research models. Because phosphorylation is rapid and transient, timing from stimulation to fixation is tightly controlled.
Best fit: pathway-targeted compounds, where signaling must be read in a specific subset rather than in a mixed lysate.
After stimulation, intracellular cytokine staining shows which subsets produce which cytokines. A protein transport inhibitor traps the cytokine inside the cell so it can be detected. To measure cytokines secreted into supernatant, serum or plasma, see our multiplex assay services.
Best fit: when you need to know which cell type is responsible for a cytokine response, not only how much is present.
A receptor occupancy assay measures how much of a cell-surface target is bound by a therapeutic antibody, typically by detecting free receptor, total receptor or both on cells from blood. Linking dose to target engagement makes it a common pharmacodynamic readout for biologics. It is available on request through partner labs, and feasibility is confirmed at quote. Design details are covered in the next section.
Best fit: programs that need evidence of target engagement alongside PK data.
Rare-cell detection and tetramer or multimer staining for antigen-specific T cells are available on request through partner labs, as is cell sorting. Rare events need large acquired event counts and a clean, low-background panel, so feasibility is confirmed at quote. The precision of a rare-population frequency depends on how many positive events are actually counted, not on total events alone.
Best fit: vaccine, infection and immunotherapy studies where the population of interest is a small fraction of total cells.
| If the question is... | Consider | What it adds to a base panel |
|---|---|---|
| Is the drug binding its target on cells? | Receptor occupancy | Free, total or drug-bound receptor measured on the target cell subset |
| Is the pathway being modulated? | Phospho-flow | Phosphorylated signaling proteins in defined subsets |
| Which cells make the cytokine? | Intracellular cytokine staining | Cytokine-positive frequencies per subset after stimulation |
| Are cells dying or dividing? | Apoptosis and cell-cycle assays | Annexin V and viability staining; DNA content and S-phase or mitosis markers |
| Is there an antigen-specific response? | Tetramer or multimer staining, antigen-specific flow | Frequency of antigen-specific T cells, including rare populations |
A receptor occupancy assay answers a pharmacodynamic question: at a given dose and time, what fraction of the target is bound by the drug on the cells that matter? Because it is measured on intact cells, flow cytometry is a natural fit.
A labeled reagent that competes with the drug for the same binding site detects only the receptor still available. Lower signal after dosing means higher occupancy.
A detection reagent that is not blocked by the therapeutic measures accessible cell-surface receptor, including both drug-bound and unbound receptor. Changes in signal may reflect altered surface expression, internalization or receptor loss; surface staining alone does not measure intracellular receptor or distinguish these mechanisms.
An anti-drug reagent detects the therapeutic antibody directly on the cell. It can be used alone or alongside free and total formats.
The reagent pair has to be checked against the drug: does the detection antibody compete with the therapeutic or not, does it still bind in whole blood, and does it work on the species used in the study? Receptor expression level on the target subset also matters, since a dim target leaves little signal to measure a decrease against.
Occupancy is time-sensitive, so sample collection, anticoagulant and the interval before staining are set in advance. Results are read against pre-dose and control samples from the same donor or animal and are best interpreted together with PK data. Receptor occupancy is available on request through partner labs; feasibility is confirmed at quote.
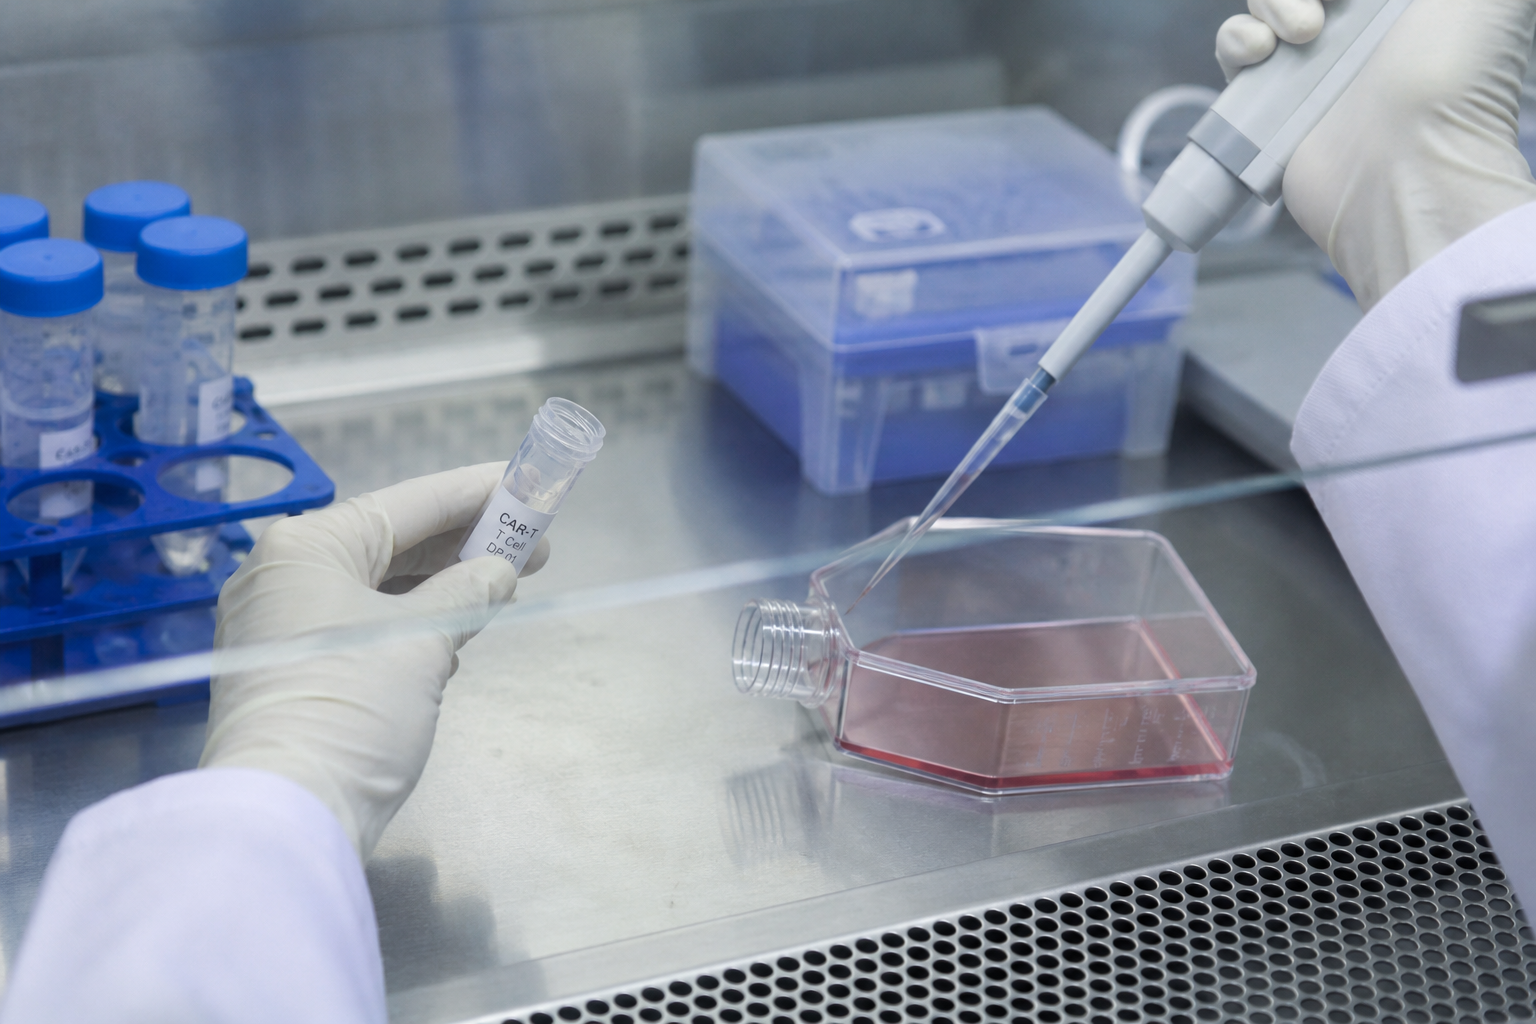
Cell therapy research uses flow cytometry from construct testing through in vivo follow-up.
Engineered cell samples are often limited, so panels are set up and tested on surrogate material before study samples are run.
| Stage | Flow cytometry readout | Typical detection approach |
|---|---|---|
| Construct and transduction | Percent CAR-positive cells and expression level | Antigen-based, anti-idiotype, protein L or tag-specific detection reagents, matched to the construct design |
| Product characterization | CD4/CD8 ratio, memory and effector phenotype, exhaustion markers | Multicolor panel on the engineered cell population |
| Function | Activation, degranulation, cytokine production and target-cell killing after co-culture | CD69 and CD25, CD107a, intracellular cytokine staining, viability or apoptosis of target cells |
| In vivo persistence | CAR-positive cell frequency and phenotype in blood and tissues over time | Same locked panel at every time point, with human cell identification in xenograft models |
| Immunogenicity | Anti-CAR antibodies in serum | Cell-based binding assay using cells that express the construct |
The platform follows from the panel. Panel size and the markers involved decide which approach fits. Spectral acquisition is available on request through partner labs.
| Consideration | Conventional Flow | Spectral Flow |
|---|---|---|
| Panel complexity | Suited to small and mid-size panels with established compensation. | Measures fluorescence across a broad range of wavelengths and uses spectral unmixing to distinguish fluorophores, supporting high-parameter panels. Performance depends on panel design and reference controls; spreading error remains a consideration. |
| Analysis | Mature reagent options and familiar compensation-based analysis. | Needs spectral unmixing with reference controls for each dye; fewer older datasets to compare against. |
| Autofluorescence | Handled with unstained controls and careful dye choice. | Autofluorescence can be treated as its own signature and extracted, which helps with tissue dissociates and highly autofluorescent cells. |
| Best fit | Routine immunophenotyping and focused functional panels. | High-parameter immune profiling and deep phenotyping in immuno-oncology or cell therapy research. |
A focused panel that answers the study question cleanly is worth more than a larger panel that has not been optimized.
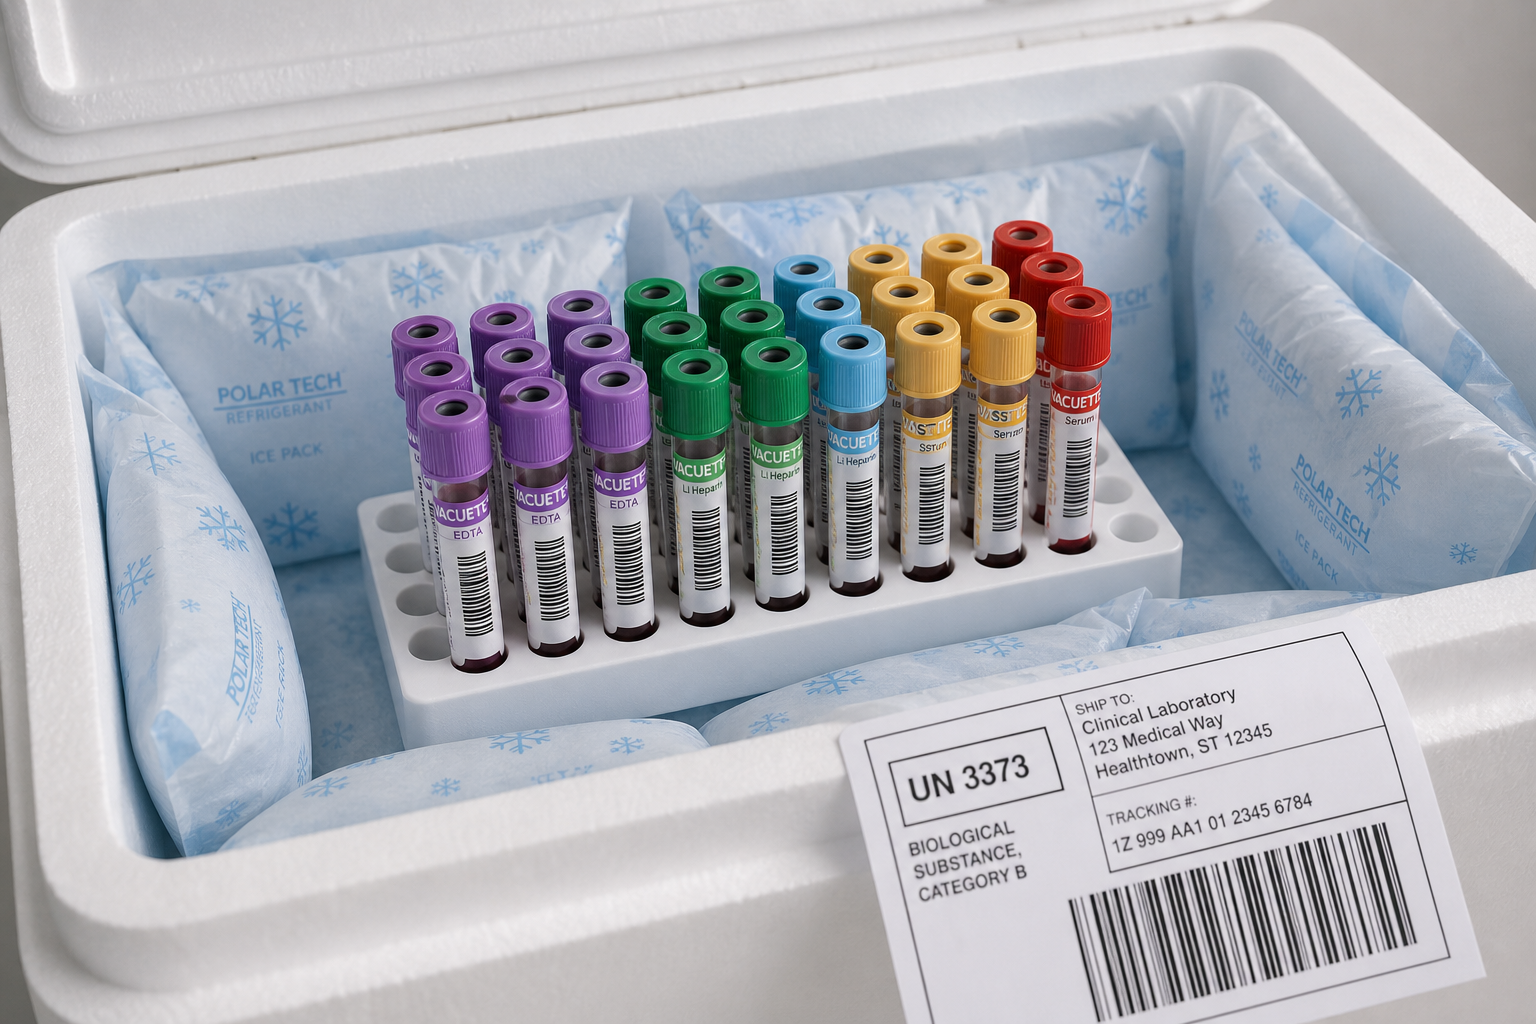
Flow data are only as good as the sample. Handling depends on the matrix:
Each matrix has a limited window between collection and staining, and whole blood is the least forgiving. Sample amounts, shipping conditions and processing timelines are confirmed at quote.
Freshly isolated and cryopreserved PBMCs are accepted subject to the agreed sample requirements. Viability is assessed at receipt or after thawing, as appropriate.
Sample type, amount, anticoagulant and shipping conditions are agreed during quoting.
Samples ship in the agreed tube type and at the agreed temperature.
Samples are logged on arrival and checked against the agreed stability window.
Processing timing is set at quote to protect viability and marker integrity.
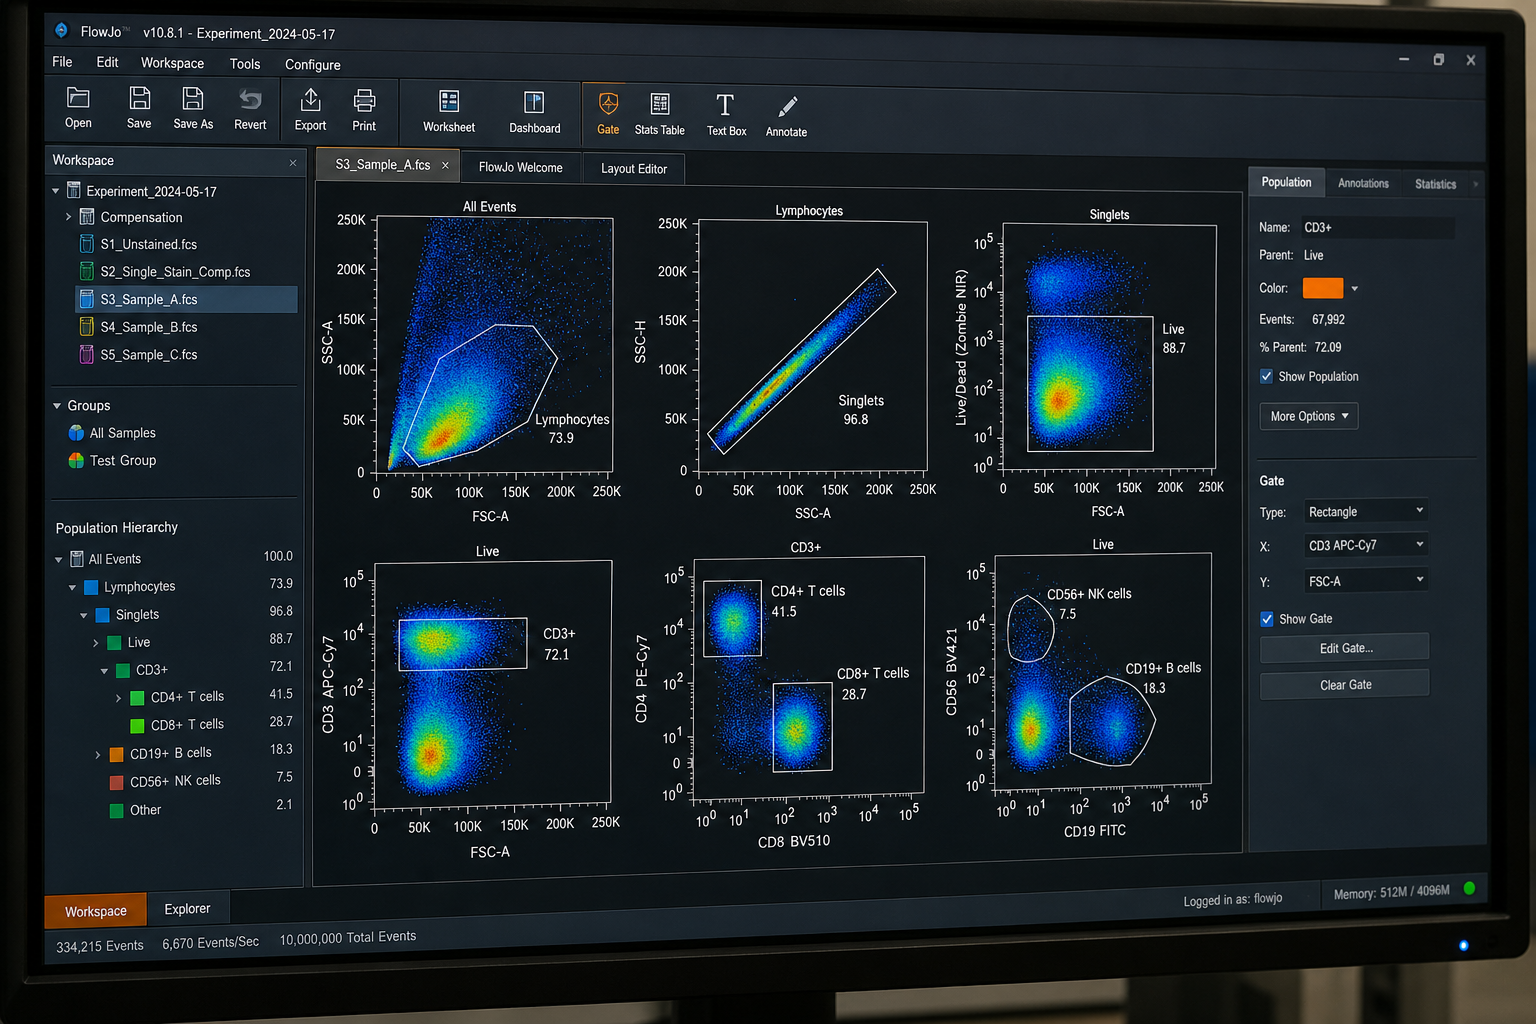
A usable dataset depends on the analysis behind it, and each step is documented so you can follow it. Deliverables are confirmed at quote and typically include:
A typical gate sequence removes doublets, debris and dead cells first, then identifies leukocytes and lymphocytes before the lineage and functional gates are applied. Event counts per gate are reported, so low-frequency populations can be judged for reliability.
Development effort should match how the data will be used. An exploratory panel for an internal go/no-go decision needs less characterization than a panel that will run across a long study with many time points.
Confirm the markers behave as expected on the intended sample matrix.
Titrate reagents, finalize controls and lock the staining protocol.
Characterize precision, sensitivity and sample stability to the level the study needs.
Record the final staining protocol and gating template so later runs stay consistent and the method can be written up as an SOP.
| Context of use | Typical characterization |
|---|---|
| Exploratory | Feasibility on the real matrix, titration, appropriate controls and a documented gating template. |
| Supportive or secondary research endpoint | The above, plus precision across runs, sample stability and a locked panel across all time points. |
| Pivotal or regulated endpoint | Requires a project-specific review of assay validation, documentation and laboratory qualifications. Feasibility and partner-laboratory availability are confirmed during scoping. |
Tell us whether your project requires exploratory research support, GLP studies or clinical-study sample analysis. We will review the assay, documentation and laboratory requirements during project scoping. Availability and suitability of a partner laboratory are confirmed before the project is accepted.
Tell us about your samples and study question, and we will scope the panel and send a quote.
Email services@bosterbio.com or call (888) 466-3604.
Share your marker list, reagent details, sample type and existing protocol. We will review whether the panel can be transferred directly or needs adaptation and feasibility work for the receiving laboratory.
Please include your analysis goals and details of the available FCS files and controls in your inquiry. We will confirm whether an analysis-only project can be supported and define the deliverables before quoting.
Deliverables are agreed before the project begins. If your team needs editable analysis workspaces in addition to FCS files, plots and summary tables, specify the software and version so availability and any additional charges can be confirmed.
Sample acceptance criteria and the handling of samples that fall outside them are agreed during scoping. This includes when processing will be paused, whether repeat work is possible, and how additional work will be authorized and charged.
Analysis measures cells and returns data; the cells are not kept for further use. Sorting uses the same optics to physically separate selected populations into collection tubes so they can be cultured, sequenced or tested functionally. Sorting is available on request through partner labs.
Pricing is quoted per project. It depends on panel size, whether a custom panel needs feasibility and optimization work, which functional assays are added, and how many samples and time points are involved. An established panel costs less than a new one that has to be developed first.
Turnaround is quoted per project. Panel development, sample numbers, the shipping schedule and the scope of analysis all affect the timeline.
Whole blood, PBMCs, tissue dissociates and cultured cells from research studies. Species, sample amounts and shipping conditions are confirmed at quote.
Yes. PBMC flow cytometry is a core part of the service, on fresh or cryopreserved cells. It covers subset immunophenotyping, activation- and exhaustion-associated markers, and functional readouts such as intracellular cytokine staining. Cell numbers, viability expectations and shipping conditions are confirmed at quote.
A standard panel covers T cells with CD4 and CD8 subsets, B cells and NK cells. It can be extended to naive, memory and effector T-cell subsets, regulatory T cells, and activation- or exhaustion-associated phenotypes. Marker choices depend on species and are confirmed at feasibility.
A receptor occupancy assay measures how much of a cell-surface target is bound by a therapeutic, using reagents that detect free receptor, total receptor, drug-bound receptor or a combination. It is a pharmacodynamic readout of target engagement. It is available on request through partner labs, and feasibility is confirmed at quote.
If your question is covered by the major immune cell subsets, an established immunophenotyping panel is usually enough and needs less development. A custom panel makes sense when the study depends on a specific marker combination, an unusual cell population or a sample type the established panel has not been tested on.
A fluorescence-minus-one (FMO) control contains every stain in the panel except one, so it shows how far spillover from the other dyes spreads into that channel. That spread is what decides where a positive gate should start. Isotype controls do not account for spillover and are not reliable for placing gate boundaries.
Whether you need one functional assay, an immunophenotyping panel for a longitudinal study or CAR-T characterization, the panel is built around your endpoints.
Request a Quote