This website uses cookies to ensure you get the best experience on our website.


- Table of Contents
Spatial Biology Services
Localize target RNA expression in tissues and cells, with study-specific assay optimization, imaging, and quantitative analysis.
Discuss Your RNA ISH StudyWe help research teams determine where target RNA is expressed, which cells express it, and how expression varies across tissue regions or study groups. Each project begins with a review of your targets, samples, and research objectives to define the assay approach and analysis plan.
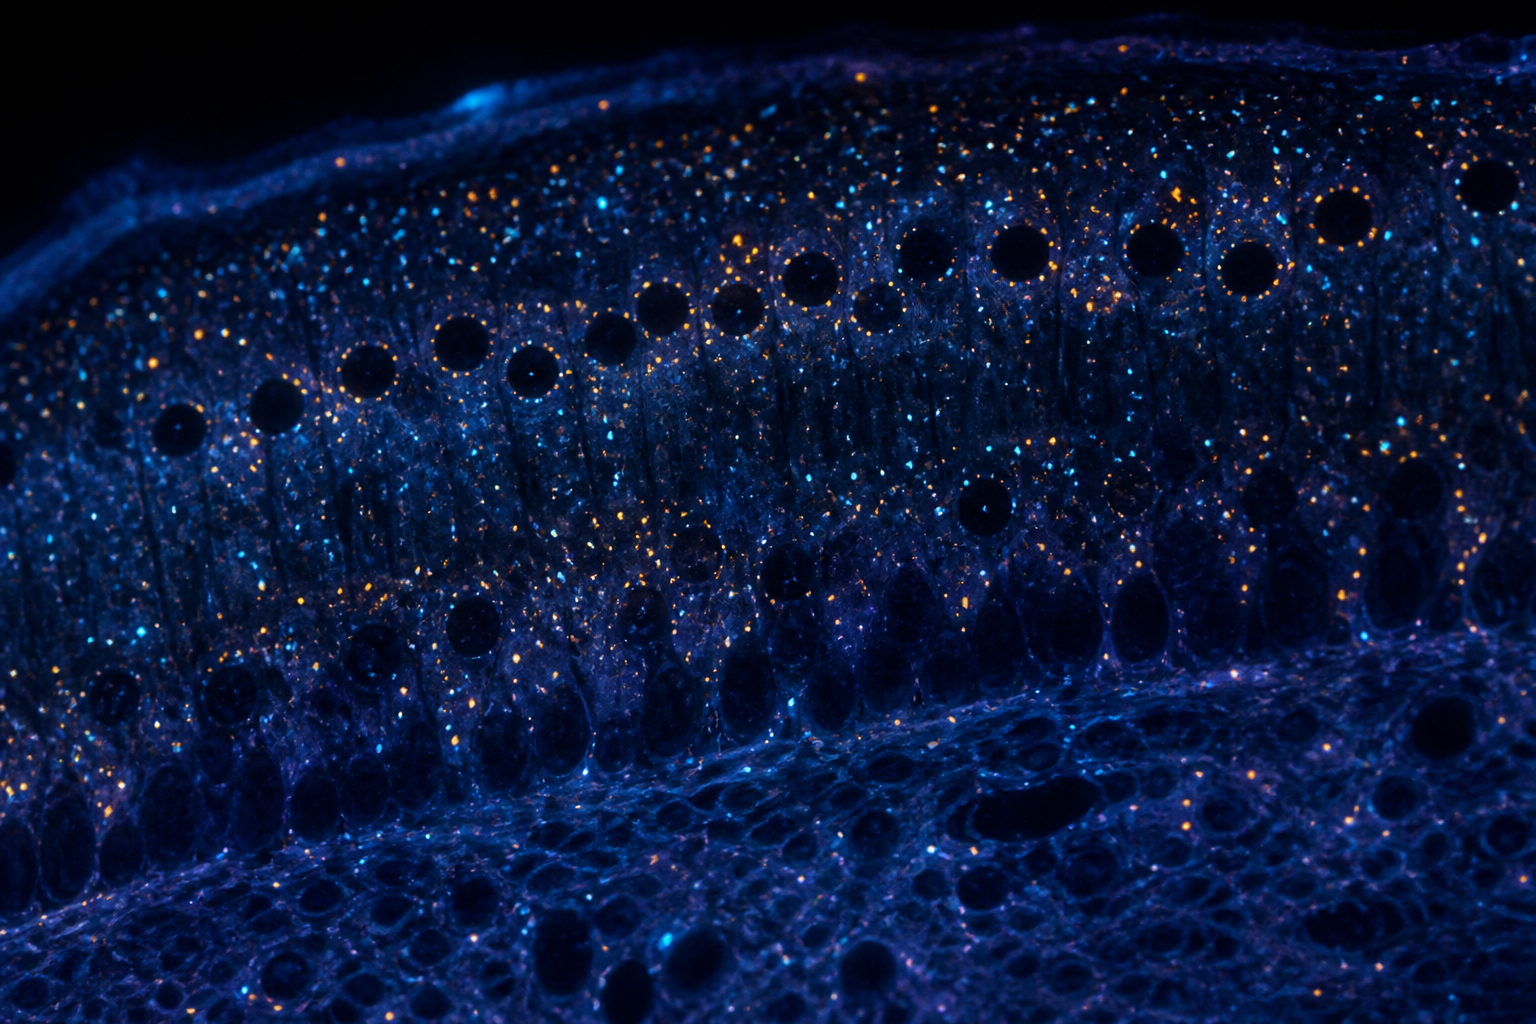
RNA in situ hybridization (RNA ISH) detects RNA inside intact cells and tissue sections, and combines spatial imaging with quantitative or semi-quantitative readouts, allowing target RNA expression to be evaluated within its tissue context. Bulk methods such as qPCR and RNA-seq report how much of a transcript a sample contains, but average across every cell in the extract; RNA ISH shows which cells carry the transcript, whether expression is uniform or restricted to a small subpopulation, and how those cells sit next to their neighbors.
Our studies are organized around the questions research teams most often need answered:
RNA ISH answers a spatial question: not simply whether a gene is detected, but where, in which cells, and at what relative level.
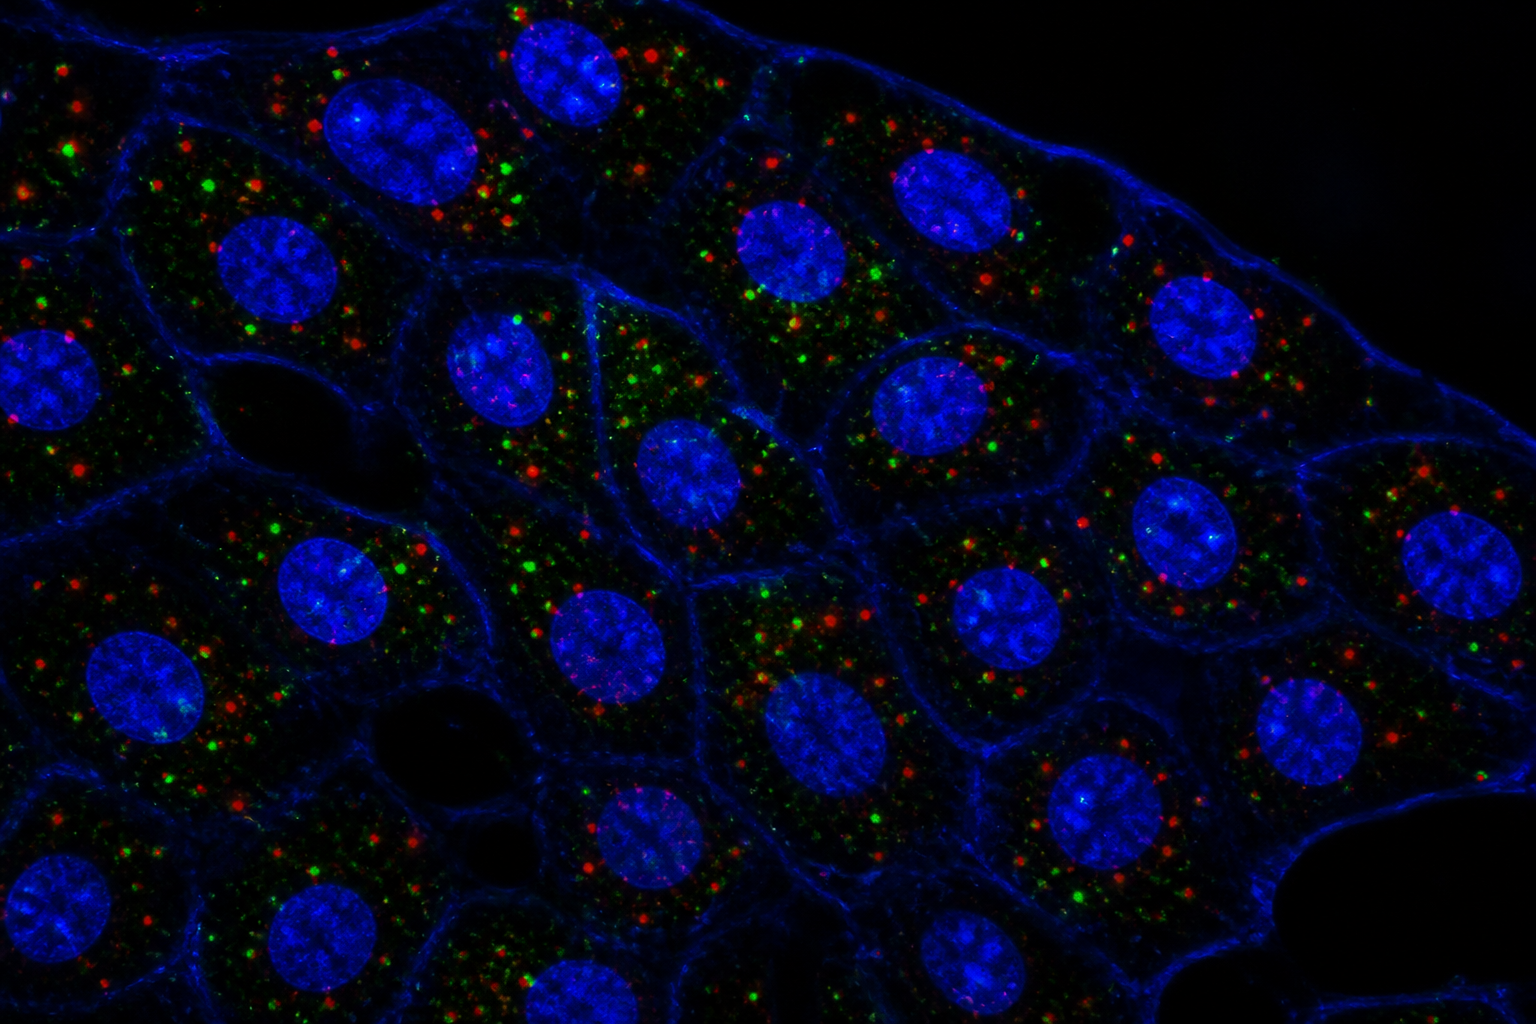
RNA ISH can be applied to a wide range of RNA targets, provided a sufficiently unique target sequence can be identified and the sample RNA is of adequate quality. Each target is reviewed for sequence suitability and sample feasibility before the study begins. The approach is especially useful where protein detection is weak or impossible.
Map cell-type markers, receptors, cytokines and low-abundance transcripts across tissue, and separate expressing from non-expressing cells in the same field.
Localize long non-coding RNAs, which have no protein to stain, and see whether they accumulate in the nucleus or cytoplasm.
Identify infected cells, distinguish genomic from messenger viral RNA when suitable probes are available, and relate infection to host-cell response.
Detect bacterial and other microbial RNA in tissue, for example to locate organisms relative to host cells and inflammation.
Confirm that transgenes, reporters, CAR constructs or edited sequences are expressed, and in which cells, after delivery or engraftment.
Secreted proteins, small peptides, new targets and poorly validated antibody targets can often be followed by their transcript instead, with the caveat that RNA is not a direct readout of protein.
An RNA signal reflects the presence and distribution of the target RNA. It does not show protein abundance or function, and a standard RNA ISH result cannot be equated with real-time transcriptional activity. When a conclusion depends on the protein, RNA detection can be paired with protein detection in the same section where feasible (RNA-protein co-detection) rather than inferring one from the other.
Each project is scoped around your target, sample and research objective. A typical study can include the stages below.
Review of species, tissue, fixation history, block age and section quality to judge whether the RNA in your material is likely to support interpretable results.
A small pilot to tune tissue pretreatment and confirm target and control performance before proceeding with the full sample set.
RNA ISH staining of study slides alongside positive and negative controls, using the approach selected during feasibility assessment.
Brightfield or fluorescence imaging with acquisition settings defined from the controls and applied consistently across the slides being compared.
Cell segmentation and signal counting or scoring with documented, fixed criteria, producing per-cell or per-area readouts suited to the question.
A written report describing methods, quality-control findings, results and the limitations that matter for interpreting them.
Your proposal will specify the assay method, sample requirements, deliverables, timeline, and any work performed by external laboratories.
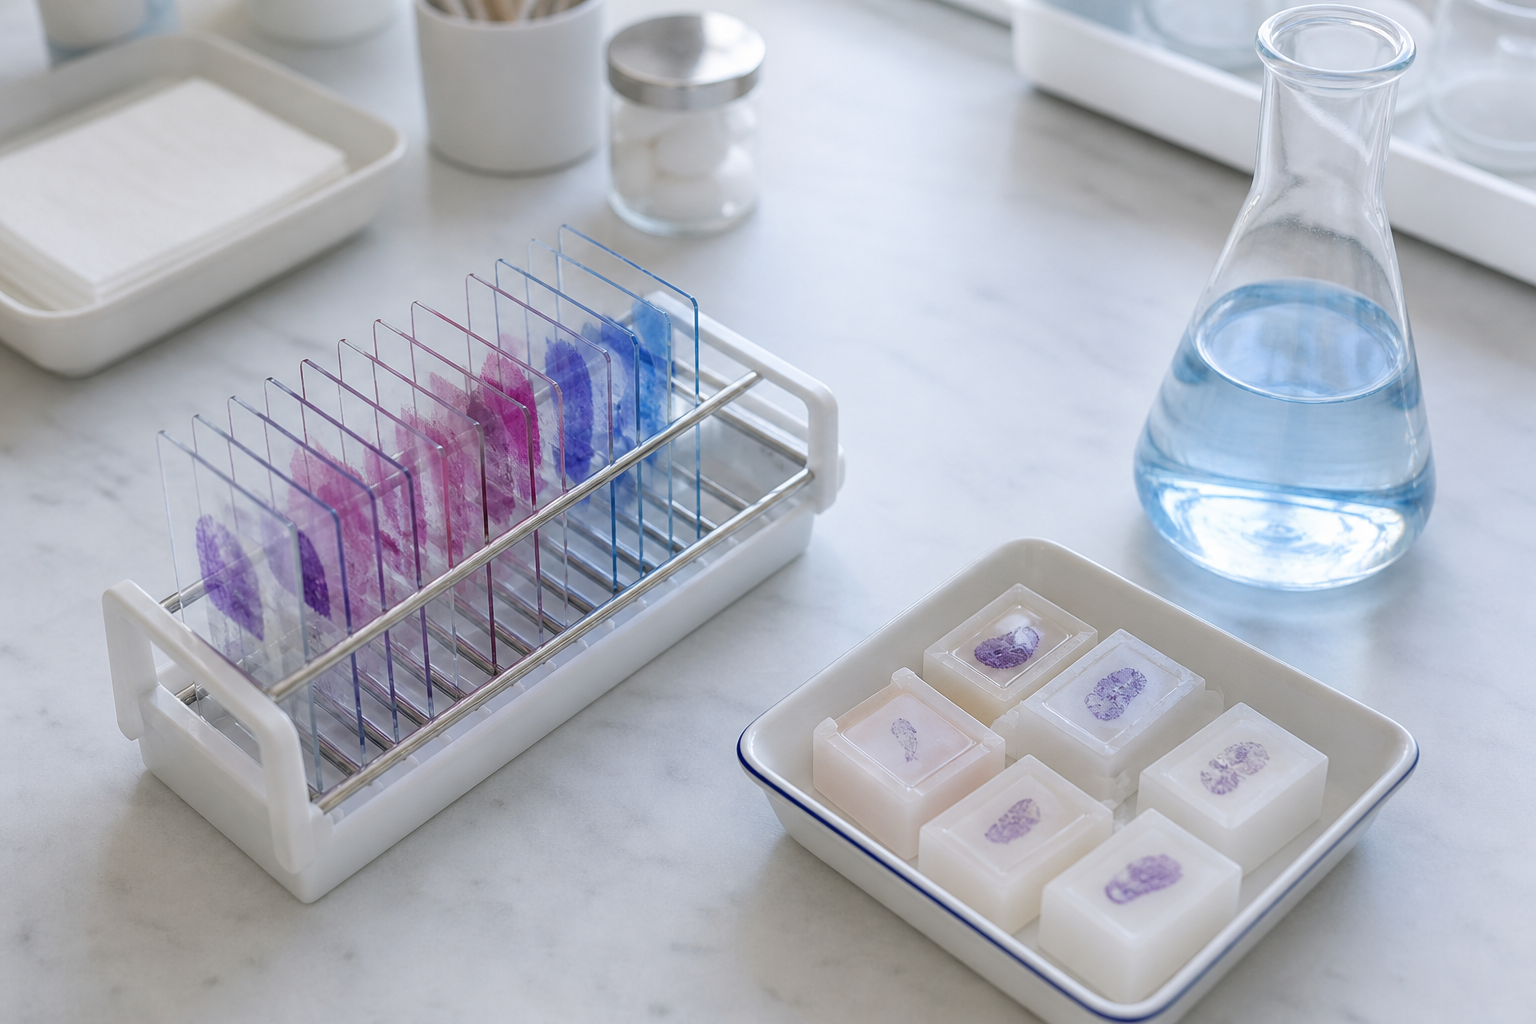
RNA ISH methods are widely used because they work on the sample types real studies depend on. Commonly supported preparations include the following. The tissues, species and fixation conditions supported for your project are confirmed during feasibility assessment.
FFPE: fixation time matters. Under-fixed tissue can lose RNA and over-fixed tissue can resist probe access, so the pretreatment steps may need adjusting. Manufacturer guidance for FFPE generally specifies fresh neutral buffered formalin for a defined fixation window; the relevant technical note for the method used gives the current figures. Fresh-frozen: keep sections cold until fixation on the slide, and expect morphology to be less crisp than FFPE.
Assay validation: for any sample type, validation includes positive and negative control probes on the same tissue before targets of interest are interpreted.
Every new tissue type, species, decalcification step or fixation protocol benefits from a short pilot with positive and negative control probes. A pilot uses a few slides and can prevent a whole cohort being run on RNA that was already degraded.
Studies move through four stages so that decisions about target, sample and method are made on evidence before the full experiment is run.
We review your target, species, sample type and objective, check target sequence suitability and sample quality risks, and recommend an approach.
A pilot on representative material, with positive and negative controls, confirms that the assay performs and fixes the conditions to be used.
Study slides are stained and imaged under the locked conditions, with controls processed alongside the samples being compared.
Images are analyzed with predefined criteria and results are documented with methods, quality-control findings and limitations.
Timelines depend on the target, the number of samples and the readout, and are set out in the project proposal.
Each study is designed with appropriate positive and negative controls. Sample suitability, assay performance, imaging settings, and analysis criteria are assessed before full study execution. Reports document the methods, quality-control findings, and limitations relevant to interpretation.
An RNA ISH run is hard to interpret without controls on the same tissue, processed in the same run.
Standard pretreatment is a good starting point, but tissues differ in fixation history, density and protease sensitivity. Pretreatment conditions are adjusted to balance signal detection and tissue morphology, the control panel is repeated after each change, and the conditions are locked before the full study begins. Results are interpreted only when the relevant controls meet predefined acceptance criteria.
Imaging parameters are established using appropriate controls to assess background and avoid signal saturation. Consistent acquisition settings are applied across samples intended for comparison.
Signal is counted or scored with a documented analysis method chosen for the specific assay, the signal characteristics and the research objective. No single scoring table applies to every RNA ISH method, so assay-specific guidance is not transferred between methods. Analysis is applied blind to condition where possible, and the method is reported alongside the result. For larger studies, software segments nuclei, assigns signal to cells and reports counts per cell or per area; segmentation is reviewed across representative tissue regions and signal levels, and parameters are kept fixed across slides rather than tuned separately for each image.
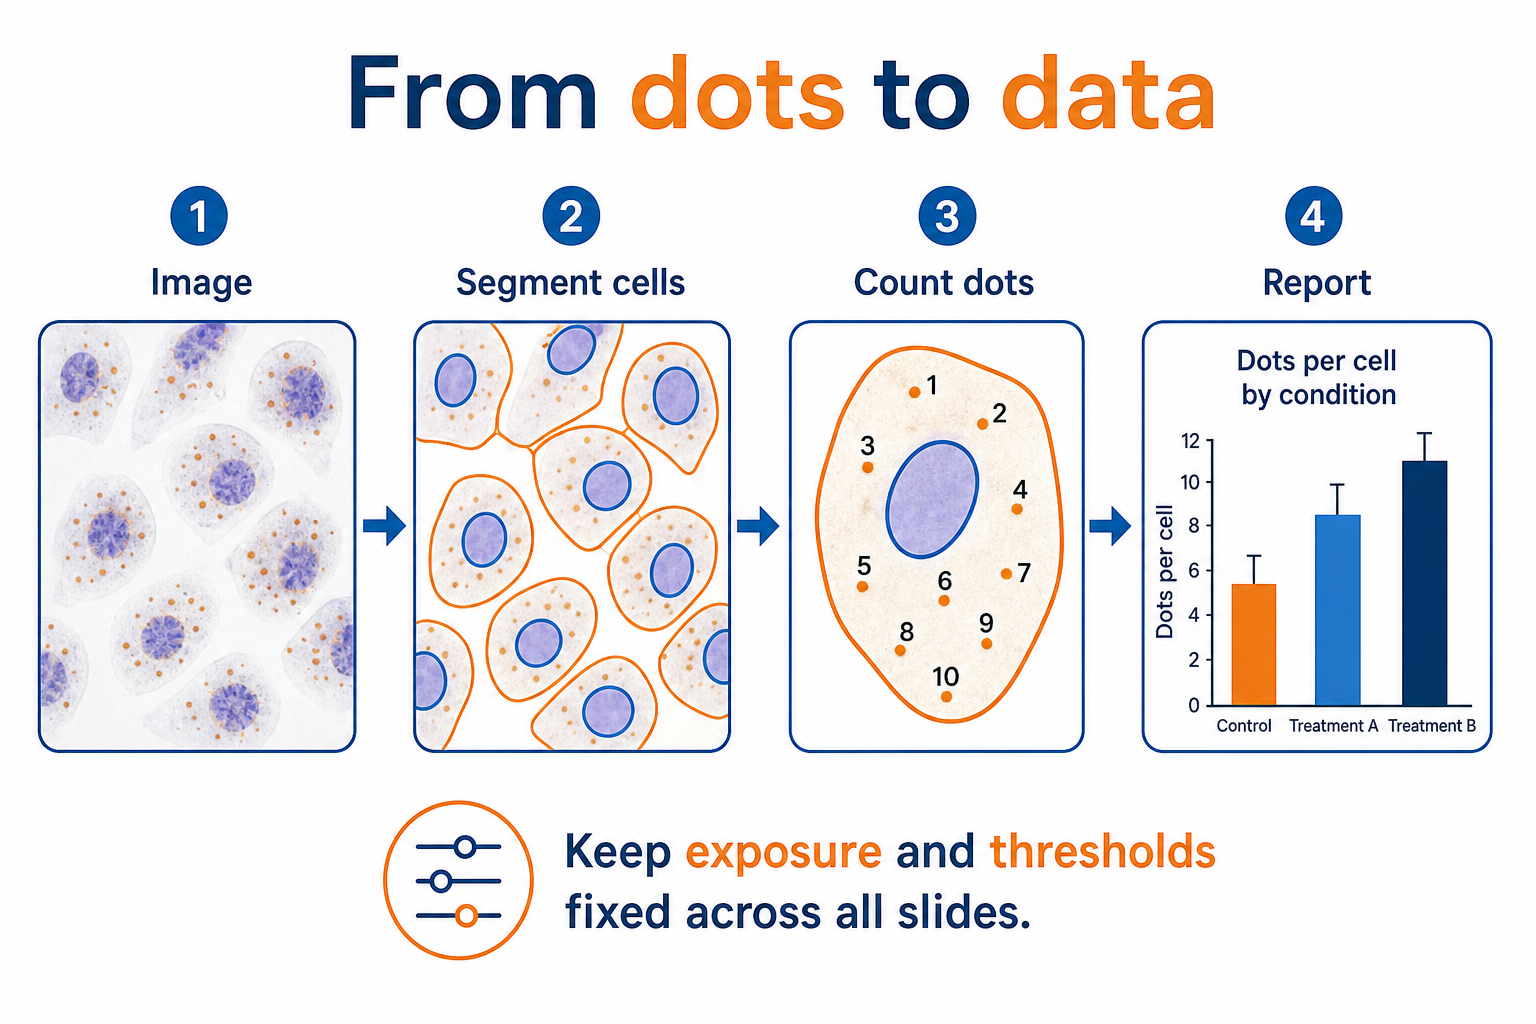
In a well-optimized assay on suitable tissue, discrete punctate signals can often be resolved, and counts per cell can serve as a proxy for relative RNA abundance. Whether a given dot corresponds to a single RNA molecule depends on the method, section thickness, magnification, probe design and the controls run alongside, so it is verified for the assay in use rather than assumed. For highly expressed transcripts, signals overlap into clusters that cannot be separated, and counts then underestimate true abundance. Weak diffuse haze across the section is usually background, not expression.
RNA ISH is especially strong at qualitative and spatial conclusions: this cell type expresses the target, this region does not, these two transcripts are found in the same cells. It supports relative comparisons well when sections are processed together under the same settings. It is a weaker tool for absolute copy-number claims across different runs, tissues or fixation histories, and for such claims an orthogonal method is a sensible companion.
A good run shows a clear positive control signal in the expected cell types and a clean negative control. Results are interpreted only when the relevant controls meet predefined acceptance criteria. The scope of controls applied to each project is defined in the proposal.
Depending on the agreed scope, deliverables may include:
Whole-slide scans, raw image files and cell-level data are provided only when they are part of the agreed scope.
Assay selection depends on the target sequence, sample preservation, number of targets, and intended readout. We review these factors during feasibility assessment and specify the proposed method in the study proposal.
Target-specific probes hybridize to complementary RNA sequences in the sample. Depending on the assay, signals are detected directly or through amplification. Probe specificity, tissue pretreatment and background are evaluated with appropriate controls before study results are interpreted.
A typical workflow includes sample preparation, tissue pretreatment, probe hybridization, signal detection, imaging and analysis. Conditions are selected for the sample and assay rather than transferred unchanged between methods. Your proposal defines the method, controls and outputs for the study.
Commonly supported preparations include FFPE tissue sections, fresh-frozen sections, fixed-frozen sections, and cultured cells or cytospins. The tissues, species and fixation conditions supported for your project are confirmed during feasibility assessment.
Share your target, species, sample preparation, approximate sample count, and research objective. Fixation details, block age and the comparisons you need to make also help us assess target sequence suitability, sample quality risks and an appropriate study approach.
Often, yes. FFPE sections are the most common sample type for RNA ISH, but results depend on fixation history, block age and RNA preservation. Control probes are run on the same tissue to help assess RNA preservation and assay performance, and pretreatment conditions are adjusted to balance signal detection and tissue morphology.
Studies are designed with positive and negative controls processed on the same tissue and in the same run. Results are interpreted only when the relevant controls meet predefined acceptance criteria. The controls applied to each project are defined in the study proposal.
Depending on the agreed scope, deliverables may include digital images of the agreed sections or regions of interest, positive and negative control results with quality-control observations, quantitative outputs such as signal counts or positive-cell percentages, a methods summary, and a study report presenting findings and limitations.
Timelines depend on the target, the number of samples, the need for optimization and the intended readout. Staining of a manual assay run typically takes one to two working days, with imaging, analysis and reporting on top. The proposal sets out the timeline for your study.
Share your target, species, sample preparation, approximate sample count, and research objective. Our team will assess feasibility and recommend a study approach, control strategy, and analysis plan suited to your project.
Discuss Your RNA ISH StudyFor research use only. Not for use in diagnostic procedures.
For research use only. Not for use in diagnostic procedures.