This website uses cookies to ensure you get the best experience on our website.


- Table of Contents
FROM METABOLITE DISCOVERY TO QUANTIFICATION
Untargeted, targeted and semi-targeted metabolite profiling by LC-MS/MS and GC-MS, scoped to your sample type and research question.
Explore Our ServicesBoster Bio runs metabolomics projects with its partner labs, from study design through LC-MS/MS and GC-MS analysis to a processed, annotated dataset. The right workflow depends on your sample matrix, the metabolite classes you care about, and whether you need broad discovery or quantification of a defined panel. The sections below describe what each option covers so you can scope a study before you send samples.
Our metabolomics services cover targeted quantification, discovery profiling, lipidomics, custom panels, isotope tracing and drug metabolism support, with matrix-appropriate preparation and clearly documented results.
Untargeted analysis surveys as much of the metabolome as the method can detect. Targeted analysis measures a defined list of compounds against reference standards. Semi-targeted analysis profiles a curated metabolite panel, usually with relative or semi-quantitative reporting. Which one fits depends on your research question.
| Modality | Research objective | Typical output | Quantification | Best suited to |
|---|---|---|---|---|
| Untargeted metabolomics | Find metabolic changes without prior assumptions | Many detected features, a subset annotated to known metabolites | Relative, based on peak intensity | Hypothesis generation, biomarker discovery, exploratory group comparisons |
| Targeted metabolomics | Measure a predefined list of metabolites | A fixed panel of identified, quantified compounds (e.g., amino acids, bile acids) | Absolute with analyte-specific calibration; otherwise relative or semi-quantitative | Biomarker validation and pathway-focused studies |
| Semi-targeted metabolomics | Cover a broad, curated metabolite library | A curated metabolite panel with reported annotation confidence | Generally relative | Studies that need wide coverage with fewer unannotated features |
Many projects start untargeted to find candidate metabolites or pathways, then move to a targeted panel to confirm and quantify them. If you already know the pathway or compound class you care about, start targeted. If you are not sure which metabolites matter, start untargeted. Semi-targeted is worth discussing when you want broader coverage than a fixed panel and can accept a curated rather than exhaustive library.
Targeted metabolomics services measure a defined analyte panel. Analyte-specific reference standards and calibration curves support absolute quantification.
Calibration curves convert signal into concentration, supporting comparisons across groups and timepoints using consistent methods and quality controls.
Common panels cover amino acids, bile acids, fatty acids and central carbon intermediates. If your list is different, see custom panels.
Reports document calibration range, quality-control sample performance and any analyte that fell outside the quantifiable range in your matrix.
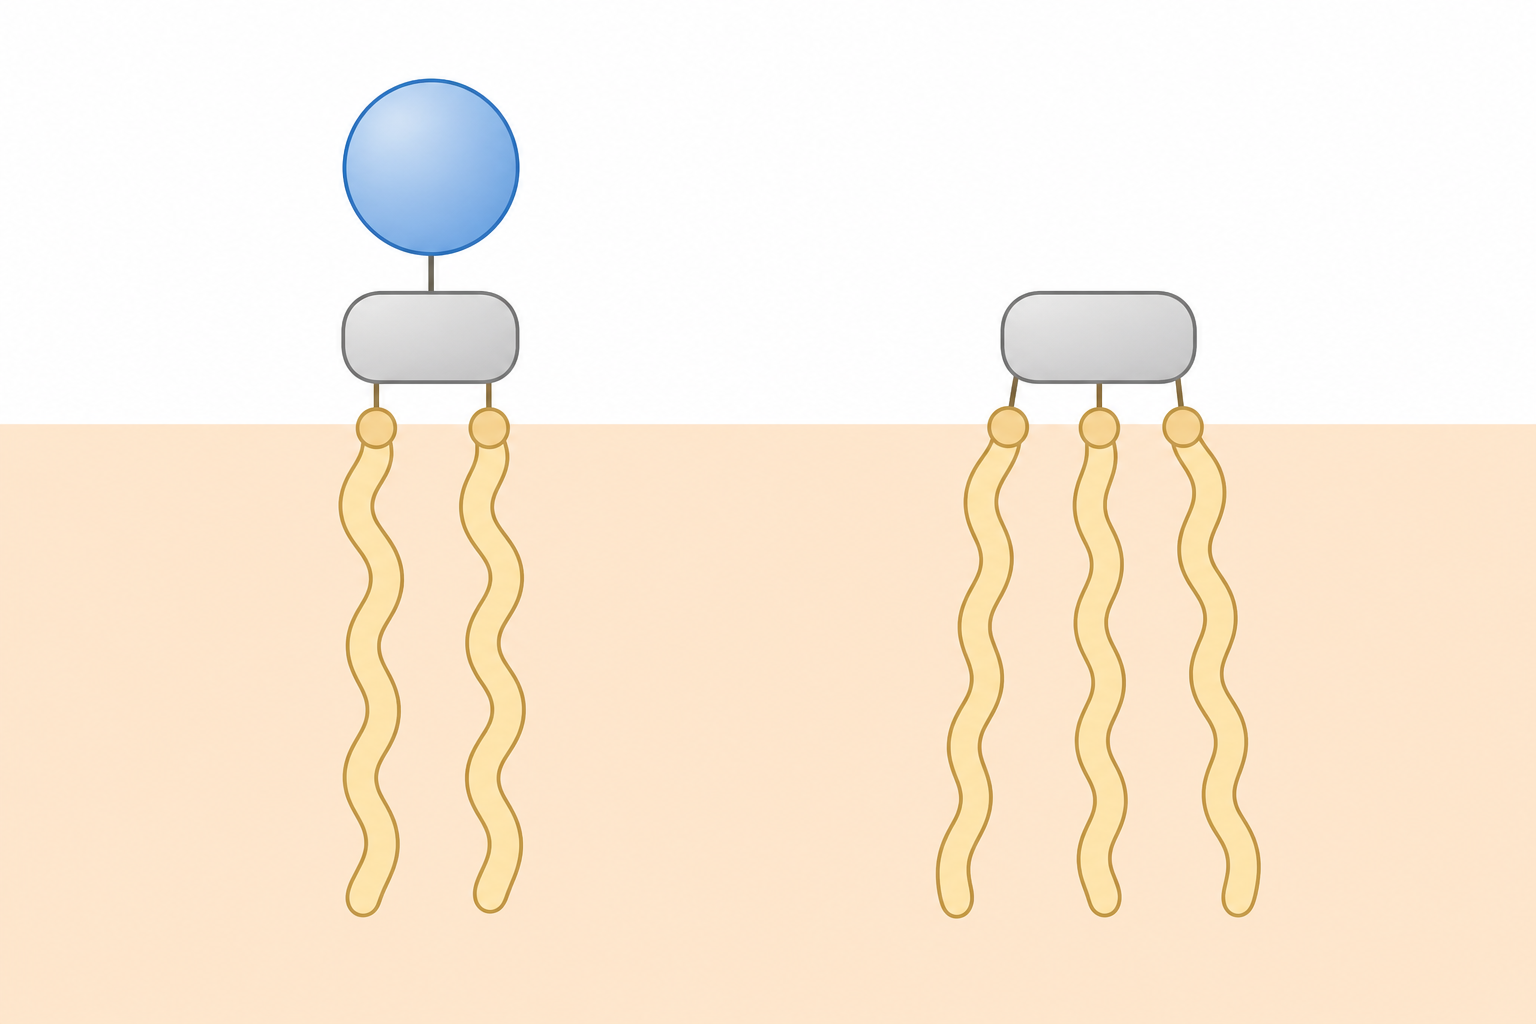
Specialized workflows improve coverage of lipids, bile acids and other metabolite classes.
Lipidomics workflows combine lipid-specific extraction, reversed-phase or HILIC separation, and MS/MS analysis to characterize lipid classes and, where supported, fatty acyl composition. Other specialized panels include:
Bile acid isomers can share the same mass, so reliable differentiation requires suitable chromatographic separation and reference standards.
When a metabolite class, matrix or sensitivity requirement falls outside standard panels, custom method development is available on request.
Review of target compounds, expected concentration range, and whether an existing method can be adapted.
Testing recovery and interference in your sample type, since extraction efficiency and background vary by matrix.
Optimizing chromatography, MS transitions and extraction chemistry for the target analytes in your matrix.
Assessing calibration range, accuracy, precision, recovery, matrix effects and carryover against project requirements before sample analysis.
Custom work is scoped per project. Send the compound list, the matrix and the concentration range you expect, and we will say whether an existing method can be adapted or a new one is needed.
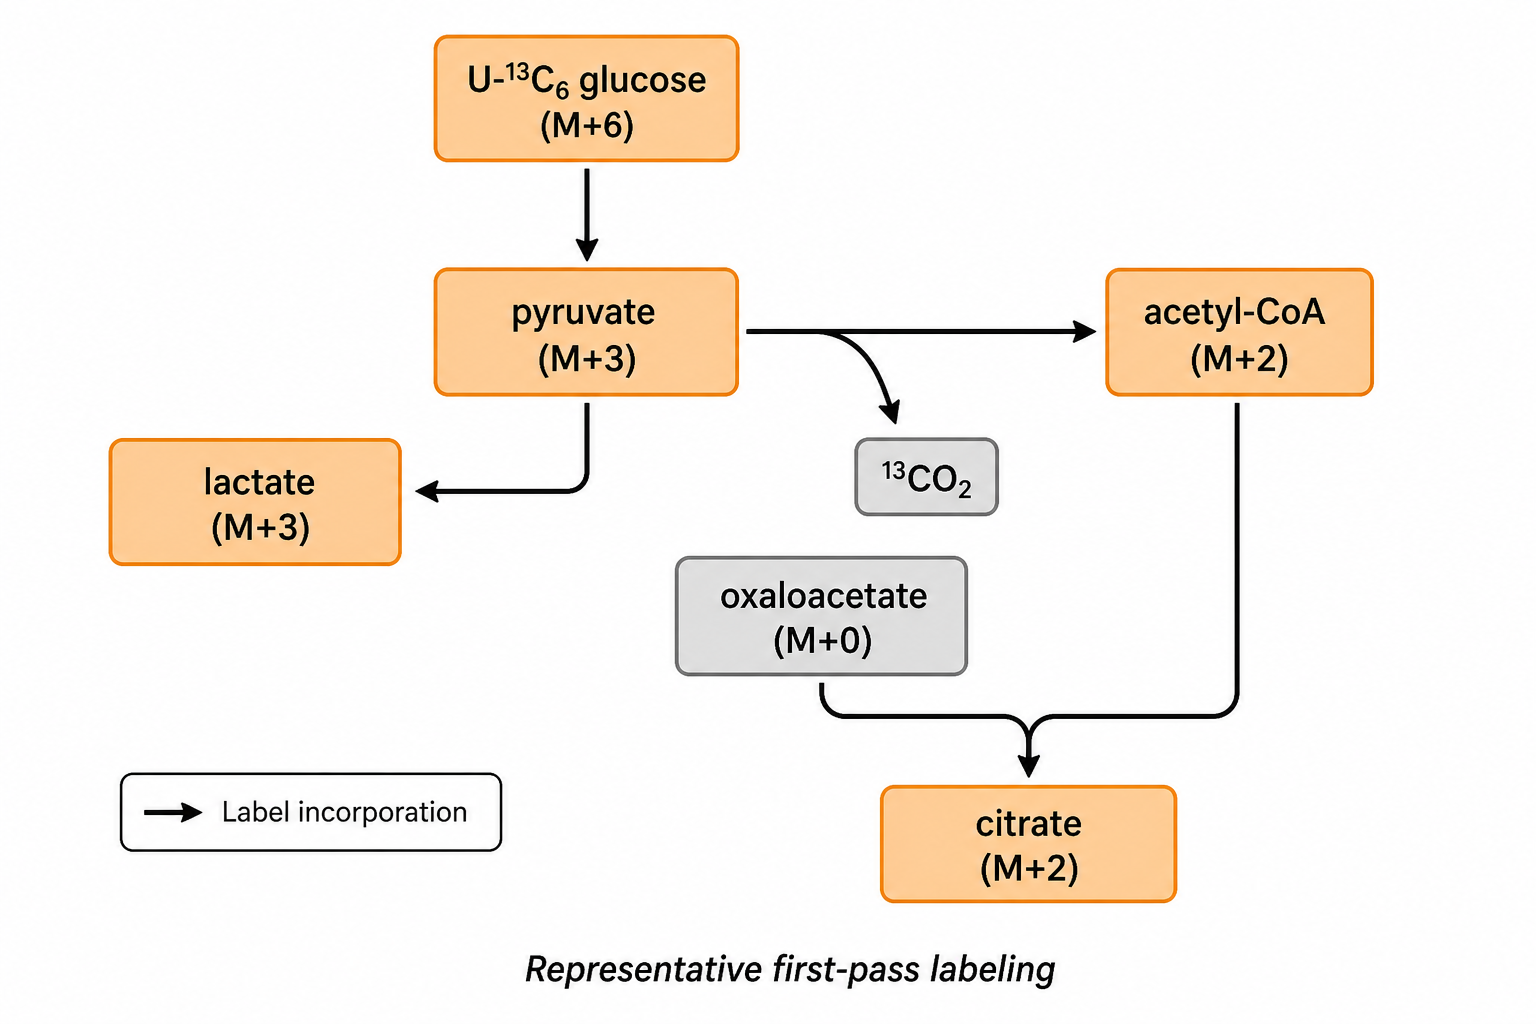
Standard metabolomics profiles metabolite abundances at collection. Stable-isotope tracing adds information on relative pathway activity: cells or tissue are given a labeled substrate, and mass spectrometry follows the label into downstream metabolites.
Two samples can have similar metabolite levels but different pathway activity. Time-course isotope tracing helps investigate these differences; quantitative flux analysis requires a dedicated study design.
Tracing studies are available on request and are usually scoped alongside standard targeted or untargeted profiling. Describe your model and substrate in the inquiry form and we will confirm feasibility at quote.
No single instrument covers the whole metabolome. LC-MS/MS and GC-MS suit different chemical properties, and many projects use both.
| Platform | Well suited to | Typical role |
|---|---|---|
| LC-MS/MS (triple quadrupole) | Polar and semi-polar metabolites, lipids, bile acids, most targeted panels | Sensitive, specific quantitation by multiple-reaction monitoring |
| High-resolution LC-MS | Broad detection across polarity ranges | Untargeted discovery, accurate-mass feature detection, MS/MS-based annotation |
| GC-MS | Volatile and derivatizable compounds such as sugars and some amino acid derivatives | Library matching against established spectral databases; complements LC-based coverage |
High-resolution instruments record accurate mass across a wide range, which suits discovery. Triple quadrupole instruments monitor selected transitions, which suits quantifying a known list. A project that needs both typically runs discovery on the first and follow-up quantitation on the second.
Every platform and method detects a subset of the metabolome, set by polarity, volatility, ionization efficiency and concentration range. Untargeted reports list total detected features separately from features annotated against a spectral library, because the two carry very different levels of certainty.
Extraction and cleanup are adapted to the matrix. A protocol built for plasma will not perform the same way on feces or tissue homogenate without re-optimization.
Method selection follows the matrix too. Salt-rich urine, protein-rich plasma and lipid-rich tissue each call for different cleanup, and a sample with very limited volume may support a smaller panel than a larger one. If your matrix is unusual, describe it in the inquiry and we will confirm the approach before you collect.
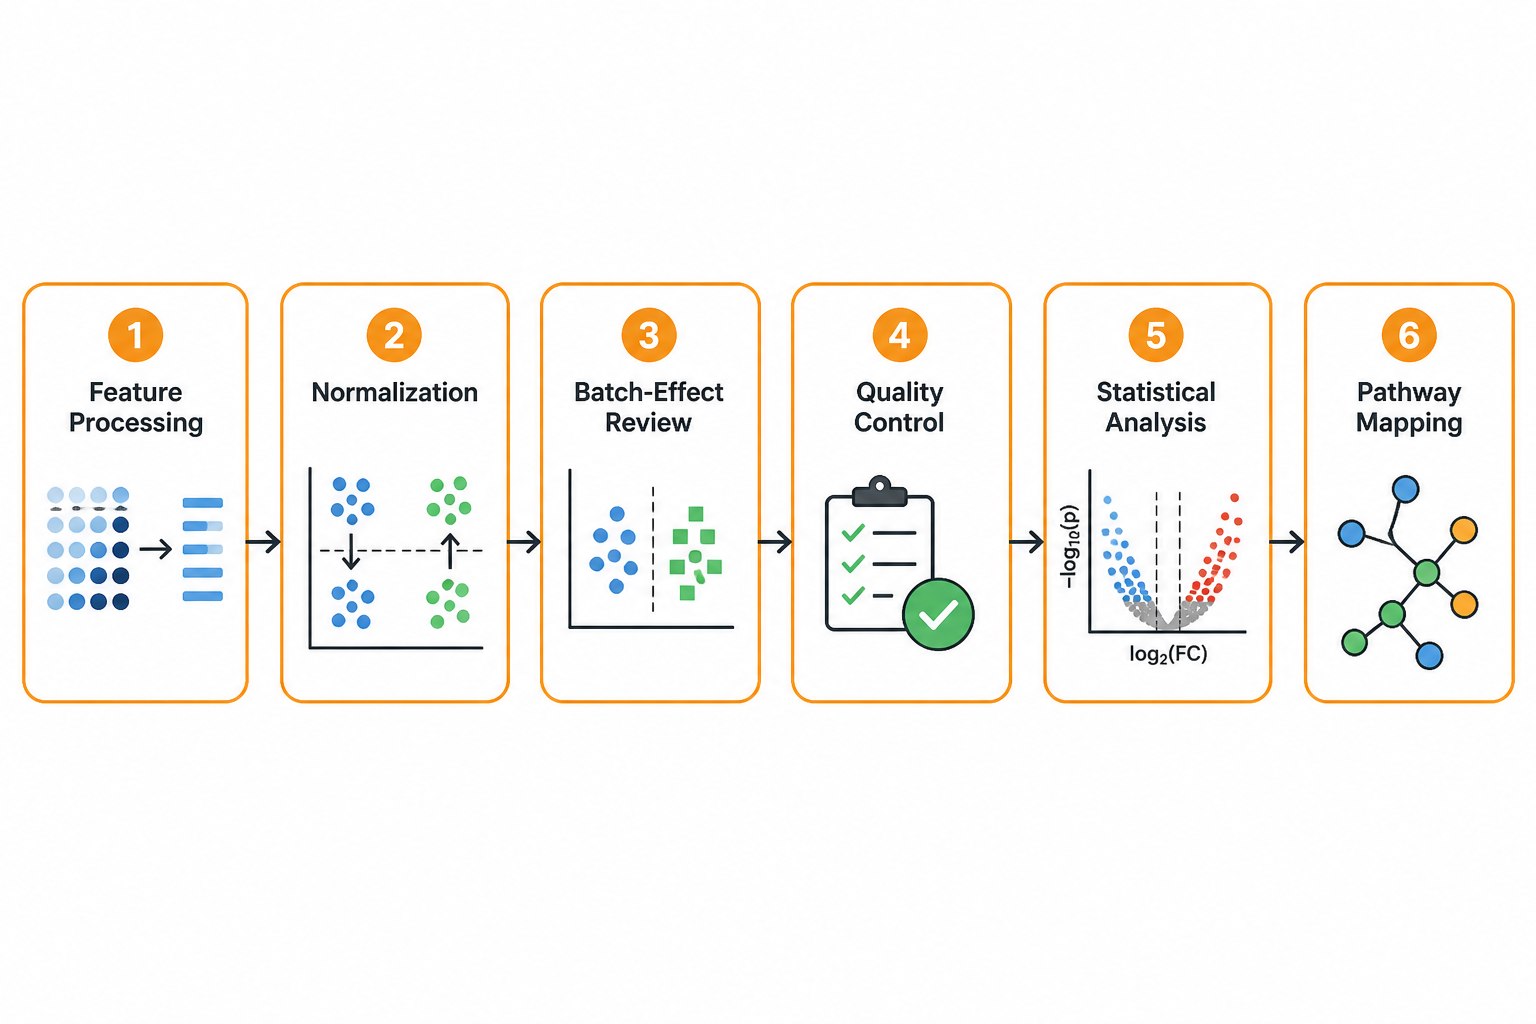
Raw mass spectrometry files go through a defined processing pipeline before you receive results.
Deliverables typically include raw instrument files, a processed data matrix, QC documentation, statistical summaries and a written interpretation of the findings. The exact scope is confirmed at quote. For multi-omics studies, combine metabolite profiling with discovery proteomics and transcriptomic analysis through our NGS services.
"Identified" covers a range of confidence in metabolomics, and each reported metabolite carries its level.
| Level | Basis | What it means for you |
|---|---|---|
| Confirmed identity | Matches an authentic standard in retention time and MS/MS spectrum under the same analytical conditions | Highest confidence; suitable for quantitative reporting and publication |
| Putatively annotated compound | Matches a spectral library (accurate mass + MS/MS) without confirmation against an authentic standard under the same analytical conditions | Good confidence in identity, not confirmed against a standard |
| Putatively characterized class | Spectral or chemical features suggest a compound class | Useful for hypothesis generation; identity within the class is uncertain |
| Unknown feature | Detected and reproducible, but no library or standard match | May still be biologically meaningful and worth targeted follow-up |
These tiers mirror the reporting levels commonly used in the metabolomics literature. Annotation and confirmed identification are not the same thing: annotation says a library match is plausible, while confirmation needs retention-time matching and an MS/MS spectrum against an authentic standard run under the same conditions. For lipids, MS/MS fragments can often assign class and sum composition, while the exact position of double bonds or acyl chains may remain unresolved.
Many features in an untargeted dataset fall in the lower-confidence tiers. When a finding matters to your conclusions, confirm it with an authentic standard in a targeted follow-up.
For drug discovery programs, LC-MS/MS measurement of a candidate compound and its metabolites is available on request.
Quantitative reports state calibration ranges, sample matrices and collection timepoints, and flag analyte results outside the quantifiable range. GLP and other quality requirements are confirmed for each project before quotation. To pair it with compound activity data, see our compound screening services. For larger compound libraries, explore our high-throughput screening services.
Study design choices made before sample collection, such as cohort size, timepoints and sample handling, have a large effect on data quality.
Measuring compound effects on metabolic pathways and looking for mechanism-of-action signals. Complement metabolite profiling with cell-based assays to assess cellular responses and viability.
Untargeted screening to find candidates, then targeted panels to confirm them in independent sample sets. Protein-level follow-up is available through our assay services and multiplex assay services.
Profiling metabolic changes in cell and animal models to study disease pathways, and carrying candidate metabolites forward into larger sample sets. For immunometabolism studies, flow cytometry can characterize immune-cell populations alongside metabolite profiles.
Profiling microbial and host-microbial co-metabolites in fecal and biofluid samples.
Characterizing dietary intervention effects with amino acid, lipid and central carbon panels, and profiling metabolites in plant, feed or food-related samples.
Looking for metabolic perturbations associated with compound exposure in preclinical models, as a complement to standard safety endpoints.
Design errors are hard to correct after collection, so we recommend a design consultation before sampling. It covers cohort size, timepoints, balancing study groups across batches and randomizing processing and injection order to reduce batch effects, and whether the intended matrix and amount will support the chosen panel.
A metabolite profile can shift within minutes of improper handling. The guidance below is a starting point; matrix- and panel-specific requirements are confirmed before collection.
| Sample type | Collection and storage | Typical starting amount |
|---|---|---|
| Plasma / serum | Separate plasma promptly or allow serum to clot before separation; aliquot, freeze and store at −80°C. Avoid repeated freeze–thaw cycles. | ~100–200 µL per assay |
| Urine | Aliquot promptly and freeze at −80°C | ~500 µL–1 mL |
| Cells | Follow the agreed harvesting and quenching protocol; retain the metabolite-containing fraction and freeze promptly. | 1–5 million cells per replicate |
| Tissue | Snap-freeze promptly after collection; avoid thawing during weighing or aliquoting. | ~20–50 mg |
| Culture media | Collect at defined timepoints, centrifuge to remove cells and debris, freeze supernatant | ~200–500 µL |
| Extracts | Confirm extraction solvent compatibility with the intended platform before submission | Panel-dependent |
Ship frozen samples on dry ice. Follow the project-specific collection and shipping instructions provided before submission.
Projects follow the same sequence whatever the panel or platform; the depth of each step scales with the study.
Defining the biological question, choosing a modality, and reviewing matrix, cohort size and sample logistics. Scope and pricing are quoted per project.
Checking sample integrity, amount and labeling against the submission manifest before extraction.
Matrix-appropriate extraction, then LC-MS/MS and/or GC-MS analysis with QC and calibration samples interspersed.
Processing, QC, statistics, identification and pathway analysis as described in the data analysis section above.
Raw instrument files, a processed data matrix with metabolite annotations and confidence levels, QC documentation, statistical outputs and a summary report.
You may be comparing metabolomics companies, a university metabolomics core, or a mix of the two. The questions below apply to any metabolomics service you are considering, including ours.
Both a university metabolomics core and a commercial provider can support discovery and targeted studies. Compare matrix experience, method capabilities, turnaround, deliverables and project support to find the best fit.
No. Some features remain unannotated, and one metabolite can generate multiple signals. Reports distinguish detected features from annotated metabolites and state the confidence of each annotation.
Metabolomics measures metabolite abundances, which can suggest changes in pathways. Stable-isotope tracing follows labeled nutrients through metabolism to investigate pathway activity. Quantitative flux analysis requires a dedicated study design.
Tell us your research question, sample type and sample count, and we will recommend a modality, platform and sample plan.
Discuss Your ProjectSend us a few details about your study and we will reply with a scope and quote.
Email services@bosterbio.com or call (888) 466-3604.