This website uses cookies to ensure you get the best experience on our website.


- Table of Contents
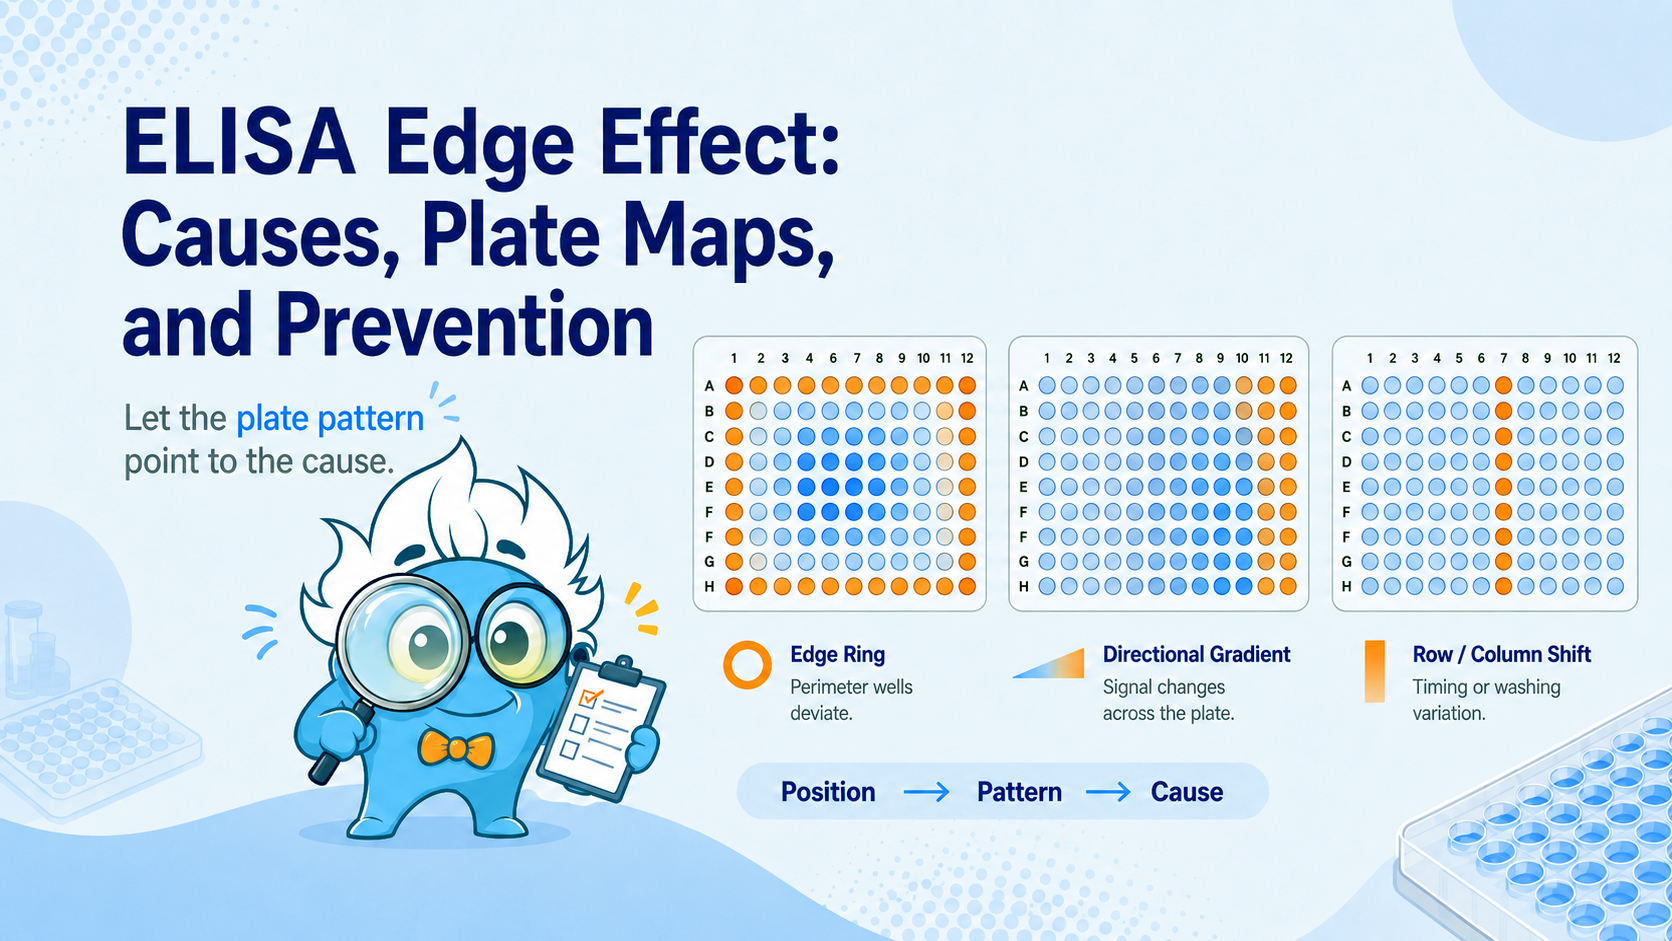
Why outer wells read high or low, how to recognize positional bias, and what to change before the next plate.
You finish an ELISA, review the optical density values, and notice that the outer wells do not behave like the center. Rows A and H may read higher, columns 1 and 12 may read lower, or the four corner wells may show the largest shift. The immediate question is whether the result reflects biology, evaporation, temperature, washing, dispensing order, or another plate-related artifact.
This position-dependent variation is commonly called the ELISA edge effect. It is not defined by one direction of change: outer wells can read either higher or lower than inner wells. The more useful clue is a repeatable spatial pattern that follows well position rather than sample identity. This guide explains how to recognize that pattern, distinguish it from other artifacts, test likely causes, design diagnostic plate maps, and reduce its impact on ELISA data.
Quick Answer
An ELISA edge effect is a systematic difference between peripheral and central wells. A complete outer ring, stronger corner deviations, or a repeatable edge-to-center gradient supports positional bias. High or low OD alone does not identify the cause; review the plate pattern and confirm it with controlled QC placement.
The clearest way to recognize an edge effect is to map raw OD values to their physical well positions before relying on calculated concentrations. Typical signs include:
The direction can vary by assay. Some plates show a high-OD perimeter, while others show lower edge values. Position dependence and reproducibility are more informative than the direction of the shift.
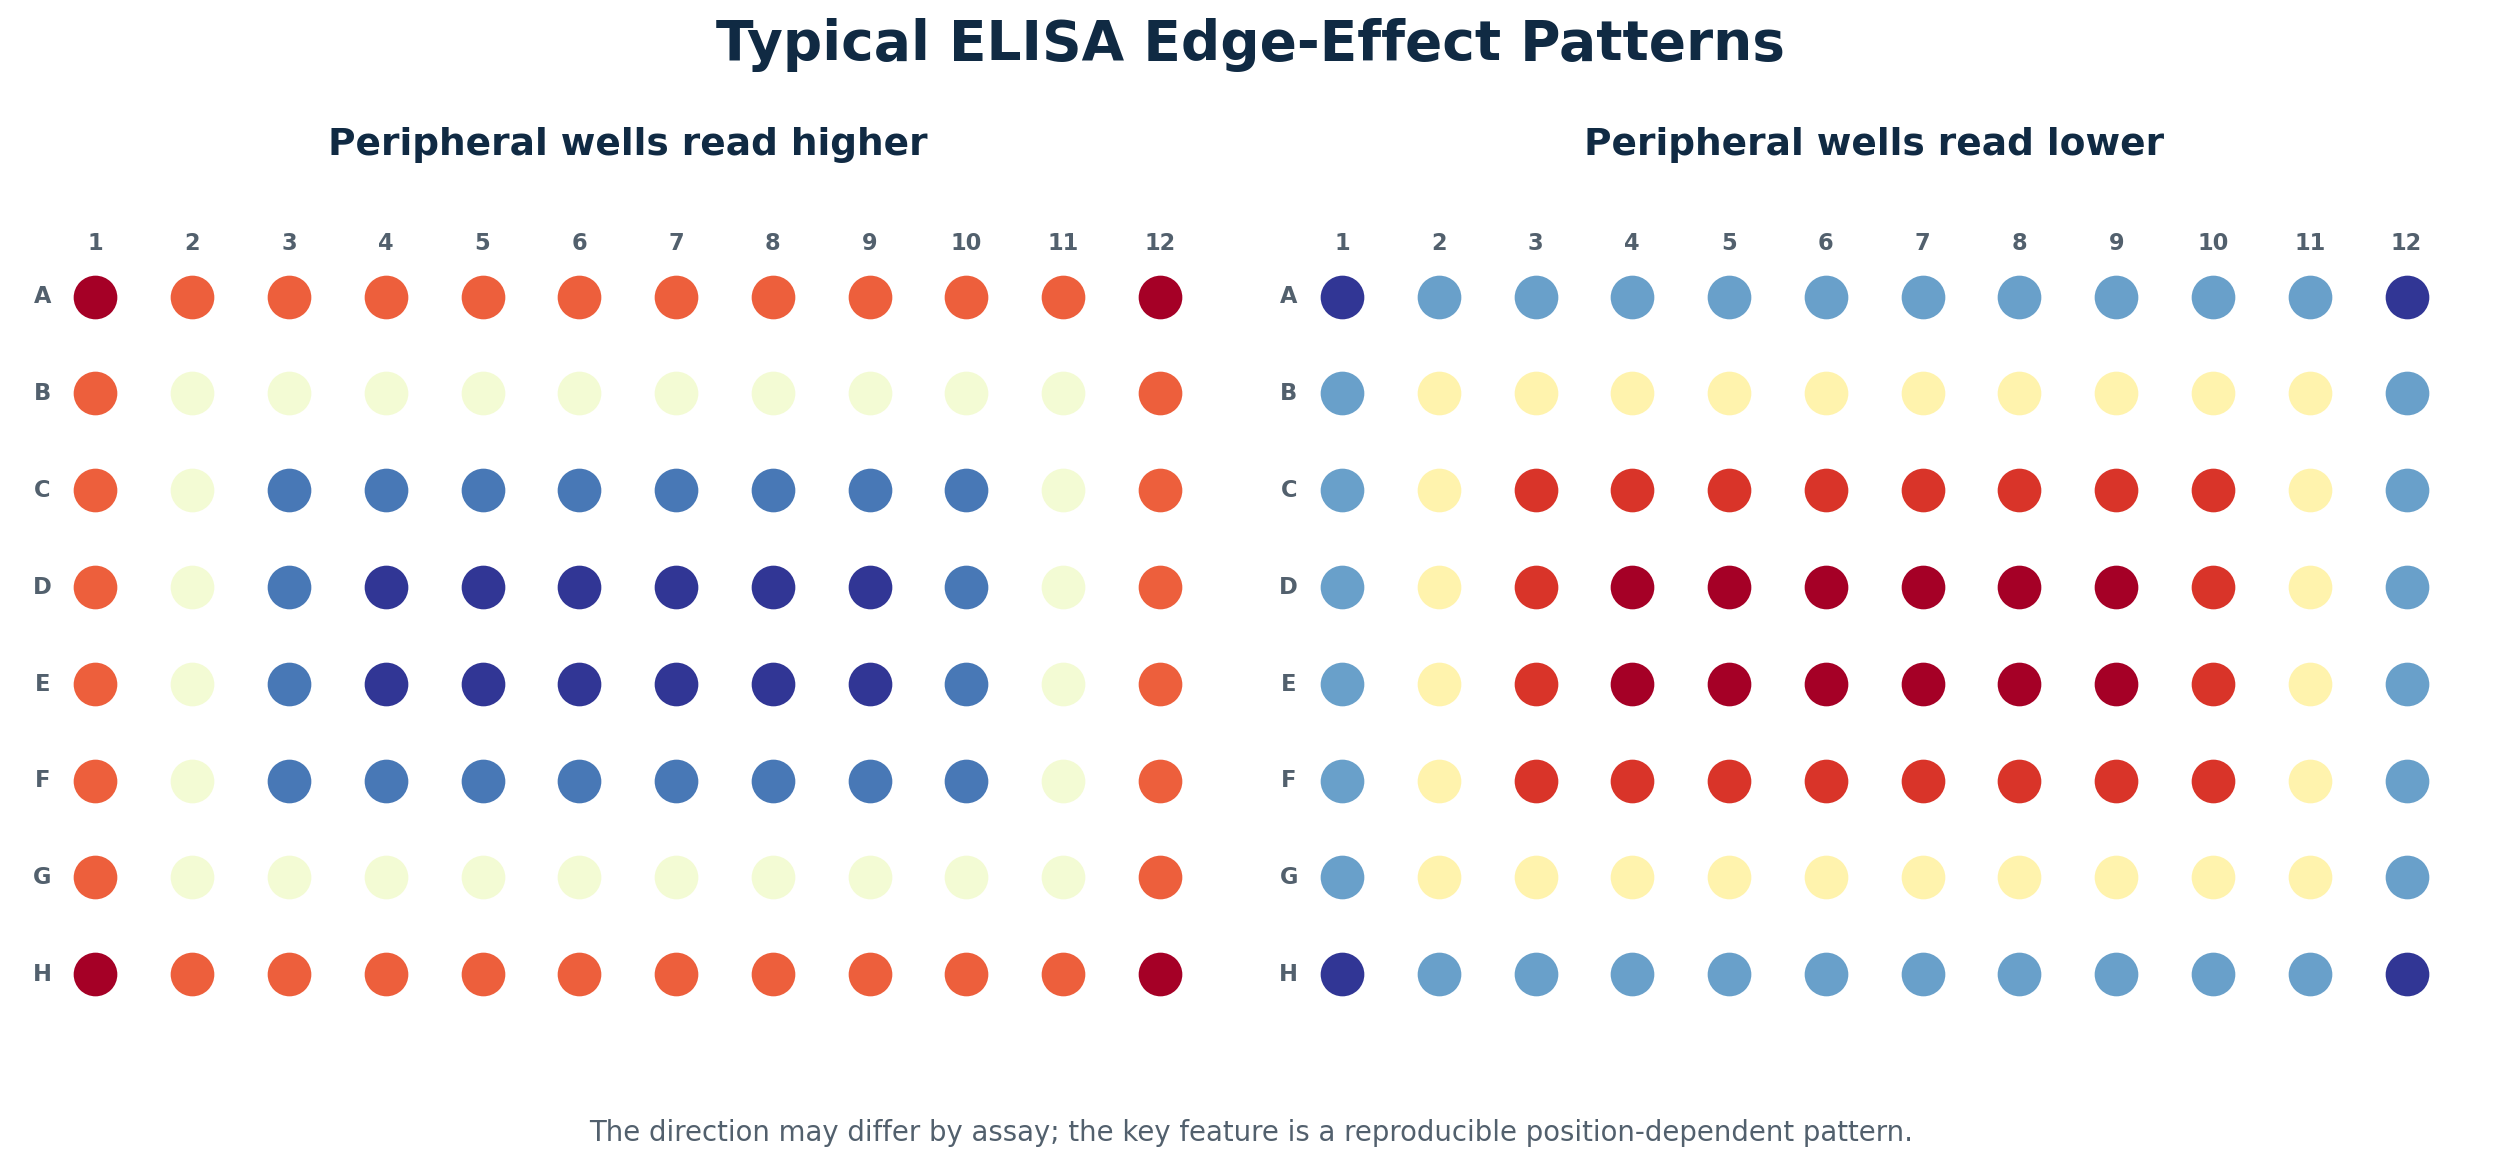
Figure 1. Typical high- and low-perimeter edge-effect patterns. The exact direction is assay-dependent; the diagnostic feature is a reproducible relationship with plate position.
Not every abnormal outer well is a classic edge effect. The spatial pattern often points to the step that should be investigated first.
| Pattern on the plate | More likely explanation |
|---|---|
| Complete perimeter ring, often strongest at corners | Temperature, evaporation, sealing, or plate-position effects |
| One side of the plate differs | Directional environmental exposure, incomplete sealing, or reader-related bias |
| Gradual left-to-right or top-to-bottom change | Dispensing, substrate, stop-solution, or reading-time drift |
| One entire row or column differs | Multichannel pipette or plate-washer issue |
| Irregular local cluster | Contamination, bubbles, splashing, or local washing problem |
| Scattered isolated wells | Pipetting error, bubbles, or particulate material |
| Same experimental group differs after randomized placement | Biological variation becomes more plausible |
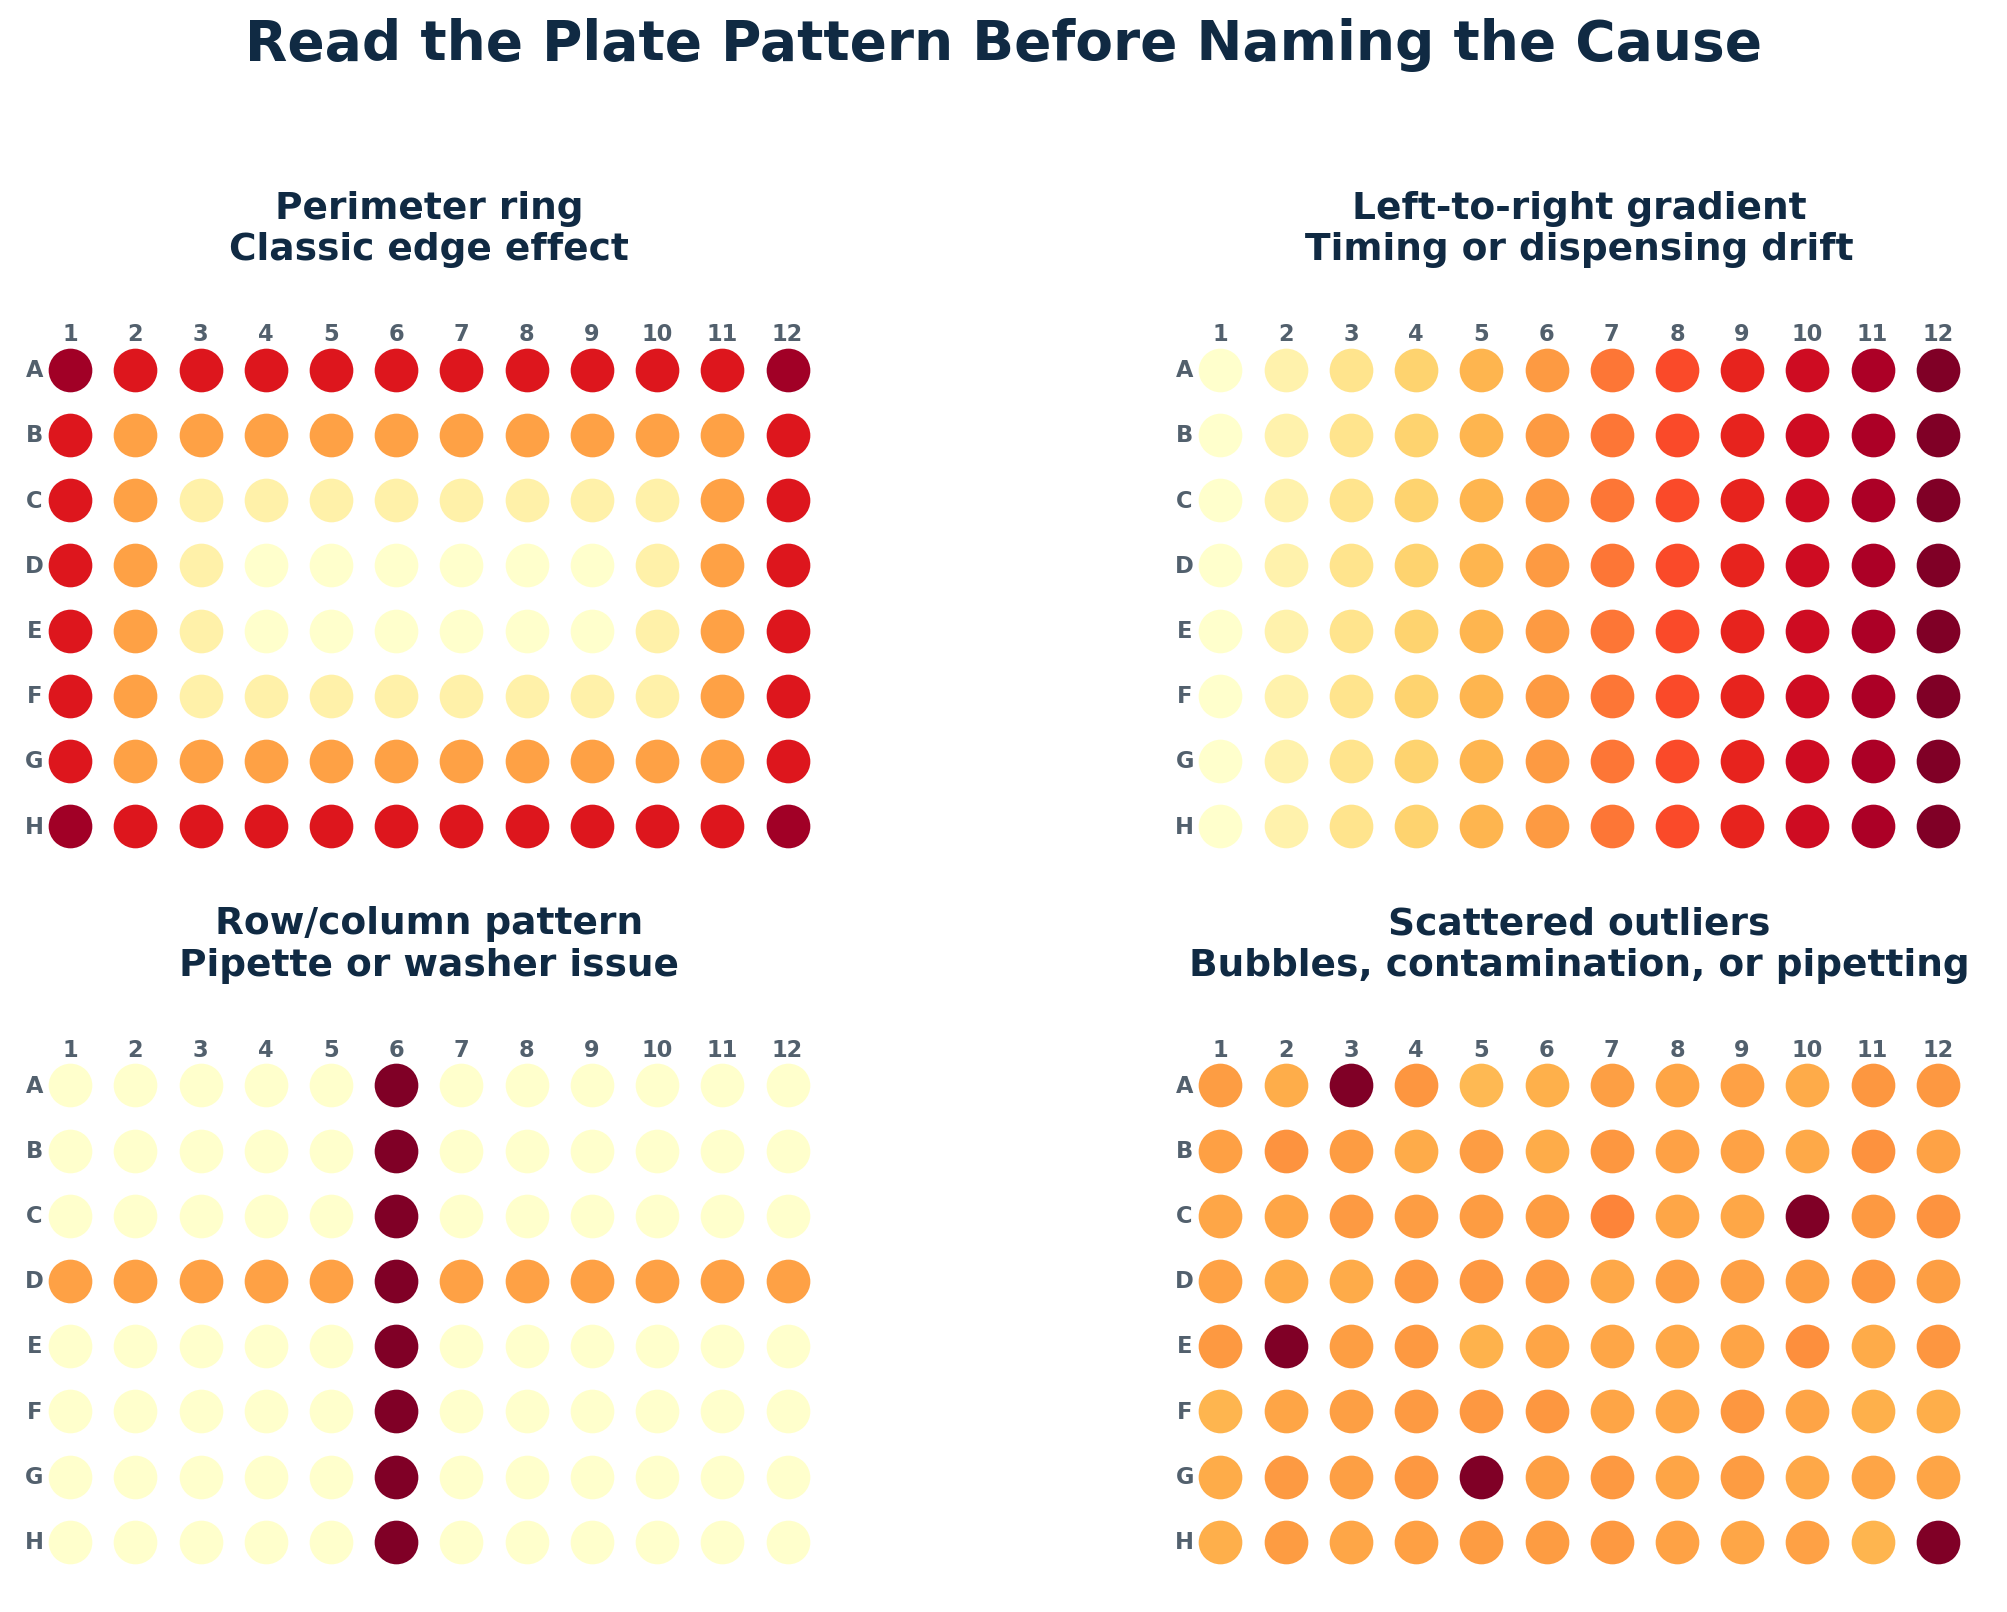
Figure 2. Four common plate patterns. A perimeter ring is different from directional timing drift, row/column artifacts, and scattered outliers.
For a broader checklist covering weak signal, high background, poor replicates, and inconsistent runs, use Boster Bio’s ELISA troubleshooting guide.
Several mechanisms can act at the same time. The dominant factor depends on assay format, incubation conditions, sealing, plate material, washing, and the stage at which the pattern develops.
Do Not Diagnose by Direction Alone
A high perimeter does not prove evaporation, and a low perimeter does not rule it out. The plate map, process history, and controlled comparison provide stronger evidence than the OD direction.
When a plate or reagent moves from refrigerated storage into a warmer incubation environment, wells may not equilibrate at the same rate. Early studies measured edge-to-center thermal differences in microtiter plates and showed that these gradients can produce a rim-shaped effect in enzyme immunoassays. [1,2]
Follow the validated kit instructions for reagent temperature. Do not assume that longer incubation will correct the problem; extending incubation can also increase background, saturation, or evaporation.
Uneven sealing, long open-plate time, low humidity, or repeated reuse of sealing film can change well volume and local reaction conditions. Evaporation and temperature are often linked, so a plate map alone may not separate them.
Stacking changes heat exchange around each plate and can make different plates in the stack behave differently. Boster Bio’s guide to 5 common ELISA pitfalls specifically flags plate stacking as a contributor to edge effects and higher OD variability.
If substrate is added from column 1 to column 12 but stop solution is delayed or applied in a different sequence, the result may form a directional gradient. This is plate drift, not necessarily a classic edge ring. Keep substrate, stop, and reading intervals consistent across the plate.
A blocked washer channel, misaligned manifold, inconsistent aspiration height, or manual washing pattern can produce row-, column-, or perimeter-specific signal. Review whether the abnormal wells align with washer geometry.
Microplates can show vendor-, lot-, and location-dependent variation in adsorption and surface properties. [3,4] If the pattern persists after process controls are tightened, compare plate lots and inspect the reader. A 180° plate rotation and repeat read can help determine whether an asymmetric pattern follows the physical wells or remains associated with one side of the instrument, provided repeat reading is compatible with the assay endpoint.
The goal is not to prove one explanation from a single plate. It is to design a small confirmation experiment in which sample identity and plate position are no longer confounded.
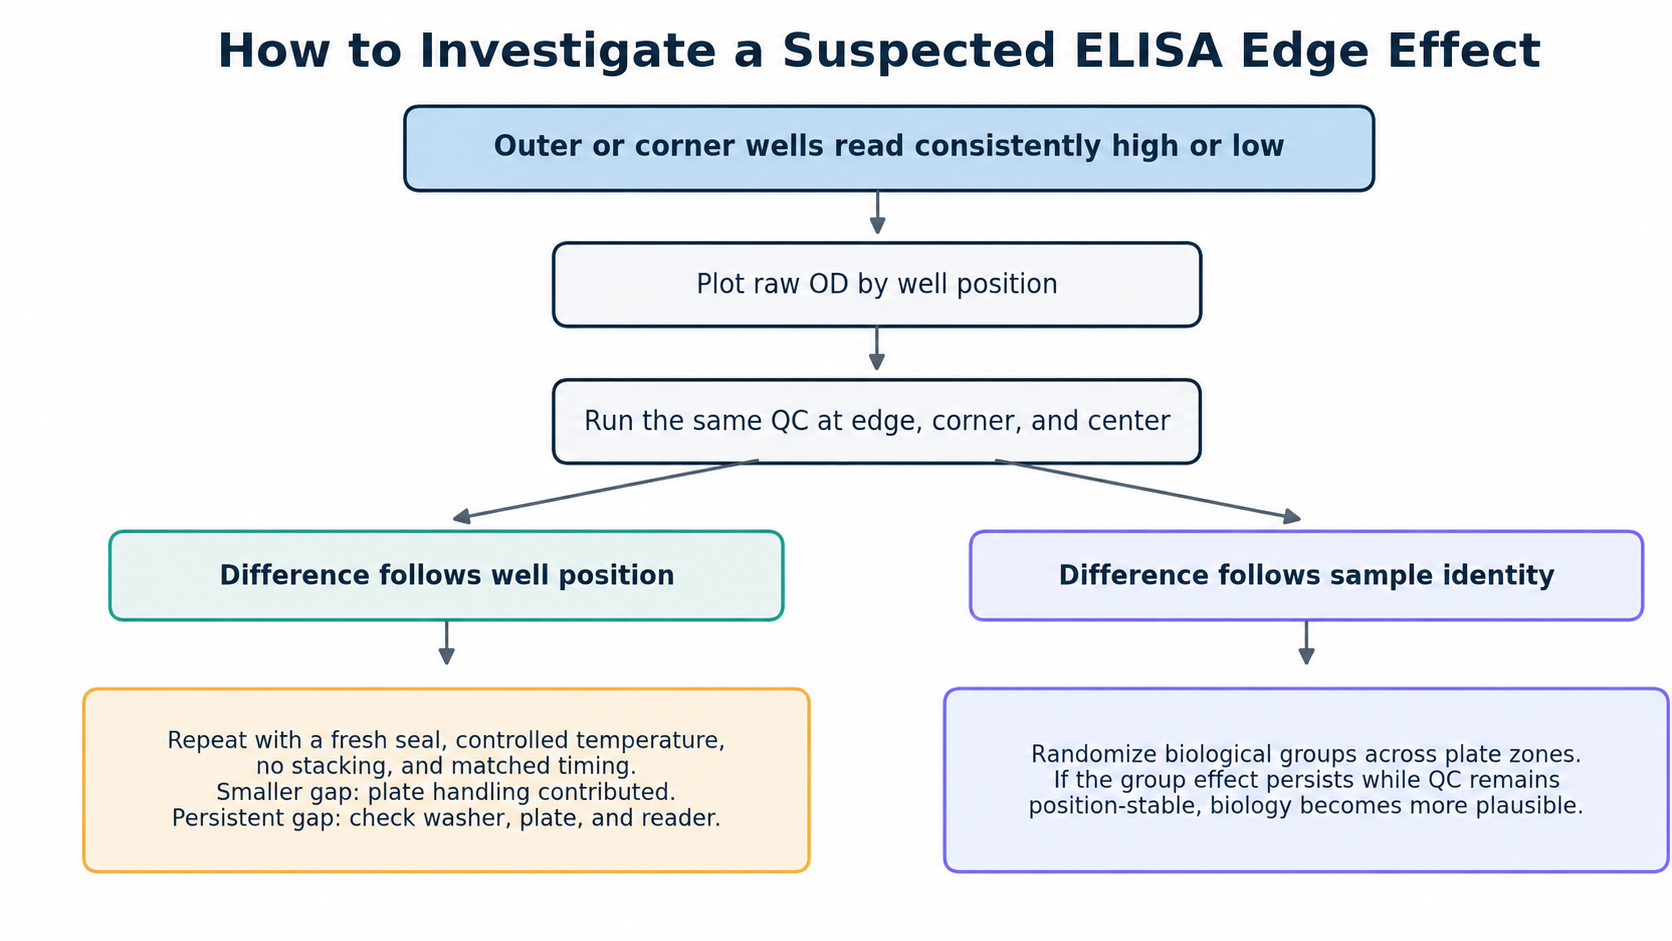
Figure 3. A practical workflow for separating positional bias from biological variation and testing whether evaporation or related plate handling contributes.
For planning controls, replicates, dilutions, and plate documentation before the run, see the ELISA experimental design checklist.
To distinguish system background, matrix-related effects, and true negative behavior, review ELISA controls that actually matter.
A routine throughput map and a diagnostic map serve different purposes. A diagnostic plate deliberately places the same material in multiple zones so that position can be tested.
Distribute low-, medium-, and high-level QC material across corners, edge midpoints, inner wells, and the center. This shows whether the position effect changes with signal level and whether the corners are disproportionately affected.
Distribute each biological group across multiple rows, columns, and plate zones. Include common QC material in more than one zone. This prevents a left-to-right gradient or edge ring from becoming indistinguishable from a group effect.
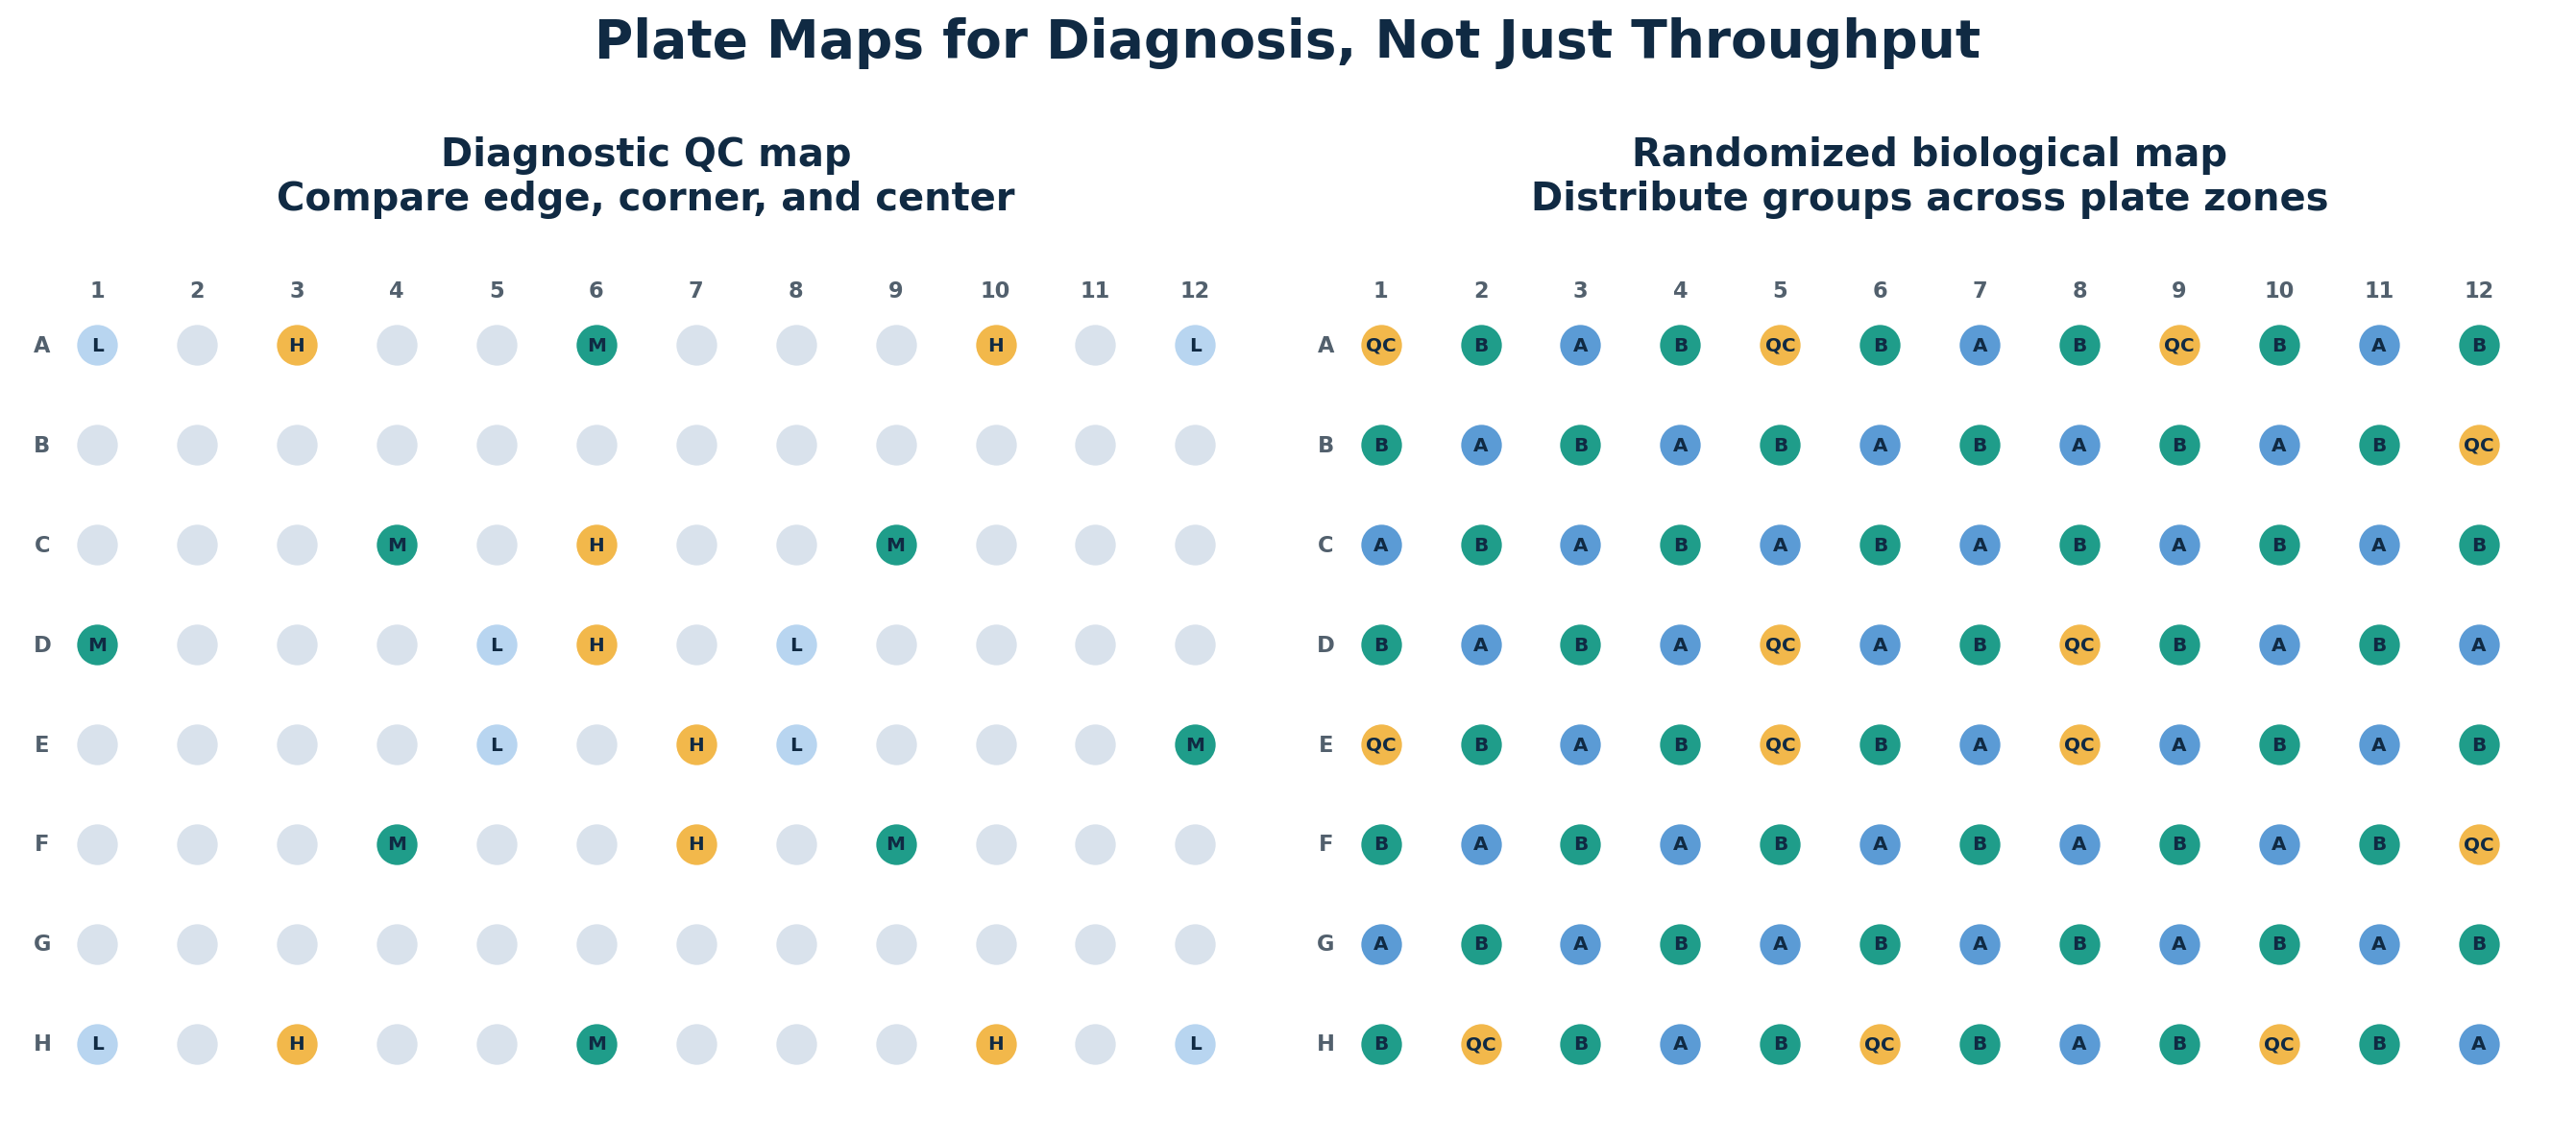
Figure 4. Example diagnostic layouts. The left map tests QC performance by position; the right map distributes biological groups across the plate.
During method development, a confirmed and substantial edge effect may justify filling the outer ring with an appropriate solution and excluding those wells from analysis. This uses 36 wells and leaves 60 inner wells, so the loss of throughput is significant.
This is not a universal rule. Follow the manufacturer’s validated layout for commercial pre-coated kits unless an alternative design has been tested. Outer-ring exclusion reduces exposure to the most vulnerable positions but does not correct directional timing drift, washing artifacts, or reader problems.
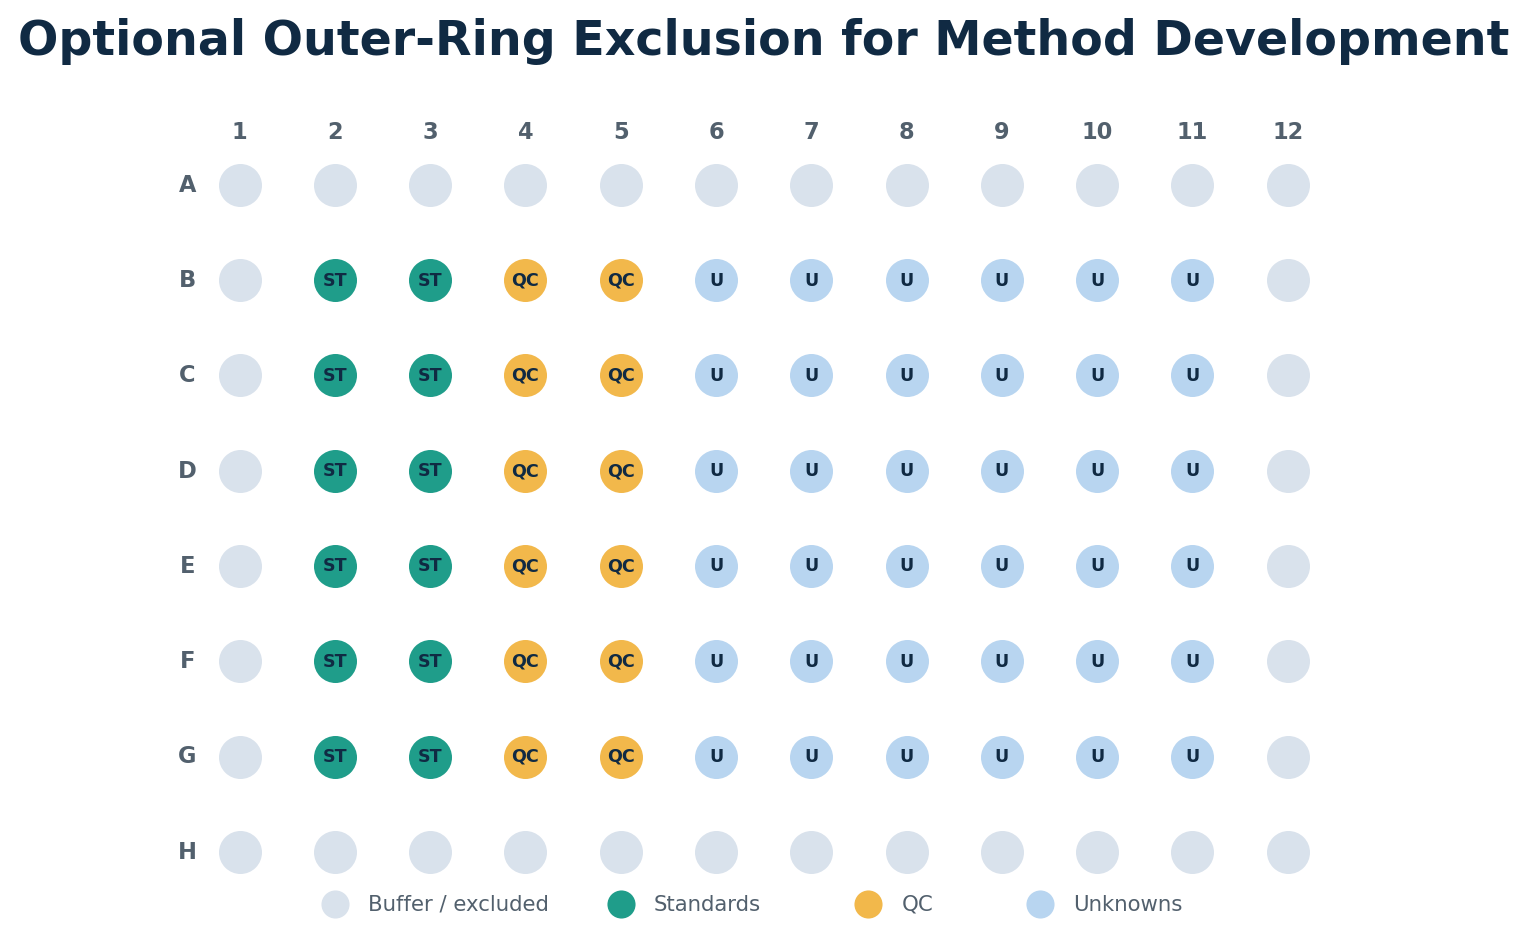
Figure 5. Optional outer-ring exclusion during assay development. Use only after confirming a meaningful positional effect and validating the modified layout.
Prevention is usually a combination of consistent plate handling, timing, environmental control, and plate-map design.
For Boster Bio’s step-by-step guidance on sealing, washing, substrate development, and reading, review the ELISA protocol.
A small positional difference does not automatically invalidate every result. The key question is whether the pattern changes standards, QC, sample classification, calculated concentration, or the scientific conclusion.
Avoid Post Hoc Correction
Do not remove only the wells that conflict with the expected result, replace edge values with the center average, or apply an unvalidated mathematical correction after reviewing the outcome. Exclusion and correction rules should be defined before the experiment whenever possible.
A positional bias can affect more than replicate CV. It can shift the relationship between standards and unknowns, alter cutoffs, and reduce comparability between runs.
| Parameter | Potential impact |
|---|---|
| Intra-assay precision | Replicates spanning edge and center zones may show inflated CV. |
| Standard curve accuracy | Standards in one zone may not represent unknowns in another zone. |
| Assay cutoff | Controls in affected positions may shift positive/negative thresholds. |
| Inter-assay reproducibility | Variable sealing, temperature, or stacking can change the severity between runs. |
| Dilution linearity | Serial dilutions across different zones may appear nonlinear. |
| Paired calculations | Position-dependent shifts can distort ratios between related samples. |
In a published commercial ELISA study, a plate-wide positive control showed higher OD in outer wells. Adding a water-filled strip next to the test strips reduced the overall mean CV from 8.9% to 4.4%, demonstrating that plate configuration alone can materially alter within-plate variation. The same study showed that an uncorrected edge effect could change clinically relevant index classifications. [5]
When positional bias affects standards, review how to generate an ELISA standard curve and prepare a fresh curve on the repeat plate.
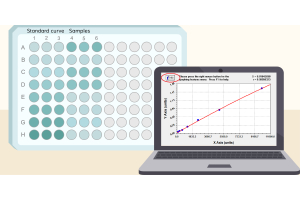
For raw OD review and 4PL/5PL fitting after the plate passes QC, use Boster Bio’s online ELISA data analysis tool.
Possible causes include temperature differences, evaporation-related concentration changes, incomplete washing, plate-surface variation, and timing or light exposure. A high outer ring indicates positional bias but does not identify the mechanism by itself.
Partial drying, residual wash buffer, altered enzyme or binding conditions, and plate-surface differences can reduce signal. Lower OD can still be an edge effect if the pattern follows the plate perimeter.
Randomize groups across the plate and place the same QC material in edge and center positions. A difference that follows sample identity after randomization supports biology; a difference that follows position supports technical bias.
Repeat the edge-versus-center QC comparison with a fresh seal, minimized open time, no stacking, and controlled reagent temperature. A smaller positional difference supports evaporation or related environmental exposure as a contributor.
Not automatically. Follow the validated kit layout. During method development, outer-ring exclusion may be tested after a meaningful position effect has been demonstrated.
Adjacent duplicates are useful for local pipetting repeatability. During edge-effect investigation, placing identical material in different zones provides more information about positional bias.
Yes. For an asymmetric pattern, a repeat read after rotating the plate 180° may help determine whether the pattern follows the wells or remains associated with the reader, when repeat reading is compatible with the assay.
No. Acceptance depends on the assay’s intended use, QC criteria, precision requirements, standard curve behavior, and whether the difference changes interpretation.
Only if the correction method was prospectively developed and validated. A correction created after seeing the results can introduce additional bias.
The ELISA edge effect is a systematic, position-dependent difference between peripheral and central wells. It may appear as higher or lower OD and may reflect several interacting factors, including temperature, evaporation, sealing, plate stacking, dispensing order, washing, plate surface properties, or reader behavior.
The most useful question is not simply whether the outer wells are high or low. Ask whether the result follows the sample or the plate position. Start with a raw OD heatmap, compare identical QC material across zones, repeat under tighter handling conditions, randomize biological groups, and use predefined QC rules before interpreting the result.
A diagnostic plate map turns an unexplained pattern into a testable problem—and helps prevent positional bias from affecting standard curves, calculated concentrations, or biological conclusions.
Continue With Boster Bio ELISA Resources