This website uses cookies to ensure you get the best experience on our website.
- Table of Contents
Accurate protein band size prediction starts with the primary sequence, but real gels reflect biology. PTMs, processing, isoforms, and experimental conditions shift apparent molecular weight. Use the estimate, then verify with the diagnostic steps below.
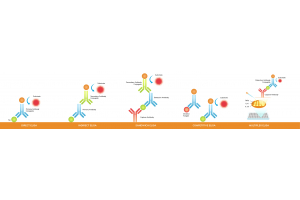
Western blotting separates proteins by size via gel electrophoresis (SDS-PAGE with sodium dodecyl sulfate) and detects targets on a membrane using antibodies. Predicted band size comes from sequence length, yet observed bands often differ due to biological and workflow variables. Solid sample preparation (e.g., protein extraction in the right Lysis Buffer with protease inhibitors) and correct antibody concentration improve band appearance and interpretability. Include a positive control to validate protein expression and confirm antibody detection. Understanding why bands shift—and how to test each cause—improves interpretation and reproducibility.
When predicting a protein’s molecular weight for Western blotting analysis, the simplest approach uses the average molecular weight (MW) of an amino acid—approximately 110 Daltons (Da). This value is derived from the mean mass of the 20 standard amino acids, adjusted for the removal of water during peptide bond formation.
Predicted MW (Da) ≈ N × 110 Convert the result to kilodaltons (kDa) by dividing by 1,000.
Example: A protein with 170 amino acids → 170 × 110 = 18,700 Da, or ≈18.7 kDa.
This theoretical value serves as a baseline when interpreting Western blot bands. However, it assumes the protein is in its unmodified, fully denatured form—conditions that are often altered by biological processes or sample processing
The 110 Da average works well for estimation, but proteins rich in aromatic or sulfur-containing residues (tryptophan, cysteine, methionine) may weigh more, while those enriched in small residues (glycine, alanine) may be lighter. These small shifts (±5–10%) can slightly change expected migration, especially for smaller proteins.
Many secreted or membrane proteins contain signal sequences that guide them through the endoplasmic reticulum and are later cleaved.
After translation, proteolytic cleavage or covalent modification (e.g., phosphorylation, glycosylation) can alter apparent size. These events are discussed in detail in the next section but are important to consider early when calculating expected MWs.
Membrane proteins can migrate anomalously in SDS-PAGE due to detergent binding; consider stain-free gels or alternative systems.
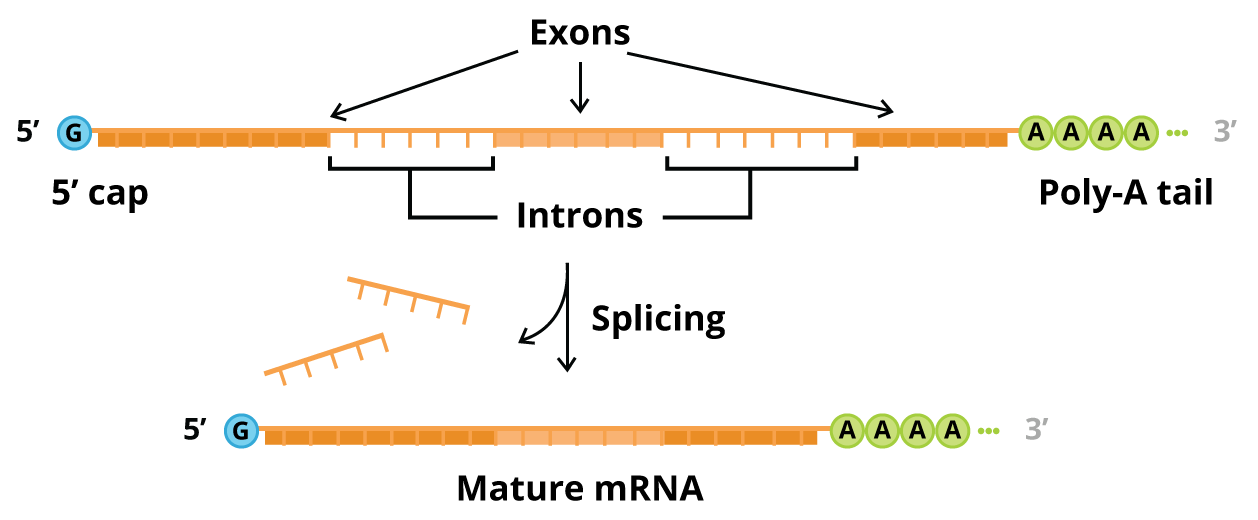
Different isoforms can appear as closely spaced bands; verify with Molecular weight marker and appropriate protein marker ranges. The difference may be small (1–2 kDa) or large (>10 kDa), depending on the alternative exon inclusion.
In general, the smaller the protein, the faster it migrates through the gel. However, migration is also affected by a few other factors. As a result, the actual band size observed in your results may differ from what was predicted by math. These other factors include, but are not limited to:
Small biochemical changes and run conditions can shift SDS-PAGE mobility, so the “predicted” kDa is a guide—not a guarantee.
PTMs add mass and can hinder uniform SDS binding, slowing migration. Glycans and phosphate groups commonly create upward shifts or band “smearing/laddering.” Ubiquitin chains add ~8.6 kDa per moiety; SUMO adds ~12 kDa, often producing discrete higher bands.
How to test
If available, probe with PTM-specific antibodies (e.g., anti-phospho). Use Coomassie staining or Ponceau staining to assess protein load and transfer efficiency.
Zymogens or precursors are cleaved to active fragments, yielding smaller bands or multiple species (full-length + processed). Processing may be constitutive or stimulus-dependent.
How to test
Distinct transcripts encode proteins with different lengths; a single antibody can detect multiple isoforms, appearing as closely spaced bands.
How to test
Incomplete reduction or strong noncovalent interactions can preserve dimers/trimers that migrate at higher apparent molecular weight.
How to test
Extreme pI, proline-rich or highly hydrophobic regions, and low-complexity domains alter SDS binding and shape, shifting mobility independent of true mass.
How to test
Gel percentage, sample load, buffer freshness/pH, transfer settings, and membrane type affect band position and sharpness; artifacts can mimic true size shifts.
How to test
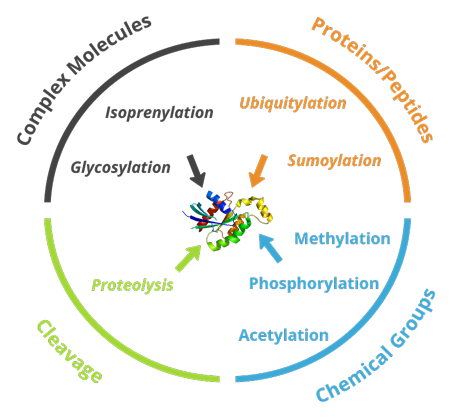
Different types of post-translational modifications
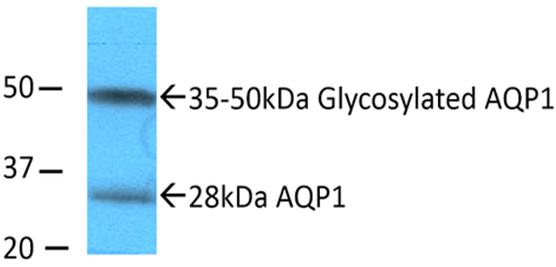
Aquaporin-1’s expected band is 28kDa. However, after AQP1
glycosylation, another band is observed around 50kDa.
| Observation | Likely Cause | Direction | Fast Test |
|---|---|---|---|
| Band >> predicted | PTMs (glyco/phospho) | Up | Deglycosylation/phosphatase |
| Multiple close bands | Heterogeneous PTMs or isoforms | Up/mixed | Enzymatic test; database check |
| Two bands, one smaller | Pro-peptide cleavage/fragments | Down for mature | Domain-specific antibody; ± stimulus |
| High-MW smear/doublet collapses with DTT | Disulfide-linked dimers | Up | Strong reduction + alkylation |
| Odd run vs ladder | Unusual composition/charge | Variable | Alternate gel system; wide-range ladder |
| Weak/patchy | Transfer inefficiency | — | Optimize transfer and stack setup |
Workflow pointers: Validate transfer efficiency with Ponceau staining; confirm protein load; use appropriate protein marker/Molecular weight marker.
Protein: 412-aa receptor with a 20-aa signal peptide and an N-glycosylated ectodomain. Predicted MW: 412 × 110 ≈ 45.3 kDa for the nascent chain; after signal peptide removal (−20 aa → −2.2 kDa), mature core ≈ 43.1 kDa. Observed: A ~55 kDa major band in standard lysates; after PNGase F, a ~42–43 kDa band.
Interpretation:
Recommended confirmations: