This website uses cookies to ensure you get the best experience on our website.
- Table of Contents
A comprehensive guide to longitudinal IHC studies: from designing sampling schedules and selecting marker panels to interpreting dynamic biomarker changes and aligning tissue findings with clinical outcomes.
Why Longitudinal IHC? The Case for Temporal Tissue Analysis
Immune Profiling Over Time: Revealing Treatment Response Patterns
Quantifying Marker Dynamics: Statistics Over Impressions
Inferring Functional Cell States and Differentiating Benign from Malignant Phenotypes
Study Design Considerations for Longitudinal IHC
Multi-modal Integration: Aligning IHC with Imaging, Genomics, and Metabolomics
Clinical Implications: Therapy Response, Prognosis, and Biomarker Validation
Pitfalls, Limitations, and Reproducibility in Longitudinal IHC
Key Takeaways for Longitudinal IHC Study Design
Immunohistochemistry, commonly referred to as IHC staining, has long served as the workhorse of tissue-based biomarker analysis within anatomic pathology and molecular pathology, offering single-cell spatial resolution that no other technique can replicate in fixed, paraffin-embedded tissue samples. But the most powerful application of IHC is not a snapshot—it is the longitudinal series. By collecting and staining tissue samples at defined timepoints, evaluate changes in protein expression analysis linked to disease progression, respond to treatment, or relapses.
This approach supports both clinical diagnostics and pathological diagnosis, transforming static biomarker data into a temporal model of disease biology relevant to cancer diagnosis, tumor diagnosis, and broader applications in biomedical sciences.
Longitudinal IHC studies answer a fundamentally different question than cross-sectional designs. Instead of asking “what markers are present in diseased tissue?”, they ask: how do those markers change, in what order, and what do those changes mean for the patient? This temporal dimension transforms tissue biomarker analysis from a diagnostic tool into a mechanistic window.
“Longitudinal investigation is important to trace markers associated with acquired resistance since the immune response is dynamic during treatment cycles.”
Adapted from Leung et al., Nature Communications, 2023Competitor literature on this topic tends to focus narrowly on either therapy-response readouts (immune checkpoint blockade profiling) or on a single disease model (e.g., melanonychia grading). This article takes a broader view, synthesizing principles of longitudinal IHC design that are applicable across oncology, cardiovascular healing, inflammatory disease, and preclinical animal models.
How is immunohistochemistry used to track disease progression over time? The answer requires integrating study design, marker selection, statistical quantification, and multimodal data alignment, each covered in depth below.
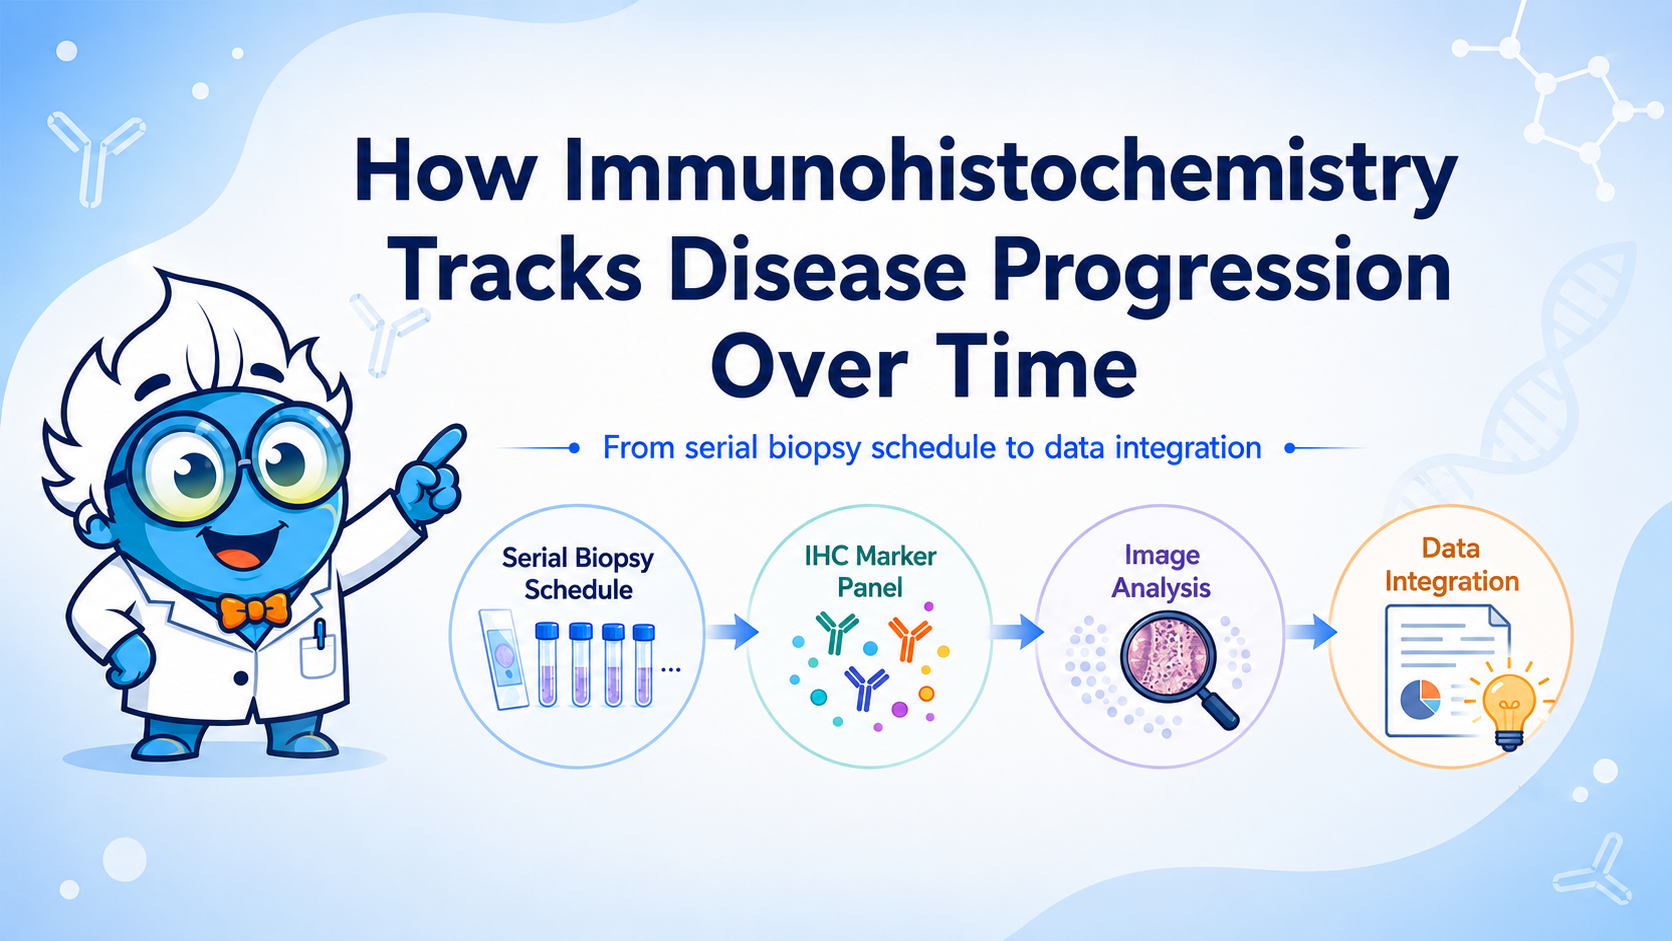
Diagram Placeholder
Recommended: Flowchart illustrating the longitudinal study cycle—cohort enrollment, serial biopsy schedule, IHC panel, image analysis, and data integration.
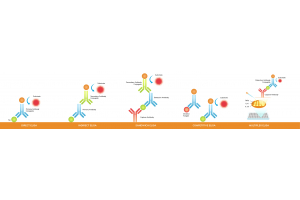
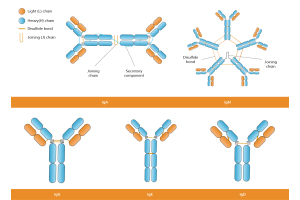
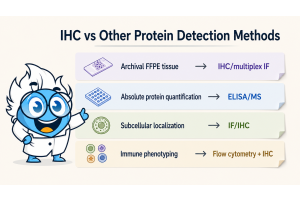
One of the most compelling applications of longitudinal IHC is the monitoring of immune cell populations across treatment cycles, particularly within the tumor microenvironment. Markers such as CD8, CD68, CD4, and PD-L1 are detected using optimized primary antibody and secondary antibody systems, often involving monoclonal antibodies or polyclonal antibodies depending on specificity requirements.
These analyses are essential in breast cancer research and metastatic cancer studies, where immune dynamics influence targeted therapy outcomes. Longitudinal profiling enables detection of tumor antigens, tumor markers, and evolving immune states within neoplastic cells, providing actionable insights for therapy optimization.
Repeated IHC timepoints over weeks allow researchers to observe cellular phenotype shifts that are invisible in cross-sectional designs. A marker like CD8 (cytotoxic T cell) may be abundant at baseline, decline during early treatment, and re-expand in responders by cycle three. This kinetic signature is only interpretable when timepoints are anchored relative to treatment initiation and evaluated against a defined response criterion.
Similarly, CD68-positive macrophages serve as a reliable proxy for innate immune microenvironment activity. Tracking CD68 density longitudinally allows investigators to monitor whether the tissue transitions from pro-inflammatory to immunosuppressive polarization as disease evolves. Such findings have direct implications for the timing of immunomodulatory interventions.
Establish baseline marker densities for CD8+, CD68+, and PD-L1. Define responder and non-responder strata from clinical records. Confirm cohort homogeneity.
Weeks 2–4 — Early Response Window
Key inflection point for myofibroblastic markers (SMA, vimentin). Immune cell flux is most pronounced. Post-hoc tests frequently reveal peak marker expression at this window.
Weeks 8–12 — Mid-Study
Responders typically show declining effector marker intensity and normalizing immune infiltrates. Non-responders may show marker amplification or alternative phenotype acquisition.
Weeks 16–24 — Late / Follow-up
SMA-positive cells may be absent in healed tissue (as demonstrated in aneurysm models). Persistent immune activation signals treatment failure or chronic inflammatory state.
Traditional chromogenic IHC methods using enzymes like horseradish peroxidase or alkaline phosphatase remain widely used. However, newer approaches such as multiplex IHC and multiplexing IHC allow simultaneous detection of multiple markers using fluorescent dye systems like fluorescein Isothiocyanate.
These techniques support integration with digital pathology, where artificial intelligence tools enable automated quantification, reducing observer bias and improving quality assurance.
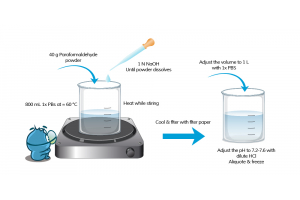
Reliable longitudinal analysis requires moving beyond visual scoring to quantitative frameworks. Proper IHC sample preparation, including formalin fixation and optimized epitope retrieval, ensures consistency across timepoints.
Failure to control these steps often results in background staining, which can obscure true biological signals. Standardized workflows using validated detection reagents and enzyme labels are essential for reproducibility.
The landmark study on aneurysm healing after platinum coil embolization exemplifies this approach: mean SMA-positive cells per high-powered field were reported as 5 ± 3, 45 ± 9, 10 ± 5, 0 ± 0, and 0 ± 0 at weeks 2, 4, 10, 16, and 24 respectively. A Kruskal-Wallis test confirmed significance (P = .0001), and post-hoc pairwise comparisons identified the precise intervals of significant change. This level of rigor converts a series of micrographs into a statistically defensible biological narrative.
| Timepoint | SMA+ Cells | CD68+ Cells | Ki-67 Index (%) | Interpretation |
|---|---|---|---|---|
| Week 0 (early response) | 5 ± 3 | 12 ± 4 | 18 ± 6 | Early healing phase |
| Week 4 | 45 ± 9 | 38 ± 11 | 32 ± 8 | Peak activation / healing |
| Week 10 | 10 ± 5 | 22 ± 7 | 14 ± 5 | Resolution / remodeling |
| Week 16 | 0 ± 0 | 9 ± 3 | 8 ± 2 | Near-baseline recovery |
| Week 24 | 0 ± 0 | 6 ± 2 | 5 ± 2 | Stable resolved state |
Representative longitudinal IHC trajectory model adapted from published aneurysm healing studies.
Marker intensity should not be treated merely as a binary readout. Declining marker intensity—for example, reduced SMA or vimentin staining over successive timepoints—can serve as a direct readout of tissue healing or remodeling. Conversely, persistent or rising intensity signals ongoing pathological activity. The critical insight is that stable markers across disease stages can serve as evidence of pathway stability, a finding with both mechanistic and therapeutic implications.
Apoptotic cell counts (via TUNEL staining) added alongside IHC markers provide additional mechanistic depth: the documented 78% decrease in apoptotic cells between weeks 4 and 10 maps directly onto the resolution phase of myofibroblast activity, linking structural histology to a molecular mechanism.
Critical Pitfall
Avoid relying on visual impression to assess longitudinal IHC changes. Inter-observer variability in semiquantitative scoring can exceed the actual biological signal. Automated image analysis with defined ROI protocols and statistical testing (ANOVA, Kruskal-Wallis, mixed-effects models) is required for defensible conclusions.
Chart Placeholder Recommended: Multi-line graph of SMA, CD68, and Ki-67 expression across 5 timepoints, with error bars and significance brackets between key intervals.IHC panels enable differentiation between benign and malignant processes by analyzing marker combinations rather than single targets. This is critical in distinguishing tumor diagnosis outcomes and identifying disease-specific pathways in autoimmune diseases, autoimmune disorders, and neurodegenerative disease models. Markers such as estrogen receptor and progesterone receptors are routinely evaluated in breast cancer, supporting treatment decisions and guiding targeted therapy strategies.
In oncology and clinical diagnostics, distinguishing activation from malignancy requires longitudinal tracking of tumor markers and changes within neoplastic cells.
In the healing aneurysm model, spindle-nucleated cells at week 2 were positive for SMA, myosin, and vimentin, marking early myofibroblastic commitment. By week 4, the same cell population co-expressed desmin, confirming full myofibroblastic differentiation. This temporal co-expression pattern—only visible across a longitudinal series—defines the mechanistic sequence of the healing response and provides a template for interpreting analogous findings in tumor stroma, wound healing, and fibrotic disease.
One of the most diagnostically consequential applications of longitudinal IHC is distinguishing tissue states that are morphologically similar but biologically distinct. In longitudinal melanonychia studies, IHC panels using S-100, HMB-45, and Melan-A enabled differentiation of:
Melanic pigmentation without increased melanocyte density. HMB-45 negative or weakly positive. S-100 variable. No architectural atypia.
Increased melanocyte density. HMB-45 intensely positive (most sensitive marker). Melan-A positive. S-100 variable; critical for detecting invasive/desmoplastic components.
A marker panel that shifts from negative to strongly positive HMB-45 across sequential biopsies is far more concerning than a persistently weakly positive result.
Always combine HMB-45 and Melan-A for intraepithelial evaluation. Add S-100 only when invasive or desmoplastic melanoma is suspected based on morphology.
In oncology models, oncogene-specific conditional systems (such as doxycycline-inducible oncogene expression) allow researchers to directly assess how driver mutations shape IHC profiles over time. By switching oncogene expression on and off, investigators can attribute specific IHC changes causally to the driver mutation rather than to confounding disease heterogeneity.
The scientific validity of any longitudinal IHC study depends heavily on pre-analytical variables such as tissue fixation methods and consistent handling of tissue samples. Poorly designed sampling schedules, underpowered cohorts, and heterogeneous IHC tissue processing protocols can invalidate even technically excellent IHC data.
The sampling schedule must balance biological informativeness with clinical and logistical feasibility. Too few timepoints risk missing critical biological transitions; too many impose unacceptable burdens on subjects and resources. Evidence from published models suggests that key biological inflection points occur in predictable windows:
Early window (weeks 2–4): Peak activation of repair and immune infiltration; critical for identifying the therapeutic intervention window.
Mid window (weeks 8–12): Divergence of responders and non-responders; most diagnostic timepoint for prognosis.
Late window (weeks 16–24): Resolution, remodeling, or chronic progression; essential for durability assessment.
For studies using longitudinal IHC to pinpoint optimal time windows for therapeutic intervention, the early window is often the most actionable, as biomarker trajectories are steepest and biological states are most amenable to modulation.
Clearly defined cohorts are a prerequisite for valid longitudinal conclusions. The landmark NSCLC immunotherapy study enrolled 25 patients (11 responders, 14 non-responders) alongside 16 healthy donors, with response stratified by RECIST criteria. While relatively small, the clear definition of response categories and the longitudinal monitoring over 30+ months provided sufficient statistical power to identify cell subsets associated with outcome.
For IHC-based longitudinal studies, a minimum of 10 specimens per timepoint per group is generally required to support parametric statistical testing. Power calculations should account for expected effect sizes from pilot or published data and should define the primary endpoint (e.g., change in marker density per HPF) a priori.
| Checklist Item |
|---|
| Pre-defined sampling schedule with biological rationale for each timepoint |
| Clearly defined cohorts with documented inclusion/exclusion criteria |
| A priori primary endpoint and power calculation |
| Standardized tissue processing (fixation time, antigen retrieval protocol) |
| Validated antibody panel with documented specificity controls |
| Blinded quantification protocol (automated image analysis preferred) |
| Pre-specified statistical testing approach (Kruskal-Wallis + post-hoc or mixed-effects model) |
Hematoxylin-eosin (H&E) and Masson trichrome stains should be performed alongside IHC on serial sections at every timepoint. These structural stains capture connective tissue organization, collagen deposition, and cellular morphology that IHC markers alone cannot convey. The combination of structural histology with molecular IHC is the most comprehensive approach for capturing both structural and molecular changes within a single longitudinal series.
Modern IHC studies increasingly integrate with other technologies such as mass spectrometry, confocal microscope imaging, and spatial biology platforms like scanning mass cytometry and multiplexed ion-beam imaging.
These integrations expand insights into disease biology across areas including:
neurodegenerative disorders
muscular dystrophy
infectious disease profiling of parasite antigens
Additionally, methods such as chromogenic in situ hybridization complement IHC by linking protein expression to genetic alterations.
Imaging modalities (MRI, PET, CT) provide in vivo, non-invasive longitudinal data that can be correlated with IHC findings from concurrent biopsies. In the aneurysm healing context, angiographic imaging of vessel occlusion status can be mapped against the IHC-defined phases of myofibroblast activity. In oncology, PET tracer uptake can be correlated with Ki-67 or PD-L1 IHC density.
Importantly, recognizing when certain tracers or markers are not informative across disease stages is as scientifically valuable as identifying those that are. A PET tracer that shows flat uptake across timepoints when IHC shows significant cellular changes suggests uncoupling of metabolic and structural biology—a mechanistically important finding.
Diagram Placeholder
Recommended: Hub-and-spoke diagram centering IHC as the primary modality, with spokes connecting to imaging, gene expression, metabolomics, and clinical outcome data.
High-dimensional cytometry (CyTOF) and single-cell RNA sequencing generate cell-type-resolved transcriptomic data that can be mapped onto IHC-defined tissue compartments. When longitudinal IHC shows increasing CD8+ density, paired scRNA-seq can reveal whether those cells represent newly recruited cytotoxic T cells, exhausted effectors, or a mixed population—information that fundamentally changes the therapeutic implication.
Metabolomics integration is particularly powerful in oncology and metabolic disease contexts. IHC markers of proliferation (Ki-67), hypoxia (HIF-1α), or lipid metabolism (FASN) can be correlated with metabolite profiles from the same tissue block or paired biofluid samples, providing a systems-level view of disease progression.
Genetically engineered mouse models with conditional oncogene expression (e.g., Cre-lox or doxycycline-inducible systems) are uniquely suited to longitudinal IHC studies because they allow researchers to precisely define disease onset and progression timelines. Switching oncogene expression on and off in regression studies generates IHC datasets in which the direction of marker change is causally attributed to the driver mutation, not to natural disease history.
In such models, IHC profiles can be directly compared to gene expression data from the same animals at each timepoint, enabling direct validation of protein-level findings (IHC) against transcript-level data—a critical quality check in any multi-modal longitudinal study.
The translational value of longitudinal IHC studies depends on how tightly the tissue biomarker analysis is anchored to clinically relevant questions. Studies that track markers without linking them to treatment response, survival, or functional outcomes generate biological observations that cannot guide practice.
In the NSCLC anti-PD-1 study, longitudinal CyTOF profiling across 30+ months identified that elevated CD8+CD101hiTIM3+ (CCT T) cell frequencies at baseline were associated with poor response, and that this population remained low throughout treatment in responders. Critically, higher KLRG1 expression in CCT T cells at baseline was associated with prolonged progression-free survival—a finding with direct prognostic implications.
For IHC-based studies, analogous approaches translate to: establish a baseline IHC biomarker signature, track it across treatment cycles against a validated clinical response criterion (RECIST, pathological response grade), and report the predictive or prognostic value of early trajectory changes. This framework anchors tissue biomarker analysis in clinical utility.
Every longitudinal IHC biomarker should be evaluated against at least one clinically meaningful endpoint: therapy response (RECIST or equivalent), overall survival, progression-free survival, or pathological response grade. Biological plausibility alone is insufficient justification for longitudinal tissue biomarker analysis.
The temporal resolution of longitudinal IHC studies is their defining advantage for therapeutic optimization. By mapping IHC biomarker trajectories against treatment timelines, researchers can identify the timepoint at which the tissue is maximally receptive to a given intervention. In the aneurysm healing model, the week-4 peak of myofibroblastic activity represents the window during which anti-fibrotic interventions would have maximal effect. In immunotherapy contexts, the early treatment cycle during which CD8+ T cell expansion is highest may define the optimal window for combination therapy.
Longitudinal IHC datasets that extend beyond the treatment period into long-term follow-up generate prognostic biomarker profiles that cross-sectional studies cannot. The presence of residual activated immune cells, persistent fibroblast markers, or re-emerging proliferative IHC signatures at late timepoints can predict relapse or chronic disease development before clinical symptoms manifest.
Understanding where longitudinal IHC studies commonly fail is as important as understanding their potential. The following categories of limitation should be explicitly addressed in any published or pre-published dataset.
Batch effects across staining runs are the most common source of artifactual variability in longitudinal IHC data. Slides stained in different runs—as is inevitable in a study spanning months—must include consistent positive and negative controls, and ideally a reference tissue microarray (TMA) core stained in every batch for normalization. Fixation time variation between timepoints (due to biopsy logistics) can dramatically affect antigen retrieval efficiency and staining intensity, creating apparent biological changes that are purely technical.
Not all markers are informative at all stages of disease. S-100 protein, for example, shows weak sensitivity for intraepithelial melanocytes in the nail matrix—a finding that, when used in isolation, would produce falsely reassuring results in early-stage melanoma. Similarly, certain PET tracers show flat uptake during specific disease phases that do not reflect the true tissue biological state captured by IHC.
Researchers must prospectively define which markers are expected to be informative at which timepoints, based on biological rationale, and should report cases where markers failed to show expected dynamics alongside an analysis of potential causes.
Tumor and tissue heterogeneity means that a single biopsy may not represent the biological state of the entire lesion. Longitudinal studies that rely on serial biopsies from the same anatomical site must acknowledge sampling bias, particularly when the lesion is spatially heterogeneous. Multi-region sampling at each timepoint, where feasible, substantially strengthens the validity of longitudinal IHC conclusions.
A longitudinal study design is only as reproducible as the antibodies it uses. Proprietary or discontinued antibody clones undermine long-term reproducibility. Using routinely available, commercially validated antibodies (S-100, HMB-45, Melan-A, SMA, CD68, Ki-67) ensures that findings can be independently replicated and that longitudinal conclusions are not dependent on reagent availability at a single institution.
Design sampling schedules around biological inflection points, not administrative convenience.
Replace visual impression with quantitative cell counting and pre-specified statistical testing.
Use marker combinations to infer functional cell states; single markers are rarely sufficient.
Anchor every biomarker finding in a clinically relevant endpoint: response, survival, or prognosis.
Integrate IHC data with imaging, gene expression, and metabolomics for mechanistic depth.
Use routinely available, validated antibodies to ensure long-term reproducibility.
Combine H&E and Masson trichrome with IHC to capture both structural and molecular changes.
Distinguish benign activation from malignant proliferation using longitudinal panel trajectory, not single-timepoint intensity alone.
Leung, D. K., et al. (2023). Longitudinal high-dimensional analysis identifies immune features associated with anti-PD-1 response in non-small cell lung cancer. Nature Communications, 14, 5214.
https://doi.org/10.1038/s41467-023-40631-0
Ding, Y. H., Dai, D., Lewis, D. A., Kadirvel, R., & Kallmes, D. F. (2006). A longitudinal immunohistochemical study of the healing of experimental aneurysms after embolization with platinum coils. American Journal of Neuroradiology, 27(4), 736–741.
https://www.ajnr.org/content/27/4/736
Mitome-Mishima, Y., Yamamoto, M., Yatomi, K., Nonaka, S., Miyamoto, N., Urabe, T., Arai, H., & Oishi, H. (2014). Endothelial cell proliferation in swine experimental aneurysm after coil embolization. PLOS ONE, 9(2), e89047.
https://doi.org/10.1371/journal.pone.0089047
Baxi, S., Yang, A., Gennarelli, R. L., Khan, N., Wang, Z., Boyce, L., et al. (2018). Immune-related adverse events for anti-PD-1 and anti-PD-L1 drugs: systematic review and meta-analysis. BMJ, 360, k793.
https://doi.org/10.1136/bmj.k793
Lugowska, I., Teterycz, P., & Rutkowski, P. (2018). Immunotherapy of melanoma. Contemporary Oncology, 22(1A), 61–67.
https://doi.org/10.5114/wo.2018.73889
Stack, E. C., Wang, C., Roman, K. A., & Hoyt, C. C. (2014). Multiplexed immunohistochemistry, imaging, and quantitation: A review, with an assessment of Tyramide signal amplification, multispectral imaging and multiplex analysis. Methods, 70(1), 46–58.
https://doi.org/10.1016/j.ymeth.2014.08.016
Tan, W. C. C., Nerurkar, S. N., Cai, H. Y., Ng, H. H. M., Wu, D., Wee, Y. T. F., et al. (2020). Overview of multiplex immunohistochemistry/immunofluorescence techniques in the era of cancer immunotherapy. Cancer Communications, 40(4), 135–153.
https://doi.org/10.1002/cac2.12023
Ramos-Vara, J., & Miller, M. A. (2014). When tissue antigens and antibodies get along: Revisiting the technical aspects of immunohistochemistry—The red, brown, and blue technique. Veterinary Pathology, 51(1), 42–87.
https://doi.org/10.1177/0300985813505879
Pop, A. M., Căinap, C., & Ormenisan, A. (2023). The importance of immunohistochemistry in the evaluation of Breslow thickness and staging of primary cutaneous melanoma. Diagnostics, 13(6), 1020.
https://doi.org/10.3390/diagnostics13061020
Ohsie, S. J., Sarantopoulos, G. P., Cochran, A. J., & Binder, S. W. (2008). Immunohistochemical characteristics of melanoma. Journal of Cutaneous Pathology, 35(5), 433–444.
https://doi.org/10.1111/j.1600-0560.2007.00891.x