This website uses cookies to ensure you get the best experience on our website.


- Table of Contents
Plan an AQP9 Western blot around the catalog-observed 37.2 kDa band, image-backed PA2094 evidence, HPA controls, and verified protocol records.
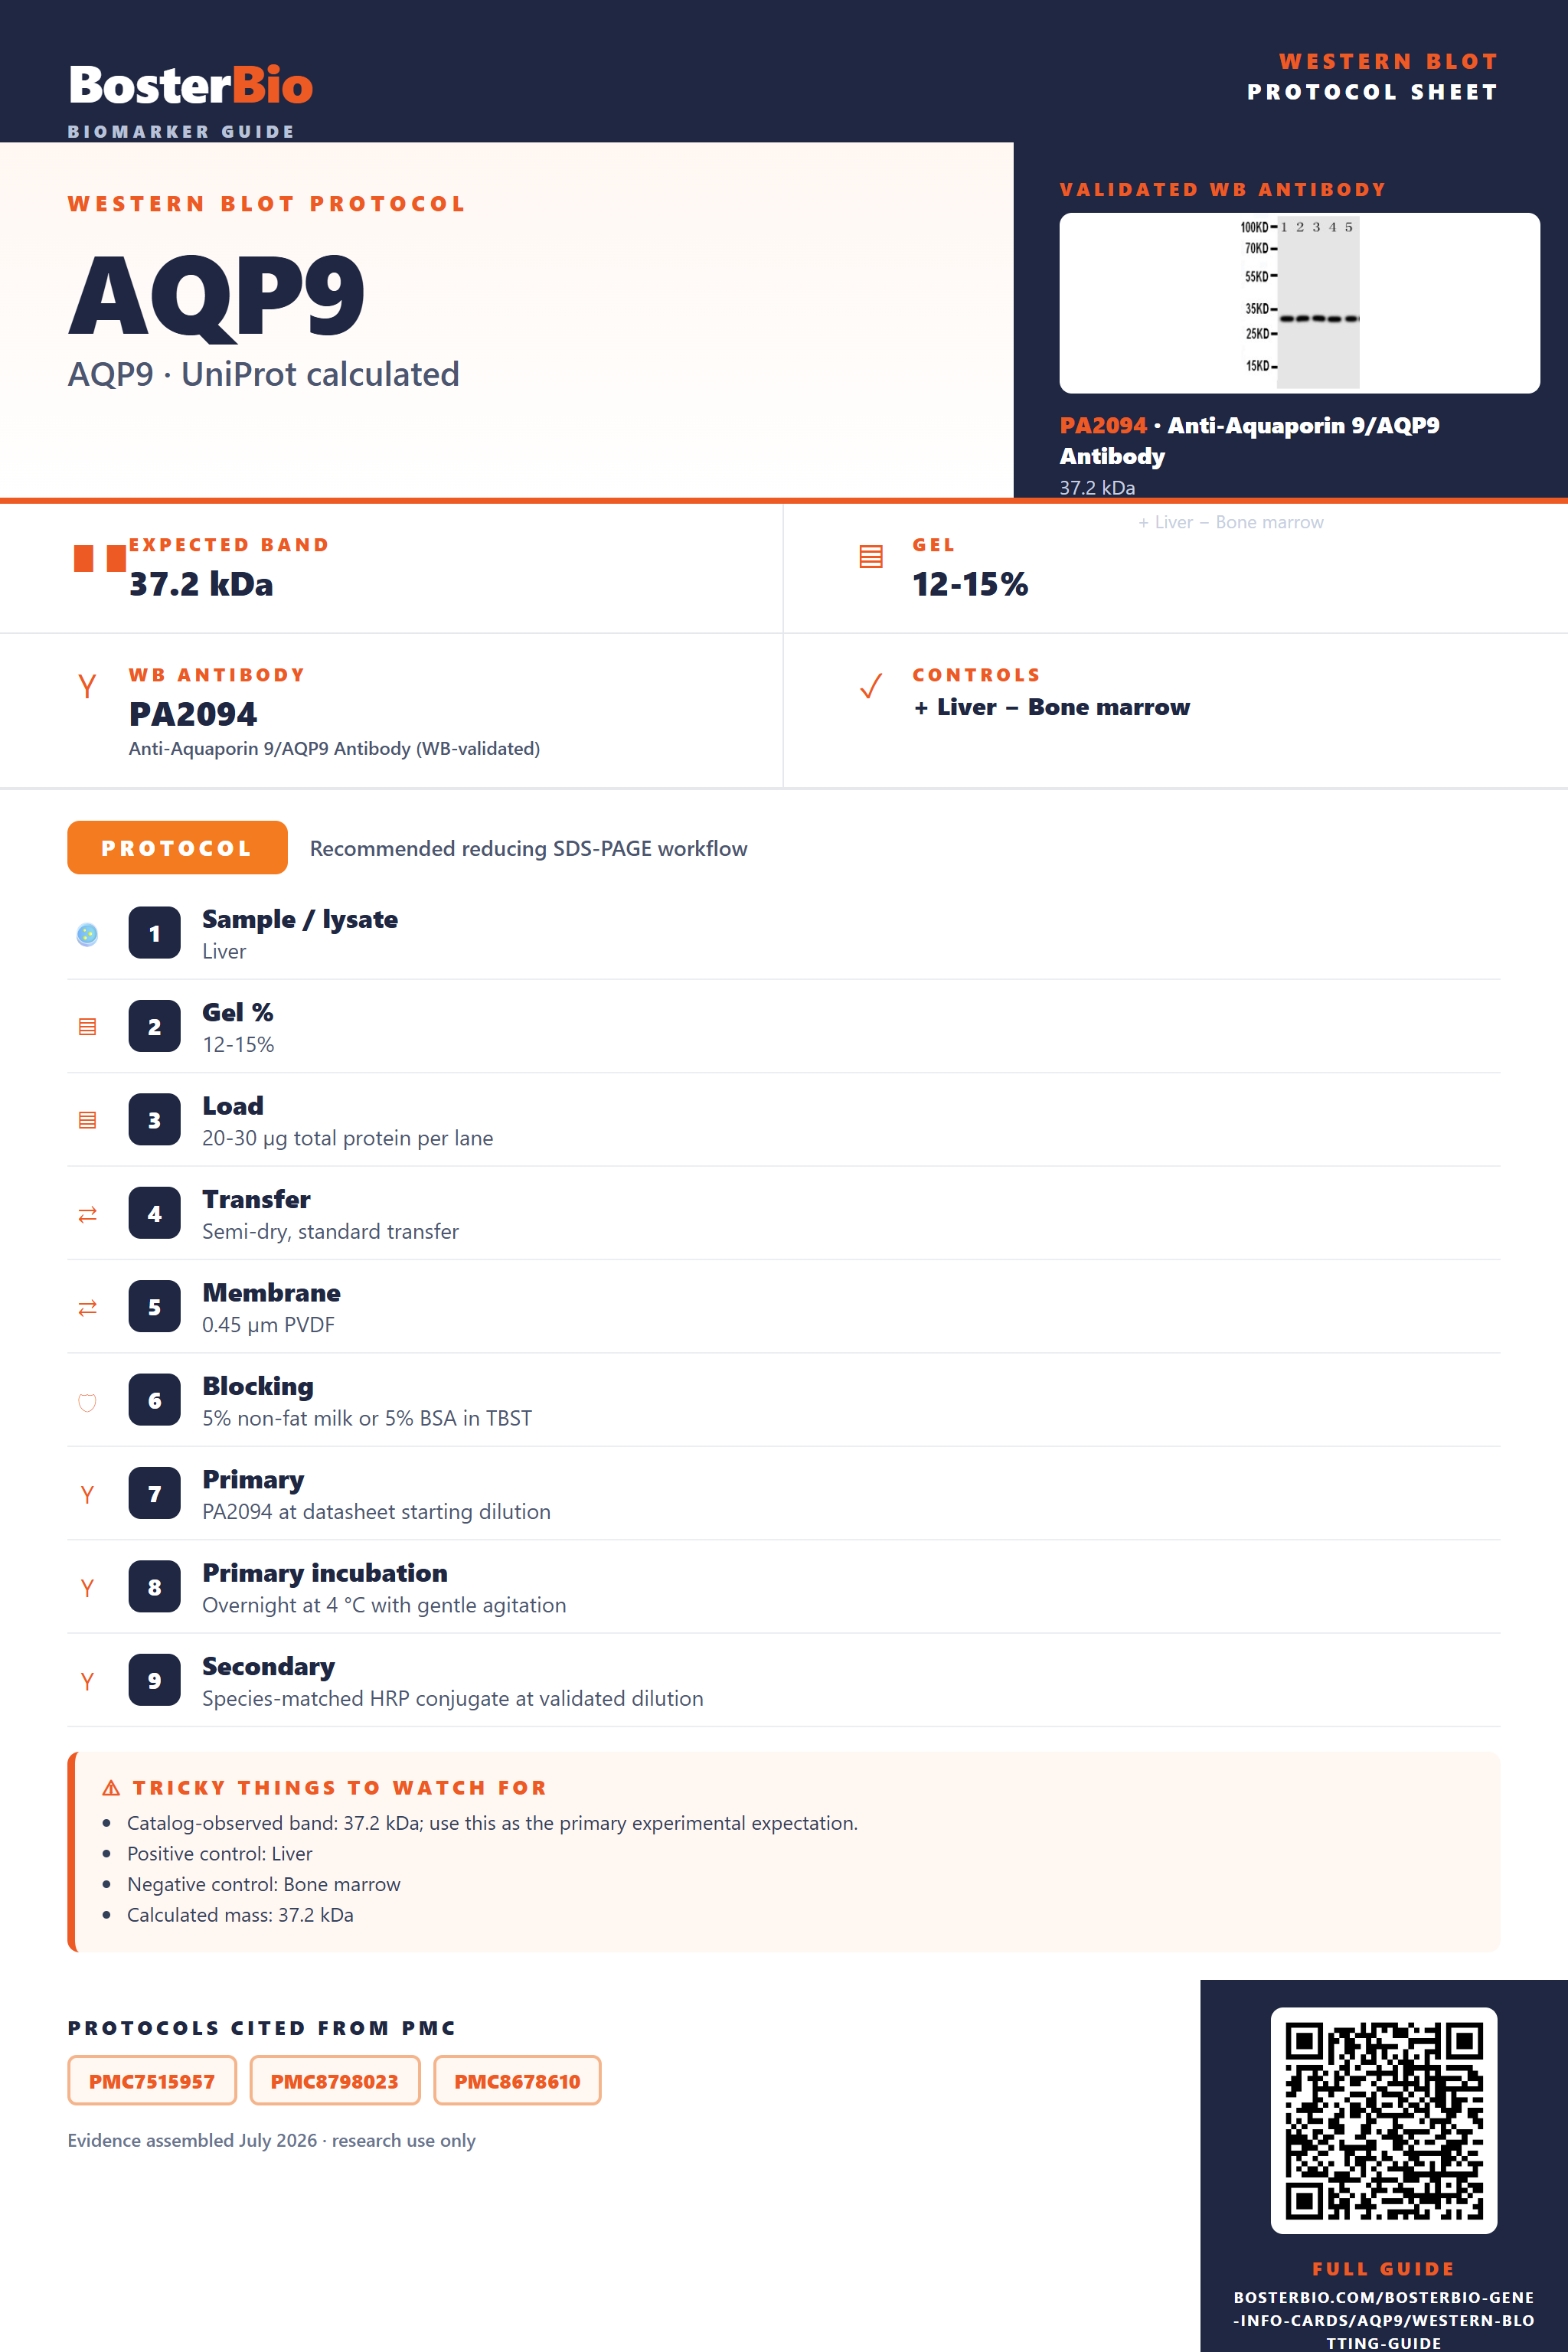
Expected bands, validated protocols, controls and antibodies — the at-a-glance facts below, then the full design guide.
| Expected band | 37.2 kDa | |
| Observed band | Not reported — verify product WB image | |
| Gel | 12-15% | |
| Positive control | Liver | |
| Negative control | Bone marrow |
| ⓘ | Calculated mass | 37.2 kDa |
| ⓘ | Localization | Cell membrane / Cytoplasmic vesicle membrane |
| ⓘ | Processing / PTM | Record-dependent |
| ⓘ | Reactivity | Mouse |
Start with the molecular-weight rule, then compare verified publication-derived conditions.
| Sample / lysate | Liver |
| Gel % | 12-15% |
| Load | 20-30 µg total protein per lane |
| Transfer | Semi-dry, standard transfer |
| Membrane | 0.45 µm PVDF |
| Blocking | 5% non-fat milk or 5% BSA in TBST |
| Primary | PA2094 at datasheet starting dilution |
| Primary incubation | Overnight at 4 °C with gentle agitation |
| Secondary | Species-matched HRP conjugate at validated dilution |
| Wash | 3 × 5 min in TBST |
| Detection | Chemiluminescent substrate |
| Exposure | Bracket exposures to avoid saturation |
Use the product-observed 37.2 kDa band as the primary planning value and retain the UniProt calculated mass as context.
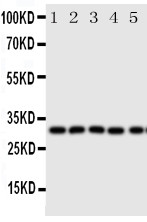
| 37.2 kDa | Matches the authoritative product WB observation. |
| 37.2 kDa calculated | Use as UniProt context, not as a replacement observed band. |
| Unexpected additional signal | Do not assign identity without orthogonal positive/negative controls. |
| Catalog-observed band | 37.2 kDa; use this as the primary experimental expectation. |
| Calculated mass | 37.2 kDa from UniProt O14520; retain as context. |
| Gel selection | 12-15%; shared with the recommended protocol and poster. |
| Specificity check | Compare the lead HPA positive and negative controls with PA2094. |
| Situation | Likely cause | Next action |
|---|---|---|
| 37.2 kDa | Matches the authoritative product WB observation. | Confirm with orthogonal controls and the linked product record. |
| Additional band | May reflect processing, modification, or non-specific signal. | Run a dilution series and compare positive/negative controls. |
| Weak signal | Target abundance or transfer may be limiting. | Verify transfer, increase positive-control abundance, and bracket exposure. |
Comprehensive Human Protein Atlas IHC scoring per tissue. Rows are taken directly from the HPA tissue chart — click any row's HPA link to view the source.
Deeper troubleshooting and optimisation questions for AQP9, answered from its protein features.
Mouse-reactive AQP9 Western blot reagents with authoritative product imagery.
Only image-backed, WB-validated Human/Mouse/Rat recommendations from the prepared catalog evidence are shown.