This website uses cookies to ensure you get the best experience on our website.


- Table of Contents
Plan chromogenic CDCA2 IHC around nuclear staining in most tissues and strong staining of pachytene spermatocytes in testis (HPA tissue IHC). Score staining by cell type and account for redistribution onto chromatin during anaphase (UniProt).

Expected localisation, validated protocols, controls and antibodies — the at-a-glance facts below, then the full design guide.
| Expected localisation | Predominantly nuclear in tissue IHC (HPA tissue IHC) | |
| Staining pattern | Nuclear staining in most tissues; strongest in testis (HPA tissue IHC) | |
| Antigen retrieval | Tris-EDTA pH 9.0 HIER, heat-mediated (datasheet A07293-2) | |
| Positive control | Appendix+4 more · see all | |
| Negative control | Adipose tissue+4 more · see all |
| Fixation | Matched tissue-IHC evidence does not establish the fixation claim. Validate the specimen-specific method before use. (selected-SKU IHC image A07293-2) | |
| Caveat | Mitotic redistribution can alter the expected nuclear pattern (UniProt) | |
| Regulation | Cell-cycle-dependent chromatin association (UniProt) | |
| Isoform / epitope | Two isoforms reported; check epitope coverage (UniProt) |
The catalog antibody protocol uses Tris-EDTA retrieval at pH 9.0 (datasheet A07293-2). Two published CDCA2 IHC protocols provide tissue preparation and staining details (PMC7039090; PMC7248370).
| Sample | Paraffin-embedded human tonsil tissue; fixative not specified (datasheet A07293-2) |
| Fixation | Image fixative and duration unreported (datasheet A07293-2); verify before use. |
| Sectioning | 4–5 µm sections on charged slides (standard) |
| Deparaffinisation | Xylene, graded ethanol series to water (standard) |
| Antigen retrieval | Heat retrieval: Tris-EDTA pH 9.0 (datasheet A07293-2); 20 min, 95–100 °C (standard) |
| Peroxidase block | 3% H2O2, 10 min, room temperature (standard) |
| Blocking | 10% normal serum of the secondary host, 30 min, room temperature (standard) |
| Primary antibody | Rabbit anti-CDCA2, 1:100-1:300 (datasheet A07293-2) |
| Primary incubation | Overnight at 4 °C (standard) |
| Detection | HRP-polymer secondary, DAB chromogen 5–10 min (standard) |
| Counterstain | Hematoxylin, blue, dehydrate and mount (standard) |
| Expected result | CDCA2-positive staining in endocrine cells of appendix (HPA tissue IHC: High). HPA tissue profile: Nuclear expression in a majority of tissues, most abundant in testis. No signal in the no-primary control. |
CDCA2 is a nuclear, nonmembrane protein that occupies the nucleoplasm during interphase and redistributes during mitosis (UniProt Q69YH5: localization and topology). In paraffin-section IHC, expect nuclear staining in a majority of tissues, with especially abundant staining in testis (HPA: tissue IHC profile). HPA rates the tissue profile Enhanced, while describing medium consistency between antibody staining and RNA expression (HPA: tissue IHC reliability).
| Distinct nuclear staining in testis pachytene spermatocytes, with little staining in nearby negative cells. | This matches a reported high-signal cell population and CDCA2’s usual nuclear location (HPA: High in testis pachytene spermatocytes; UniProt Q69YH5: nucleus). Score the named cell population and compartment together; a dark area elsewhere in the section does not establish the same pattern. |
| A few dividing cells show less sharply nuclear staining, while interphase cells retain nuclear staining. | Cell-cycle stage can change the appearance: CDCA2 is nucleoplasmic during G1, S and G2, becomes diffuse as the nuclear membrane breaks down, then accumulates on chromatin by anaphase (UniProt Q69YH5: cell-cycle localization). Interpret these cells alongside the section’s overall nuclear pattern. |
| Strong, widespread staining is confined to cell surfaces or cytoplasm, without a convincing nuclear pattern. | That distribution conflicts with the expected IHC profile and the absence of a transmembrane segment (HPA: nuclear expression in a majority of tissues; UniProt Q69YH5: localization and topology). Reassess specificity and detection before calling it CDCA2; isolated mitotic redistribution does not explain a section-wide surface pattern. |
| Adipocytes stain strongly, or staining follows tissue edges and other unexpected cell populations. | Adipocytes are reported as not detected, so strong staining there raises concern for cross-reactivity or endogenous detection activity (HPA: adipose adipocytes not detected). Compare staining with a control lacking primary antibody, and judge any unexpected population against its own HPA entry rather than treating an entire tissue as uniformly negative. |
| Color is diffuse across the section, or a known-positive population has no detectable signal. | Diffuse color without cell-restricted nuclear staining is difficult to score as CDCA2 (HPA: nuclear tissue IHC profile). Conversely, absence in testis pachytene spermatocytes conflicts with their reported high staining (HPA: High in testis pachytene spermatocytes). Check slide quality and controls before interpreting either result biologically. |
| Cell-cycle position (UniProt Q69YH5: localization) | Interphase CDCA2 occupies nucleoplasm and is excluded from nucleoli; mitotic cells can appear diffuse before chromatin accumulation at anaphase (UniProt Q69YH5: cell-cycle localization). A rare dividing cell should therefore be interpreted in context, rather than used to redefine the expected whole-section staining pattern. |
| Cell population and tissue (HPA: tissue IHC profile) | HPA reports high staining in testis pachytene spermatocytes and intestinal endocrine cells, medium staining in bone-marrow hematopoietic cells and breast glandular cells, and no detection in listed populations including adipocytes (HPA: tissue IHC). Select and score the documented cell population; neighboring cells need not share its staining level. |
| Antibody evidence (HPA: antibody validation) | HPA lists Enhanced IHC validation for HPA030049, meaning its pattern was reproduced by independent antibodies or orthogonal data; HPA026293 has no listed IHC status (HPA: antibodies). This supports using the validated pattern as a reference, while a different antibody’s result still needs its own controls. |
| IF/ICC: where is CDCA2 seen? (HPA: subcellular ICC-IF) | The supported main location is nucleoplasm; HPA also lists cytosol as an uncertain additional location (HPA: subcellular ICC-IF). Treat an IF/ICC cytosolic signal cautiously and consult the separate IF/ICC guide for that application. The ICC-IF observation does not by itself change the expected nuclear IHC interpretation. |
| Situation | Likely cause | Next action |
|---|---|---|
| No stain in testis pachytene spermatocytes (HPA: High in testis pachytene spermatocytes). | The run may have failed, the relevant cells may be absent from the examined field, or the antibody may not work under the chosen IHC conditions; the supplied sources do not identify a CDCA2-specific fixation effect. | First locate the reported cell population, then inspect the run controls. If controls indicate a technical failure, revisit the catalog antibody’s validated IHC-P workflow and repeat the run before assigning a biological negative. |
| Staining is only cytoplasmic or at cell borders across many cells (HPA: nuclear tissue IHC profile). | A broad nonnuclear pattern is inconsistent with CDCA2’s usual localization and lack of a transmembrane segment (UniProt Q69YH5: localization and topology); nonspecific staining or detection background is plausible. | Compare with a control lacking primary antibody and inspect whether any clear nuclear signal remains. Review antibody specificity and detection conditions before scoring the nonnuclear color as CDCA2. |
| Adipocytes or another HPA-negative population stain strongly (HPA: adipocytes not detected). | Cross-reactivity or endogenous detection activity can mimic a positive chromogenic result. An HPA-negative designation applies to the named cell population, not automatically to every cell in that tissue (HPA: tissue IHC entries). | Confirm the stained cell identity, compare a control lacking primary antibody, and assess the detection system’s background. Report unexpected staining separately from staining in documented positive populations. |
| Diffuse brown haze obscures nuclei across the section. | High general background can prevent assessment of the cell-restricted nuclear pattern reported by HPA (HPA: tissue IHC profile). This appearance alone cannot establish a CDCA2-specific cause. | Review a control lacking primary antibody, washing, blocking and detection steps as general IHC quality checks. Optimize the run until nuclei and cell boundaries can be assessed, then rescore the same tissue. |
| Only scattered dividing cells look diffuse, while other positive cells look nuclear. | CDCA2 redistributes when the nuclear membrane breaks down and later accumulates on anaphase chromatin (UniProt Q69YH5: cell-cycle localization). These stage-dependent appearances can differ from interphase nucleoplasmic staining. | Assess nuclear staining in interphase cells and note the morphology of the scattered dividing cells. Avoid classifying a whole slide as having cytoplasmic CDCA2 on the basis of those cells alone. |
| A newly selected antibody gives a different tissue pattern from the reference. | HPA reports Enhanced IHC validation for HPA030049 but no listed IHC status for HPA026293; that evidence does not validate every antibody equally (HPA: antibodies). | Check the new antibody’s documented IHC suitability, run controls and the named HPA-positive cell populations. If the disagreement persists, describe it as an antibody-dependent result rather than changing the expected pattern. |

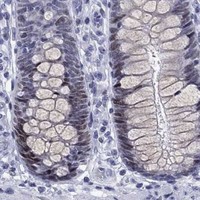


Comprehensive Human Protein Atlas IHC scoring per tissue (reliability: Enhanced — Medium consistency between antibody staining and RNA expression data.). Rows are taken directly from the HPA tissue chart — click any row's HPA link to view the source.
| Tissue | Cell type | Level | Evidence | Source |
|---|---|---|---|---|
| Appendix | Endocrine cells | High | Protein (IHC) | HPA → |
| Colon | Endocrine cells | High | Protein (IHC) | HPA → |
| Duodenum | Endocrine cells | High | Protein (IHC) | HPA → |
| Rectum | Endocrine cells | High | Protein (IHC) | HPA → |
| Small intestine | Endocrine cells | High | Protein (IHC) | HPA → |
| Tissue | Cell type | Level | Evidence | Source |
|---|---|---|---|---|
| Adipose tissue | Adipocytes | Not detected | Protein (IHC) | HPA → |
| Adrenal gland | Glandular cells | Not detected | Protein (IHC) | HPA → |
| Cerebellum | Cells in granular layer | Not detected | Protein (IHC) | HPA → |
| Heart muscle | Cardiomyocytes | Not detected | Protein (IHC) | HPA → |
| Hippocampus | Glial cells | Not detected | Protein (IHC) | HPA → |
Troubleshoot CDCA2 staining by checking nuclear localisation, cell identity and section controls before comparing signal across specimens (UniProt Q69YH5; HPA tissue IHC).
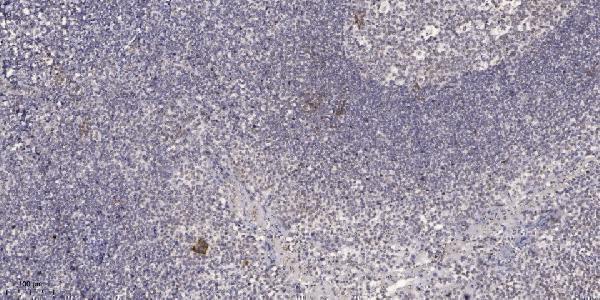
A07293-2 covers human IHC and IF (catalog: applications and reactivity), with an IHC image of paraffin-embedded human tonsil (catalog: IHC caption).
A07293-2 is listed for human IHC and IF (catalog: applications and reactivity). Its IHC image shows paraffin-embedded human tonsil; no IF image is supplied (catalog: IHC caption; IF image list empty).
Which to pick: Choose A07293-2 for paraffin-section IHC: its own caption shows human tonsil stained at 1:200 after Tris-EDTA retrieval at pH 9.0 (catalog: IHC caption); the fixative is unreported. For IF/ICC, A07293-2 lists IF at 1:50, but supplies no IF image (catalog: dilution and IF image list). No cross-species option is documented, and clonality is unreported (catalog: Human reactivity; clone unspecified).