This website uses cookies to ensure you get the best experience on our website.


- Table of Contents
Plan chromogenic FAF1 IHC with nuclear and cytoplasmic staining as the tissue reference (HPA tissue IHC). Start the catalog antibody at 2.5 μg/mL and compare strong salivary gland or testis staining with reported unstained cell populations (datasheet: IHC; HPA tissue IHC).

Expected localisation, validated protocols, controls and antibodies — the at-a-glance facts below, then the full design guide.
| Expected localisation | Nuclear and cytoplasmic tissue staining (HPA tissue IHC) | |
| Staining pattern | General cytoplasmic and nuclear staining (HPA tissue IHC) | |
| Antigen retrieval | Tris-EDTA pH 9.0 HIER, 95–98 °C, 20 min (rule: nuclear antigen) | |
| Positive control | Salivary gland+4 more · see all | |
| Negative control | Caudate+2 more · see all |
| Fixation | Keep fixation consistent across sections (standard IHC practice; not target-specific); Matched tissue-IHC evidence does not establish the fixation claim. Validate the specimen-specific method before use. (selected-SKU IHC image A03842) | |
| Caveat | Only medium consistency between staining and RNA (HPA tissue IHC) | |
| Regulation | Most abundant in testis; stimulus effects unknown (UniProt) | |
| Isoform / epitope | 2 isoforms; no transmembrane span; epitope coverage unknown (UniProt) |
The catalog antibody’s IHC-P protocol is paired with three published FAF1 staining protocols for gastric tissue and mouse ovary (PMC3530185; PMC5352377; PMC5902905).
| Sample | Tissue sections; selected-image fixative not specified (standard IHC workflow) |
| Fixation | Image fixative and duration unreported (datasheet A03842); verify before use. |
| Sectioning | 4–5 µm sections on charged slides (standard) |
| Deparaffinisation | Xylene, graded ethanol series to water (standard) |
| Antigen retrieval | Heat-induced epitope retrieval in Tris-EDTA buffer, pH 9.0, 20 min at 95–98 °C (standard rule: nuclear antigen) |
| Peroxidase block | 3% H2O2, 10 min, room temperature (standard) |
| Blocking | 10% normal serum of the secondary host, 30 min, room temperature (standard) |
| Primary antibody | Rabbit anti-FAF1, 2.5 μg/mL (datasheet A03842) |
| Primary incubation | Overnight at 4 °C (standard) |
| Detection | HRP-polymer secondary, DAB chromogen 5–10 min (standard) |
| Counterstain | Hematoxylin, blue, dehydrate and mount (standard) |
| Expected result | FAF1-positive staining in glandular cells of salivary gland (HPA tissue IHC: High). HPA tissue profile: General cytoplasmic and nuclear expression. No signal in the no-primary control. |
FAF1 is a nuclear protein with no transmembrane segment (UniProt Q9UNN5: subcellular location and topology). In tissue IHC, expect nuclear and cytoplasmic staining, especially in salivary glandular cells and cells in testis seminiferous ducts (HPA tissue IHC: general profile; High in both cell populations). HPA rates the tissue pattern Approved, with medium consistency between antibody staining and RNA expression (HPA tissue IHC: reliability).
| Nuclear and cytoplasmic staining in salivary glandular cells or cells in testis seminiferous ducts. | This fits the reported tissue pattern, with High staining in both cell populations (HPA tissue IHC: profile and positive tissues). Assess the named cells within each section; HPA's tissue observations do not imply that every cell in that tissue stains equally. |
| Strong staining restricted to plasma membranes or extracellular material, without a convincing cellular pattern. | This differs from the reported nuclear and cytoplasmic tissue pattern and nuclear UniProt location (HPA tissue IHC: profile; UniProt Q9UNN5: subcellular location). Review morphology, the negative control and detection background before interpreting it as FAF1; UniProt reports no transmembrane segment (UniProt Q9UNN5: topology). |
| Prominent signal in cholangiocytes, chondrocytes or caudate glial cells. | Those specific cell populations were not detected in HPA tissue IHC (HPA tissue IHC: negative tissues). Unexpected staining warrants a check for cross-reactivity or endogenous detection activity; a tissue label alone cannot substitute for identifying the stained cell type. |
| Diffuse colour across cells and surrounding section, obscuring nuclei and tissue boundaries. | Treat this as possible background before scoring compartments (general IHC practice). Inspect the negative control, blocking and chromogen development; the HPA report of general cytoplasmic and nuclear expression does not establish that indiscriminate staining is a true positive (HPA tissue IHC: profile). |
| No detectable signal in salivary glandular cells or cells in testis seminiferous ducts. | These are reported High cell populations, so an absent signal calls for a run-level check (HPA tissue IHC: positive tissues). Confirm tissue identity and cellular preservation, then review antibody dilution, retrieval and detection against the catalog antibody's IHC-P instructions (general IHC practice). |
| Choice of positive and comparison cells | Salivary glandular cells and testis seminiferous-duct cells have High staining; adrenal glandular and bone-marrow hematopoietic cells have Medium staining (HPA tissue IHC: positive tissues). Compare the specified cell populations, since HPA's levels are cell-specific observations. |
| Low and undetected populations | HPA reports Low staining in lung macrophages and heart cardiomyocytes, and no detected staining in liver cholangiocytes (HPA tissue IHC: low and negative tissues). Low signal can be harder to distinguish from background; an undetected population is a useful comparison, not proof that an entire organ lacks FAF1. |
| Compartment evidence | UniProt lists the nucleus; HPA tissue IHC describes general nuclear and cytoplasmic expression (UniProt Q9UNN5: subcellular location; HPA tissue IHC: profile). Score both compartments in tissue sections and avoid treating cytoplasmic staining alone as proof of an artifact. |
| Antibody evidence | HPA lists CAB072814 as IHC Approved, while HPA018253 has no listed IHC status (HPA antibodies: IHC validation). The overall tissue profile is Approved with medium staining-to-RNA consistency (HPA tissue IHC: reliability); interpret a new reagent's pattern with its own controls. |
| Protein form and assay conditions | UniProt records Long and Short isoforms and a single annotated chain spanning residues 1–650, with no signal peptide or propeptide (UniProt Q9UNN5: isoforms and processing). These annotations alone do not establish an antibody's epitope, its isoform coverage or a target-specific retrieval requirement. |
| IF/ICC: where should signal localize? | Predominantly in the nucleoplasm (HPA subcellular ICC-IF: enhanced); acrosome, equatorial segment and perinuclear theca are additional reported locations (HPA subcellular ICC-IF: approved). Use this as an IF/ICC interpretation cue; the tissue IHC profile also includes cytoplasmic staining (HPA tissue IHC: profile). |
| Situation | Likely cause | Next action |
|---|---|---|
| Known-positive cells are blank. | The assay may have failed to reveal antigen; HPA reports High staining in salivary glandular cells and testis seminiferous-duct cells (HPA tissue IHC: positive tissues). | Check the positive control and tissue morphology, then verify dilution, retrieval and detection against the catalog antibody's IHC-P instructions (general IHC practice). Do not infer FAF1-specific fixation sensitivity from this result. |
| The whole section develops colour, including spaces outside cells. | Diffuse deposition may reflect blocking or detection background (general IHC practice); it is not the defined cellular profile (HPA tissue IHC: profile). | Inspect the negative control and review blocking, washes and chromogen development (general IHC practice). Score FAF1 only where a cellular compartment remains identifiable. |
| Unexpected strong signal appears in cholangiocytes, chondrocytes or caudate glial cells. | HPA reports these cells as not detected (HPA tissue IHC: negative tissues); cross-reactivity or endogenous detection activity is possible. | Confirm the cell identification, compare a negative control, and assess the detection system's endogenous activity control (general IHC practice). Treat the signal as unresolved until those checks support specificity. |
| Staining appears only on membranes or extracellular structures. | That distribution conflicts with the reported nuclear and cytoplasmic tissue profile (HPA tissue IHC: profile) and the absence of a transmembrane segment (UniProt Q9UNN5: topology). | Recheck cellular boundaries and the negative control; compare with a known-positive section processed in the same run (general IHC practice). Avoid assigning this pattern to FAF1 solely from colour intensity. |
| A low-staining population looks negative. | HPA reports Low staining in lung macrophages and heart cardiomyocytes (HPA tissue IHC: low tissues); weak true signal may be difficult to separate from background. | First verify performance in a reported High population, then compare the low-staining cells with nearby background at the same detection settings (HPA tissue IHC: positive and low tissues; general IHC practice). |
| IF/ICC shows little nucleoplasmic signal despite a coloured IHC section. | HPA reports mainly nucleoplasmic ICC-IF localization, while its tissue IHC profile includes nuclear and cytoplasmic staining (HPA subcellular ICC-IF: summary; HPA tissue IHC: profile). | Interpret each assay against its own reported pattern and controls; check cell boundaries and nuclear identification before comparing compartments (general IHC/IF practice). |


Comprehensive Human Protein Atlas IHC scoring per tissue (reliability: Approved — Medium consistency between antibody staining and RNA expression data.). Rows are taken directly from the HPA tissue chart — click any row's HPA link to view the source.
| Tissue | Cell type | Level | Evidence | Source |
|---|---|---|---|---|
| Salivary gland | Glandular cells | High | Protein (IHC) | HPA → |
| Testis | Cells in seminiferous ducts | High | Protein (IHC) | HPA → |
| Adrenal gland | Glandular cells | Medium | Protein (IHC) | HPA → |
| Appendix | Glandular cells | Medium | Protein (IHC) | HPA → |
| Bone marrow | Hematopoietic cells | Medium | Protein (IHC) | HPA → |
Troubleshoot FAF1 staining in paraffin-section IHC by checking retrieval, compartment-specific signal, controls and scoring; the IF guidance addresses the separate application.
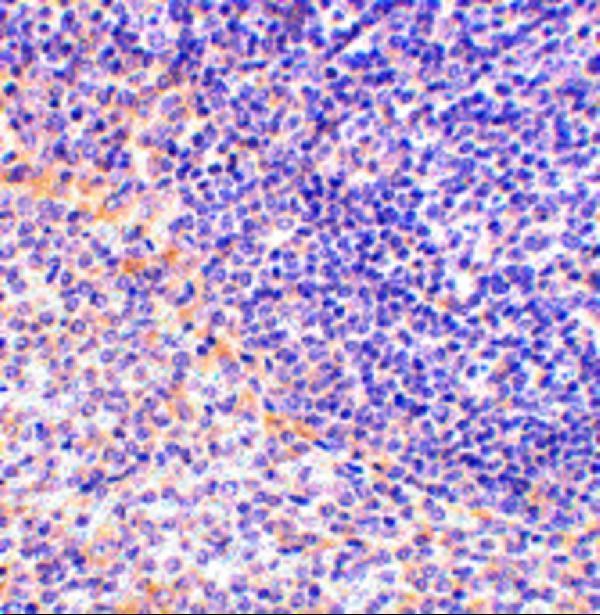
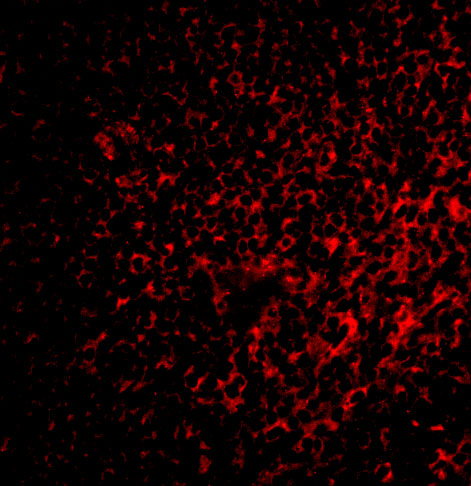
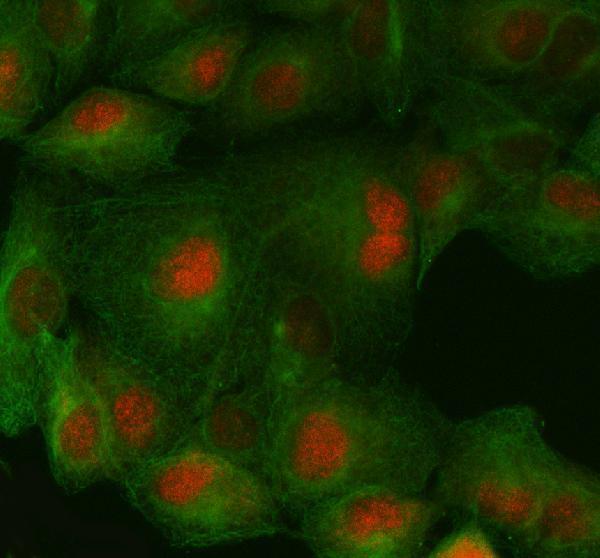
A03842 has IHC data in rat spleen tissue (A03842 image caption); A03842-1 has IF/ICC data in A549 cells (A03842-1 image caption). Both list Human, Mouse, and Rat reactivity (catalog).
A03842 lists IHC-P and shows FAF1 staining in rat spleen tissue at 2.5 μg/mL (A03842 applications; A03842 IHC image caption). A03842-1 lists IF and ICC and shows FAF1 staining in A549 cells at 5 μg/mL (A03842-1 applications; A03842-1 IF image caption).
Which to pick: Choose A03842 for paraffin-section IHC: it lists IHC-P and its IHC image shows rat spleen tissue, although the caption does not report the fixative (A03842 applications; A03842 IHC image caption). Choose A03842-1 for IF/ICC in cells because its image shows staining in A549 cells; it does not list IHC-P (A03842-1 IF image caption; A03842-1 applications). For cross-species planning, both list Human, Mouse, and Rat reactivity, while the supplied IHC image documents rat tissue only (catalog reactivity; A03842 IHC image caption).