This website uses cookies to ensure you get the best experience on our website.


- Table of Contents
Plan FAT1 paraffin IHC around variable cytoplasmic staining and distinct gastrointestinal membrane staining (HPA tissue IHC). Duodenum and small-intestine glandular cells show high staining and can serve as positive references (HPA tissue IHC).

Expected localisation, validated protocols, controls and antibodies — the at-a-glance facts below, then the full design guide.
| Expected localisation | Variable cytoplasmic staining; distinct GI membrane staining (HPA tissue IHC) | |
| Staining pattern | Most tissues show variable cytoplasm; GI tract shows membranes (HPA tissue IHC) | |
| Antigen retrieval | Tris-EDTA pH 9.0 HIER, heat-mediated (datasheet A01536-1) | |
| Positive control | Cerebellum+4 more · see all | |
| Negative control | Bone marrow+1 more · see all |
| Fixation | Keep fixation consistent across sections (standard IHC practice; not target-specific); Matched tissue-IHC evidence does not establish the fixation claim. Validate the specimen-specific method before use. (selected-SKU IHC image A01536-1) | |
| Caveat | Staining has medium consistency with RNA expression (HPA tissue IHC) | |
| Regulation | Regulation not specified (UniProt) | |
| Isoform / epitope | No isoforms annotated; extracellular vs cytoplasmic epitope matters (UniProt) |
The catalog antibody uses Tris-EDTA pH 9.0 heat retrieval (datasheet A01536-1). The published FAT1 IHC option covers coronary and carotid artery sections (PMC5257202 methods).
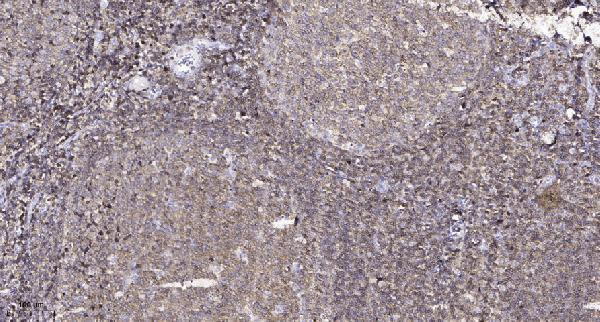
| Sample | Paraffin-embedded human tonsil tissue; fixative not specified (datasheet A01536-1) |
| Fixation | Image fixative and duration unreported (datasheet A01536-1); verify before use. |
| Sectioning | 4–5 µm sections on charged slides (standard) |
| Deparaffinisation | Xylene, graded ethanol series to water (standard) |
| Antigen retrieval | Heat retrieval: Tris-EDTA pH 9.0 (datasheet A01536-1); 20 min, 95–100 °C (standard) |
| Peroxidase block | 3% H2O2, 10 min, room temperature (standard) |
| Blocking | 10% normal serum of the secondary host, 30 min, room temperature (standard) |
| Primary antibody | Rabbit anti-FAT1, 1:50 recommended; image 1:200 (datasheet A01536-1) |
| Primary incubation | Overnight at 4 °C (standard) |
| Detection | HRP-polymer secondary, DAB chromogen 5–10 min (standard) |
| Counterstain | Hematoxylin, blue, dehydrate and mount (standard) |
| Expected result | FAT1-positive staining in cells in molecular layer of cerebellum (HPA tissue IHC: High). HPA tissue profile: Cytoplasmic expression in most tissues at variable levels. Distinct membranous expression in gastrointestinal tract and high expression in the CNS. No signal in the no-primary control. |
FAT1 is a single-pass membrane protein with a large extracellular region; UniProt also lists a nuclear form (UniProt Q14517 topology and processing). In tissue IHC, expect variable cytoplasmic staining across many tissues, distinct membrane staining in gastrointestinal glandular cells, and strong staining in selected CNS cells (HPA tissue IHC). HPA rates its tissue profile “Enhanced,” while reporting medium consistency between antibody staining and RNA expression (HPA tissue IHC).
| A clear cell-edge pattern in duodenal or small-intestinal glandular cells, with strong signal. | This fits the distinct gastrointestinal membrane pattern and High staining reported for these cells (HPA tissue IHC). Assess the stained cells and their location together: FAT1 has a membrane-spanning region and extracellular domain (UniProt Q14517 topology), but HPA also reports cytoplasmic staining in many tissues (HPA tissue IHC). |
| Strong staining in cerebral-cortex or hippocampal neuronal cells, or cerebellar molecular-layer cells. | These are reported High-staining CNS populations (HPA tissue IHC). A positive result there need not look identical to a gastrointestinal membrane pattern: HPA describes high CNS expression alongside variable cytoplasmic staining across tissues (HPA tissue IHC). Compare the observed cell population and compartment with the chosen tissue’s HPA pattern before scoring. |
| Predominantly nuclear staining, or staining confined to a compartment unexpected for the selected tissue. | Treat this as unresolved rather than automatically positive: UniProt lists both cell-membrane and nuclear localization and a nuclear form (UniProt Q14517 localization and processing), whereas HPA’s tissue summary emphasizes cytoplasmic and gastrointestinal membranous patterns (HPA tissue IHC). Check the antibody’s documented epitope and controls before attributing isolated nuclear signal to FAT1 (standard IHC practice). |
| Strong staining in bone-marrow hematopoietic cells or heart-muscle cardiomyocytes. | HPA reports FAT1 as Not detected in these respective cell populations (HPA tissue IHC). Unexpected signal raises concern for cross-reactivity or endogenous chromogenic detection activity; those are possible IHC explanations, not diagnoses from the HPA profile (standard IHC practice). Review the cell identity and a no-primary control before interpreting the stain. |
| Diffuse color across cells, stroma, and slide background, or no signal in a known-positive tissue. | Diffuse deposition lacks the cell-specific pattern needed for interpretation and can reflect nonspecific staining or detection background (standard IHC practice). Conversely, absent signal in High-staining duodenal glandular cells or cerebral-cortex neuronal cells warrants a technical check before calling the specimen negative (HPA tissue IHC; standard IHC practice). |
| Membrane topology and antibody epitope | FAT1 has an extracellular region at residues 22–4181, one transmembrane segment at 4182–4202, and a cytoplasmic region at 4203–4588 (UniProt Q14517 topology). The payload gives no epitope for the catalog antibody, so topology alone cannot predict which FAT1 form or compartment it detects. |
| Processing and nuclear interpretation | UniProt lists a signal peptide at residues 1–21, a FAT1 chain at 22–4588, and a nuclear form; it gives no cleavage mechanism here (UniProt Q14517 processing). Nuclear staining therefore needs antibody-specific validation rather than an assumed processing explanation (standard IHC practice). |
| Tissue and cell selection | Duodenal and small-intestinal glandular cells and several listed CNS cell populations are High, while stomach glandular cells are Medium (HPA tissue IHC). Bone-marrow hematopoietic cells and cardiomyocytes are Not detected (HPA tissue IHC). Score the named cell population, since a tissue-wide positive or negative label loses that distinction. |
| Strength of the tissue evidence | The HPA tissue profile is Enhanced but has medium agreement between staining and RNA data (HPA tissue IHC). Its antibody entries list IHC Enhanced for HPA001869 and IHC Approved for HPA023882 (HPA antibodies). These labels support use of the reported patterns as references; they do not establish the performance of another antibody. |
| IF/ICC Q&A: what localization is expected? | HPA summarizes FAT1 subcellular localization as Membrane, but supplies no main-location designation or ICC-IF cell-line images here (HPA subcellular). UniProt also lists nuclear localization (UniProt Q14517 localization). Use the separate IF/ICC guide for that application; this record does not justify an IF-specific staining protocol. |
| Situation | Likely cause | Next action |
|---|---|---|
| No color in duodenal or small-intestinal glandular cells selected as a positive reference. | These cells are reported High (HPA tissue IHC); absent staining could reflect a failed IHC workflow or antibody performance (standard IHC practice). | Confirm that the expected glandular cells are present, then review the catalog antibody’s IHC-P instructions, detection reagents, and a concurrently stained positive control (standard IHC practice). Do not infer a FAT1-specific fixation effect from this result. |
| CNS reference tissue stains weakly or unevenly. | HPA reports High staining in specified cerebellar, cerebral-cortex, and hippocampal cell populations, not every CNS cell (HPA tissue IHC). | Identify the relevant population and compare staining within that population (HPA tissue IHC). Check section quality, detection performance, and consistency of routine IHC processing across slides (standard IHC practice). |
| Strong color appears in bone-marrow hematopoietic cells or cardiomyocytes. | Both populations are Not detected in the HPA tissue profile (HPA tissue IHC); cross-reactivity or endogenous detection activity is possible (standard IHC practice). | Run a no-primary control and review whether the color tracks the expected cell type or persists without primary antibody (standard IHC practice). Reassess the antibody before treating the result as FAT1. |
| Broad haze obscures cell borders and makes the pattern hard to score. | Diffuse background can arise from nonspecific binding or the chromogenic detection system (standard IHC practice). | Check the no-primary control and routine blocking and wash steps; score FAT1 only where signal can be assigned to cells and compartments (standard IHC practice). HPA’s tissue profile does not specify a FAT1-specific remedy (HPA tissue IHC). |
| A slide shows only nuclear staining. | A nuclear FAT1 form is listed, but the supplied record does not identify the antibody epitope or validate this isolated pattern (UniProt Q14517 processing; HPA tissue IHC). | Check the antibody’s epitope documentation and compare a suitable positive tissue and control slides before assigning the nuclear signal to FAT1 (standard IHC practice). Avoid calling it an artifact solely because FAT1 is membrane-associated (UniProt Q14517 localization). |
| Membrane staining is absent while cytoplasmic staining remains visible. | HPA reports variable cytoplasmic staining in most tissues and distinct membranous staining in the gastrointestinal tract (HPA tissue IHC). The expected compartment depends on the examined tissue. | Confirm tissue and cell identity, then compare with that tissue’s HPA pattern (HPA tissue IHC). If gastrointestinal glandular cells are the target, review the catalog antibody’s IHC-P conditions and positive control (standard IHC practice). |
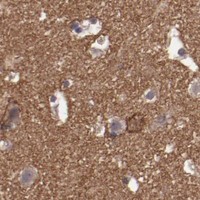

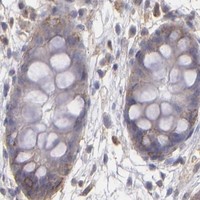

Comprehensive Human Protein Atlas IHC scoring per tissue (reliability: Enhanced — Medium consistency between antibody staining and RNA expression data.). Rows are taken directly from the HPA tissue chart — click any row's HPA link to view the source.
| Tissue | Cell type | Level | Evidence | Source |
|---|---|---|---|---|
| Cerebellum | Cells in molecular layer | High | Protein (IHC) | HPA → |
| Cerebral cortex | Neuronal cells | High | Protein (IHC) | HPA → |
| Duodenum | Glandular cells | High | Protein (IHC) | HPA → |
| Hippocampus | Neuronal cells | High | Protein (IHC) | HPA → |
| Small intestine | Glandular cells | High | Protein (IHC) | HPA → |
Troubleshoot FAT1 staining in paraffin section IHC by checking retrieval, staining compartment, tissue context and controls before comparing scores.
A01536-1 is a human-reactive anti-FAT1 antibody listed for IHC and IF (catalog: applications and reactivity), with a real IHC image of a paraffin-embedded human tonsil section (IHC image caption).
A01536-1 is the only card and is listed for human IHC and IF (catalog: applications and reactivity). Its image documents IHC on a paraffin-embedded human tonsil section; no IF image is supplied (catalog: image captions).
Which to pick: Choose A01536-1 for human paraffin-section IHC: its own caption documents tonsil staining with Tris-EDTA retrieval at pH 9.0 and primary antibody at 1:200 overnight (IHC image caption). A01536-1 is also listed for IF at 1:50, but the payload supplies no IF image or ICC validation (catalog: applications, IF dilution and image captions). Its listed reactivity is Human, so cross-species use is unvalidated; its host is Rabbit and clonality is unreported (catalog: reactivity, host and clone), and the caption does not report the tissue fixative (IHC image caption).