This website uses cookies to ensure you get the best experience on our website.


- Table of Contents
Plan PPL IHC in paraffin sections using membranous squamous epithelial staining and kidney collecting ducts as a high staining control (HPA tissue IHC). The guide covers fixation, the catalog antibody’s 2–5 μg/ml IHC range (datasheet A02098-1), chromogenic detection and staining interpretation.

Expected localisation, validated protocols, controls and antibodies — the at-a-glance facts below, then the full design guide.
| Expected localisation | Membranous in squamous epithelium (HPA tissue IHC) | |
| Staining pattern | Membranous staining of squamous epithelial cells (HPA tissue IHC) | |
| Antigen retrieval | EDTA pH 8.0 HIER, heat-mediated (datasheet A02098-1) | |
| Positive control | Kidney+4 more · see all | |
| Negative control | Adipose tissue+4 more · see all |
| Fixation | Keep fixation consistent across sections (standard IHC practice; not target-specific) | |
| Caveat | Collecting ducts also stain strongly (HPA tissue IHC) | |
| Regulation | Enhanced in cervix, esophagus, vagina (HPA tissue RNA) | |
| Isoform / epitope | 0 isoforms; no cleavage or transmembrane segment for epitope mapping (UniProt) |
The catalog antibody’s IHC-P protocol is complemented by published PPL staining methods for cryostat sections, human esophageal carcinoma, and mouse liver (PMC3195110; PMC4380967; PMC12198045).
| Sample | Paraffin-embedded human lung cancer tissue; fixative not specified (datasheet A02098-1) |
| Fixation | Image fixative and duration unreported (datasheet A02098-1); verify before use. |
| Sectioning | 4–5 µm sections on charged slides (standard) |
| Deparaffinisation | Xylene, graded ethanol series to water (standard) |
| Antigen retrieval | Heat retrieval: EDTA pH 8.0 (datasheet A02098-1); 20 min, 95–100 °C (standard) |
| Peroxidase block | 3% H2O2, 10 min, room temperature (standard) |
| Blocking | 10% goat serum (datasheet A02098-1) |
| Primary antibody | Rabbit anti-PPL, 2-5 μg/ml (datasheet A02098-1) |
| Primary incubation | Overnight at 4 °C (datasheet A02098-1) |
| Detection | Streptavidin-biotin complex (SABC), DAB chromogen (datasheet A02098-1) |
| Counterstain | Hematoxylin, blue, dehydrate and mount (standard) |
| Expected result | PPL-positive staining in collecting ducts of kidney (HPA tissue IHC: High). HPA tissue profile: Membranous expression in squamous epithelium. No signal in the no-primary control. |
Expect PPL chiefly along epithelial cell borders, especially in squamous epithelium (HPA: tissue IHC profile). This fits its desmosomal, lateral membrane and cytoskeletal localization despite having no transmembrane segment (UniProt O60437: localization and topology). HPA rates tissue IHC reliability Enhanced, while reporting only medium consistency between staining and RNA expression (HPA: tissue IHC reliability). Judge a section by its cell types and staining pattern together.
| Distinct border staining in esophageal squamous epithelial cells, with moderate signal (HPA: Esophagus, Medium). | This matches the reported membranous squamous pattern (HPA: tissue IHC profile). A border-associated signal is also consistent with PPL at desmosomes and the lateral membrane (UniProt O60437: localization). Assess the stained cells against neighboring cells rather than treating every brown area as equivalent. |
| Strong staining in kidney collecting ducts (HPA: Kidney collecting ducts, High). | This is a useful second positive pattern because HPA reports a different epithelial cell population at a higher level (HPA: Kidney collecting ducts, High). Its presence supports detection, but intensity alone cannot establish specificity; check that staining follows the expected cells and compartment. |
| Predominantly nuclear staining in a squamous epithelial IHC section. | Treat this as discordant with the reported membranous tissue pattern (HPA: tissue IHC profile). UniProt also lists junctional, membrane and cytoskeletal locations (UniProt O60437: localization). Recheck morphology and controls before scoring it as PPL; the uncertain nucleoplasmic IF annotation does not establish a dominant nuclear IHC pattern (HPA: subcellular ICC-IF). |
| Prominent staining of adipocytes or bone marrow hematopoietic cells. | HPA reports PPL as not detected in those cells (HPA: Adipose tissue; Bone marrow). Consider antibody cross-reactivity or endogenous detection activity, particularly if the color persists without primary antibody (general IHC practice). Review control sections and avoid calling those cells positive on color alone. |
| Hazy color across cells and surrounding tissue, or no signal in an expected positive section. | Diffuse color obscures the cell-border pattern and may reflect background from blocking, washes or detection chemistry (general IHC practice). No signal in esophageal squamous cells or kidney collecting ducts conflicts with HPA observations (HPA: Esophagus, Medium; Kidney collecting ducts, High), but does not by itself identify the failed step. |
| Choice of tissue and cell population | HPA reports medium staining in esophageal squamous cells and high staining in kidney collecting ducts (HPA: tissue IHC). It reports adipocytes and bone marrow hematopoietic cells as not detected (HPA: tissue IHC). Select and score the named cell population; a whole-section average can hide that distinction. |
| Compartment and molecular topology | PPL is assigned to desmosomes, lateral membrane and cytoskeleton, and has no transmembrane segment (UniProt O60437: localization and topology). Thus border-associated staining is plausible without assuming that the protein spans the membrane. HPA's tissue IHC summary specifically describes membranous staining in squamous epithelium (HPA: tissue IHC profile). |
| Antibody validation and agreement | Both listed antibodies have Enhanced IHC status (HPA: HPA042550; HPA059859). HPA defines this status through agreement between independent antibodies or orthogonal data, while its tissue summary reports medium agreement with RNA expression (HPA: antibody validation; tissue reliability). Use the reported pattern as a benchmark, not proof that every stained structure is specific. |
| Antigen retrieval and epitope | No antibody epitope or PPL-specific retrieval condition is provided in these payloads. Retrieval conditions can be compared using a positive tissue and a negative control as a general paraffin-IHC optimization step (general IHC practice). Do not infer a preferred retrieval method or fixation sensitivity from HPA staining levels or UniProt topology. |
| Detection background | Chromogenic signal can arise from endogenous detection activity or nonspecific reagent binding (general IHC practice). A no-primary control helps distinguish such color from antibody-dependent staining (general IHC practice). Evaluate background in the same tissue and cell population used for the PPL call. |
| Processing and modification | UniProt lists a single PPL chain, no signal peptide or propeptide, and several phosphoserines (UniProt O60437: processing and modified residues). These annotations provide no evidence here that shedding, a particular phosphorylation state or fixation changes this IHC pattern. Do not use them to explain an absent signal without additional evidence. |
| Situation | Likely cause | Next action |
|---|---|---|
| Esophageal squamous cells lack the expected border signal (HPA: Esophagus, Medium). | The negative result could reflect staining workflow failure or a sample difference; HPA's reported level does not identify the cause. | Check tissue morphology, the control slide and detection reagents; then compare retrieval and antibody conditions on the same expected positive tissue (general IHC practice). Record which step restores a cell-border pattern. |
| Kidney collecting ducts are weak or unstained despite a valid positive control (HPA: Kidney collecting ducts, High). | The observed section may differ from HPA's reported high staining, or the local staining conditions may limit detection; the payloads do not establish a PPL-specific fixation effect. | Verify that collecting ducts are present and identifiable, then assess antibody concentration and detection conditions with matched controls (general IHC practice). Do not score unrelated kidney cells as the expected positive population. |
| Brown color fills the section and cell borders cannot be resolved. | Nonspecific binding or detection background may be obscuring the membranous pattern (general IHC practice; HPA: tissue IHC profile). | Inspect a no-primary control, review blocking and washes, and reduce detection intensity if background persists (general IHC practice). Reassess only after cell boundaries are visible. |
| Adipocytes or hematopoietic cells stain strongly (HPA: both cell types Not detected). | Cross-reactivity or endogenous detection activity is possible; positive chromogen alone cannot distinguish them (general IHC practice). | Compare the suspect cells with a no-primary control and the expected epithelial pattern. If the color is antibody-dependent, assess specificity with an independent validated antibody where available (HPA: two Enhanced IHC antibodies). |
| Nuclear staining dominates the epithelial IHC result. | This differs from HPA's membranous squamous IHC profile; HPA's nucleoplasmic ICC-IF annotation is marked uncertain (HPA: tissue IHC; subcellular ICC-IF). | Check counterstain interpretation and no-primary staining, then compare with an expected positive section and an independent antibody if available (general IHC practice; HPA: antibody validation). Do not score nuclear dominance as the established tissue pattern. |
| Q: Should an IF/ICC image be interpreted by the paraffin-IHC pattern? | HPA reports plasma membrane, cytosol and basal body as uncertain main ICC-IF locations, plus uncertain nucleoplasm (HPA: subcellular ICC-IF). Its IHC and ICC assessments also differ for HPA042550 (HPA: antibody validation). | A: Interpret IF/ICC with its own controls and guide. Use this section's membranous squamous pattern for tissue IHC (HPA: tissue IHC profile); do not treat the uncertain IF locations as an IHC protocol or definitive IHC positives. |


Comprehensive Human Protein Atlas IHC scoring per tissue (reliability: Enhanced — Medium consistency between antibody staining and RNA expression data.). Rows are taken directly from the HPA tissue chart — click any row's HPA link to view the source.
| Tissue | Cell type | Level | Evidence | Source |
|---|---|---|---|---|
| Kidney | Collecting ducts | High | Protein (IHC) | HPA → |
| Breast | Glandular cells | Medium | Protein (IHC) | HPA → |
| Bronchus | Respiratory epithelial cells | Medium | Protein (IHC) | HPA → |
| Cervix | Glandular cells | Medium | Protein (IHC) | HPA → |
| Endometrium | Glandular cells | Low | Protein (IHC) | HPA → |
| Tissue | Cell type | Level | Evidence | Source |
|---|---|---|---|---|
| Adipose tissue | Adipocytes | Not detected | Protein (IHC) | HPA → |
| Adrenal gland | Glandular cells | Not detected | Protein (IHC) | HPA → |
| Appendix | Glandular cells | Not detected | Protein (IHC) | HPA → |
| Bone marrow | Hematopoietic cells | Not detected | Protein (IHC) | HPA → |
| Caudate | Glial cells | Not detected | Protein (IHC) | HPA → |
These PPL troubleshooting answers focus on chromogenic IHC in paraffin sections, with one entry for exploratory IF comparison.
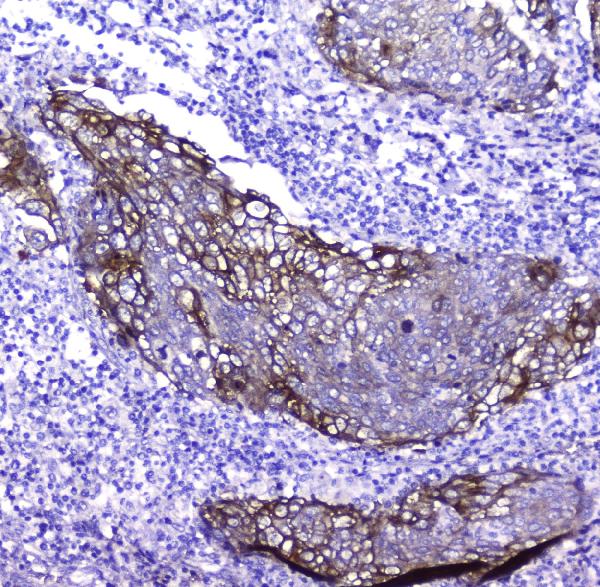
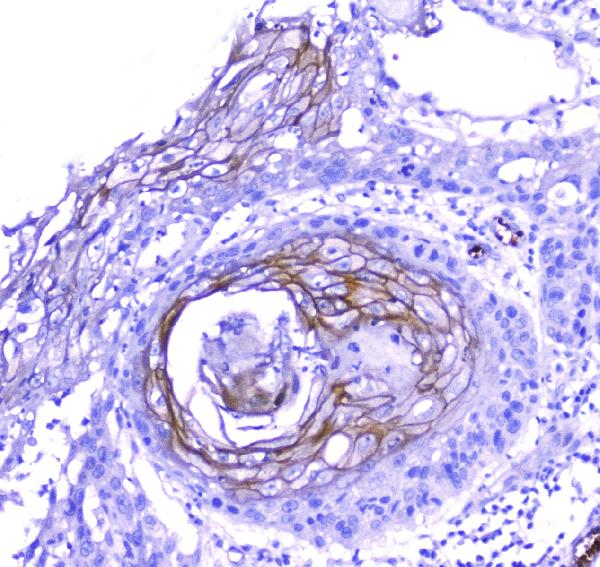
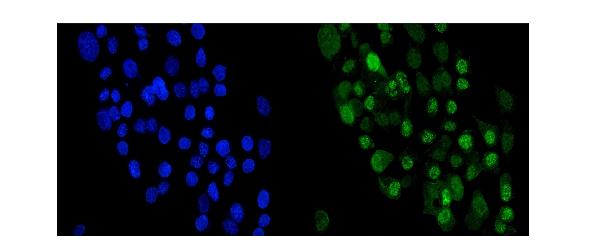
A02098-1 has IHC images from human paraffin sections and IF data from A431 cells; its listed reactivity includes human, mouse and rat (catalog applications/reactivity; A02098-1 image captions).
A02098-1 will render with its own IHC figure from a human lung cancer paraffin section (A02098-1 IHC figure caption). Additional IHC captions show human oesophagus squama cancer and tonsil sections, while its IF caption shows A431 cells (A02098-1 image captions).
Which to pick: Choose A02098-1 for paraffin-section IHC: its figure documents EDTA retrieval at pH 8.0 and primary antibody at 2 μg/ml (A02098-1 IHC figure caption). The same SKU is listed for IF/ICC, with IF shown in A431 cells at 5 μg/ml (catalog applications; A02098-1 IF caption). For cross-species work, A02098-1 lists human, mouse and rat reactivity, but the supplied IHC captions document only human sections; the IHC fixative is unreported (catalog reactivity; A02098-1 IHC captions).