RIT1 / GTP-binding protein Rit1 · IHC design guide

Design Immunohistochemistry for RIT1

Plan RIT1 IHC in paraffin sections using high staining in Purkinje cells and kidney tubules as tissue references (HPA tissue IHC). The guide covers fixation consistency, staining interpretation and the catalog antibody's IHC dilution (datasheet A06008-1).

Evidence assembled Oct 2026 · For research use; verify linked source records and product datasheet before use
Immunohistochemistry protocol sheet for RIT1 (IHC for RIT1): expected localisation Cytoplasmic staining (HPA tissue IHC); membrane location annotated (UniProt), antibody A06008-1, validated IHC image, and IHC protocol steps
Printable RIT1 IHC protocol sheet — expected localisation Cytoplasmic staining (HPA tissue IHC); membrane location annotated (UniProt), antibody A06008-1, controls and protocol steps. Open the full RIT1 IHC guide →

RIT1 Immunohistochemistry Experimental Design Guide

Expected localisation, validated protocols, controls and antibodies — the at-a-glance facts below, then the full design guide.

Must know before staining
Expected localisation Cytoplasmic staining (HPA tissue IHC); membrane location annotated (UniProt)
Staining pattern Purkinje and kidney tubular cells show cytoplasmic staining (HPA tissue IHC)
Antigen retrieval Tris-EDTA pH 9.0 HIER, heat-mediated (datasheet A06008-1)
Positive control ⓘ Cerebellum+4 more · see all
Negative control ⓘ Adipose tissue+4 more · see all
Important caveats
Reasons your staining may differ from the expected pattern.
Fixation Keep fixation consistent across sections (standard IHC practice; not target-specific); Matched tissue-IHC evidence does not establish the fixation claim. Validate the specimen-specific method before use. (selected-SKU IHC image A06008-1)
Caveat Tissue staining awaits external verification (HPA tissue IHC)
Regulation Expression regulation is unreported (UniProt)
Isoform / epitope 3 isoforms; check antibody epitope coverage across variants (UniProt)
Section 1

Recommended RIT1 IHC & IF Protocols

The catalog antibody uses heat retrieval with Tris-EDTA at pH 9.0 (datasheet A06008-1). One published ESCC tissue-array protocol provides RIT1 staining conditions (PMC6197279).

Recommended immunohistochemistry (IHC-P) protocol parameters
SampleParaffin-embedded human Squamous cell carcinoma of lung tissue; fixative not specified (datasheet A06008-1)
FixationImage fixative and duration unreported (datasheet A06008-1); verify before use.
Sectioning4–5 µm sections on charged slides (standard)
DeparaffinisationXylene, graded ethanol series to water (standard)
Antigen retrievalHeat retrieval: Tris-EDTA pH 9.0 (datasheet A06008-1); 20 min, 95–100 °C (standard)
Peroxidase block3% H2O2, 10 min, room temperature (standard)
Blocking10% normal serum of the secondary host, 30 min, room temperature (standard)
Primary antibodyRabbit anti-RIT1, 1:50 recommended; image 1:200 (datasheet A06008-1)
Primary incubationOvernight at 4 °C (standard)
DetectionHRP-polymer secondary, DAB chromogen 5–10 min (standard)
CounterstainHematoxylin, blue, dehydrate and mount (standard)
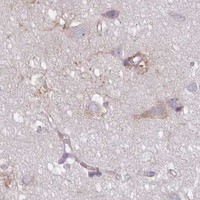
Expected resultRIT1-positive staining in purkinje cells of cerebellum (HPA tissue IHC: High). HPA tissue profile: Cytoplasmic expression in several tissues. No signal in the no-primary control.
💡Decision noteStart with Tris-EDTA pH 9.0 heat retrieval for the catalog antibody (datasheet A06008-1); the published protocol does not specify retrieval (PMC6197279).
Section 2

What Is the Expected RIT1 Staining Pattern?

RIT1 is annotated at the cell membrane without a transmembrane segment (UniProt Q92963 topology), while tissue IHC shows cytoplasmic staining in several tissues (HPA: tissue IHC). Expect staining in the reported cell populations, including Purkinje cells, kidney tubular cells and several glandular populations (HPA: High). The tissue IHC assessment is Approved, with external verification pending (HPA: reliability); interpret a new assay in that context.

What am I looking at on my slide?
Cytoplasmic signal in kidney tubular cells, with a discernible boundary between stained cells and surrounding tissue.This fits a reported high staining population (HPA: High in kidney tubular cells) and the tissue level cytoplasmic profile (HPA: tissue IHC). Membrane emphasis can be compatible with the UniProt cell membrane annotation (UniProt Q92963 subcellular location); a purely membranous pattern is not required by the HPA tissue images.
Cytoplasmic staining in Purkinje cells, cholangiocytes, trophoblastic cells or glandular cells of the listed positive tissues.These are reported high staining populations (HPA: High in cerebellum, liver, placenta, duodenum, epididymis, pancreas and small intestine). Judge the identified cell population and compartment together; a positive tissue name alone does not establish that every cell on the section should stain.
Predominantly nuclear staining, with no convincing cytoplasmic or membrane associated signal in an expected positive population.Treat this as a discordant compartment pattern: HPA describes cytoplasmic tissue staining (HPA: tissue IHC), and UniProt annotates the cell membrane (UniProt Q92963 subcellular location). Review morphology and assay controls before assigning the nuclear signal to RIT1 (general IHC practice).
Strong chromogen in a population reported as undetected, or staining that follows tissue edges and unrelated cell types.Adipocytes and lymph node germinal center cells are among HPA's undetected populations (HPA: Not detected); their staining warrants review for cross-reactivity or endogenous detection activity (general IHC practice). An HPA negative designation is an observed pattern, not proof that every preparation must be blank.
Diffuse haze over cells and extracellular areas, or no signal in a section containing a reported high staining population.Haze without cell boundaries is difficult to score as the reported cytoplasmic pattern (HPA: tissue IHC). Absence of signal in, for example, kidney tubular cells conflicts with the HPA high observation (HPA: High); check assay performance before calling the sample RIT1 negative (general IHC practice).
💡Expected RIT1 appearanceCall a section positive when identifiable reported cells show clear cytoplasmic staining, potentially with membrane emphasis and strong signal in HPA high populations (HPA: tissue IHC; UniProt Q92963 subcellular location); nuclear only staining or widespread cell independent chromogen is a suspect result (general IHC practice).
How each factor affects the staining
Compartment interpretationHPA reports cytoplasmic tissue IHC (HPA: tissue IHC), whereas UniProt places RIT1 at the cell membrane and annotates no transmembrane segment (UniProt Q92963 topology); assess both observations without demanding a sharp membrane rim.
Choice of reference cell populationReported high populations include kidney tubular cells and Purkinje cells; adipocytes and lymph node germinal center cells are reported undetected (HPA: tissue IHC). Compare like cell populations when judging whether staining agrees with the reference.
Strength of IHC evidenceThe tissue IHC profile is Approved but pending external verification (HPA: reliability). The listed antibody HPA053249 is IHC Approved, with no Enhanced designation supplied (HPA: antibody validation); agreement with the profile supports interpretation but does not independently establish specificity.
Isoforms and processingUniProt lists three isoforms, a chain spanning residues 1–219, and no signal peptide or propeptide (UniProt Q92963 isoforms and processing). The payload gives no antibody epitope or isoform recognition data, so these annotations cannot predict which isoforms an IHC signal detects.
Why is my staining missing, weak or wrong?
SituationLikely causeNext action
No staining in kidney tubular cells or another HPA high population.The observed result differs from the reported high population (HPA: tissue IHC); the cause cannot be assigned from that observation alone.Check section identity, primary antibody use, detection reagents and a known positive control (general IHC practice). Optimize retrieval and antibody concentration only against the assay's validated instructions; no RIT1 specific retrieval condition is supplied.
Brown signal is widespread, including blank areas or cells without clear boundaries.Diffuse background can arise from nonspecific antibody binding or endogenous detection activity (general IHC practice); it does not match HPA's cell associated cytoplasmic profile (HPA: tissue IHC).Inspect a no primary control, review blocking and washing, and verify chromogen timing (general IHC practice). Score RIT1 only where identifiable cells show a reproducible compartment pattern.
The main staining appears nuclear.A nuclear dominant pattern conflicts with the supplied tissue IHC profile and UniProt location (HPA: cytoplasmic; UniProt Q92963: cell membrane).Check counterstain and chromogen separation, then compare a known positive section and no primary control (general IHC practice). Do not use nuclear signal alone as the expected RIT1 result.
Adipocytes or germinal center cells stain as strongly as the selected positive population.Those populations are reported undetected (HPA: tissue IHC); unexpected signal may reflect cross-reactivity or endogenous detection activity (general IHC practice).Confirm cell identity and inspect the no primary control (general IHC practice). Reassess antibody concentration and detection background before treating the unexpected population as biological RIT1 staining.
A reported positive tissue contains both stained and unstained cells.HPA assigns levels to specified populations, such as liver cholangiocytes, rather than every cell in the tissue (HPA: High in cholangiocytes).Identify the relevant cell type on the section and score it separately from neighboring cells (general IHC practice). Record the observed compartment and intensity for that population.
Can IF/ICC be used to confirm the IHC compartment pattern?The HPA subcellular entry has no main location and lists no ICC/IF image lines (HPA: subcellular); the antibody entry supplies IHC Approved status but no ICC status (HPA: antibody validation).Treat IF/ICC localization as unconfirmed by these payloads; consult the separate IF/ICC guide for its assay design. Use the reported tissue IHC pattern for this paraffin section interpretation (HPA: tissue IHC).

Sample controls for RIT1 IHC & IF

🧪Run kidney first: tubular cells should stain (HPA: High in kidney cells in tubules). Use adipose tissue as the negative specimen: adipocytes are not detected (HPA: Not detected in adipocytes). On the kidney slide, assess background in neighboring cells without assuming they are RIT1-negative.
Positive control tissue: Cerebellum (Purkinje cells, HPA High)
Negative control tissue: Adipose tissue (HPA Not detected)
ICC-IF cell lines (HPA subcellular resource): HPA carries no ICC-IF cell line for RIT1; derive a cell-line control from the positive tissue's cell type (Purkinje cells) and confirm it by RNA or western blot first.
Technical controls: Include a no-primary (secondary-only) control, an isotype control matched to the primary antibody’s host species and clonality, and a biological negative such as a verified RIT1 knockout sample or a peptide-block control when the matching immunizing peptide is available (standard IHC practice). For kidney sections, check endogenous biotin background if using avidin–biotin detection (standard IHC practice).
⚠️Feasibility: A target-specific fixation window or fixation effect is unreported, and the selected A06008-1 paraffin-section caption does not state a fixative (selected-SKU caption). That example uses Tris-EDTA retrieval at pH 9.0 and a 1:200 primary dilution overnight at 4°C; it does not establish that retrieval is required (selected-SKU caption). The supplied evidence does not show that frozen sections or IF/ICC are easier, and kidney sections may require an endogenous-biotin check with avidin–biotin detection (HPA subcellular: no ICC-IF images listed; standard IHC practice).

HPA tissue IHC evidence for RIT1

Comprehensive Human Protein Atlas IHC scoring per tissue (reliability: Approved — Pending external verification.). Rows are taken directly from the HPA tissue chart — click any row's HPA link to view the source.

Positive expression · recommended positive controls

TissueCell typeLevelEvidenceSource
Cerebellum Purkinje cells High Protein (IHC) HPA →
Duodenum Glandular cells High Protein (IHC) HPA →
Epididymis Glandular cells High Protein (IHC) HPA →
Kidney Cells in tubules High Protein (IHC) HPA →
Liver Cholangiocytes High Protein (IHC) HPA →

Undetected expression · recommended negative controls

TissueCell typeLevelEvidenceSource
Adipose tissue Adipocytes Not detected Protein (IHC) HPA →
Caudate Glial cells Not detected Protein (IHC) HPA →
Lymph node Germinal center cells Not detected Protein (IHC) HPA →
Oral mucosa Squamous epithelial cells Not detected Protein (IHC) HPA →
Soft tissue Peripheral nerve Not detected Protein (IHC) HPA →
Section 3

Advanced RIT1 IHC Tips

Troubleshoot RIT1 chromogenic IHC in paraffin sections by checking retrieval, staining compartment, tissue controls and scoring before interpreting signal.

Which retrieval condition should I use first for RIT1 paraffin-section IHC?
Use heat-mediated Tris-EDTA at pH 9.0 for RIT1 staining in paraffin sections (datasheet A06008-1). The catalog image used this retrieval with primary antibody at 1:200 overnight at 4°C (datasheet A06008-1). If staining is weak, compare a shorter and longer heating interval on adjacent sections while holding antibody dilution and detection constant (standard IHC practice). Check whether the expected cells gain signal without increased staining in a matched negative control (standard IHC practice). A different buffer or pH is a fallback experiment; record it separately from the documented catalog condition (datasheet A06008-1; standard IHC practice).
How should I troubleshoot weak RIT1 staining when fixation history is uncertain?
The RIT1 product caption identifies paraffin-embedded tissue but does not report its fixative, so target-specific fixation sensitivity is unknown (datasheet A06008-1). Record the fixative, fixation duration and processing history for each specimen before comparing staining intensity across cases (standard IHC practice). Run a consistently processed positive control alongside uncertain specimens and begin with Tris-EDTA at pH 9.0 (datasheet A06008-1; standard IHC practice). If fixation histories differ, compare staining within similarly processed groups and treat between-group intensity differences cautiously (standard IHC practice). Neither the reported tissue staining nor RIT1 topology establishes a preferred fixative or a RIT1-specific fixation effect (HPA tissue IHC; UniProt Q92963 topology).
Should I expect membrane or cytoplasmic RIT1 staining in chromogenic IHC?
Assess membrane-associated staining because RIT1 is assigned to the cell membrane despite having no transmembrane segment (UniProt Q92963 localisation and topology). Also examine cytoplasmic signal: the tissue IHC profile reports cytoplasmic expression in several tissues (HPA tissue IHC). Compare both patterns against matched controls rather than rejecting a section solely because its signal is predominantly cytoplasmic (UniProt Q92963 localisation; HPA tissue IHC; standard IHC practice). Score the membrane rim and cytoplasm separately when the distinction is reproducible across cells and sections (standard IHC practice). Diffuse staining that follows folds or section edges needs technical review before either compartment is called positive (standard IHC practice).
Could isoforms or epitope accessibility explain inconsistent RIT1 staining?
RIT1 has 3 annotated isoforms, so establish which sequence the catalog antibody recognizes before interpreting an apparently negative specimen (UniProt Q92963 isoforms; standard IHC practice). No epitope position is supplied here; do not assume that this antibody detects every isoform or that its epitope faces the cytoplasm (supplied antibody record). RIT1 has no annotated transmembrane segment, glycosylation sites or modified residues, but those annotations do not establish accessibility after paraffin processing (UniProt Q92963 topology and PTMs; standard IHC practice). Compare serial sections under the documented Tris-EDTA pH 9.0 condition and a matched negative control (datasheet A06008-1; standard IHC practice). Seek epitope mapping or an independently validated antibody before assigning an isoform-specific staining difference (standard IHC practice).
How can IF help investigate an ambiguous RIT1 IHC pattern?
Use IF on a separately controlled section to ask whether RIT1 signal overlaps a marker for the expected cell type, such as cholangiocytes in liver (HPA: High in cholangiocytes; standard IF practice). Choose spectrally separated fluorophores and inspect an unstained section for tissue autofluorescence before interpreting apparent overlap (standard IF practice). If the antibody epitope is cytoplasmic-facing, test gentle permeabilisation; if its side is unknown, compare permeabilised and unpermeabilised conditions without assuming accessibility (UniProt Q92963 topology; supplied antibody record; standard IF practice). The catalog evidence here documents paraffin-section chromogenic IHC, while HPA lists no ICC/IF images for RIT1 (datasheet A06008-1; HPA subcellular). Keep any IF finding separate from the IHC score until its controls support the pattern (standard IF/IHC practice).
What should I change when RIT1 DAB staining is widespread or patchy?
First compare a no-primary control with the stained section to locate background from detection reagents or endogenous tissue activity (standard chromogenic IHC practice). Apply an appropriate peroxidase block before horseradish-peroxidase detection, then check whether DAB still appears in the no-primary control (standard chromogenic IHC practice). The documented starting condition is primary antibody 1:200 overnight at 4°C and secondary antibody 1:200 for 45 minutes at room temperature (datasheet A06008-1). If background persists, compare stronger blocking, more thorough washes and a primary dilution series on adjacent sections (standard IHC practice). Reject precipitate, drying artefact and edge staining when judging a cellular RIT1 pattern (standard IHC practice).
How should I score RIT1 IHC across specimens with different cellular composition? ⚠ ANSWER MARKED FOR VERIFICATION
Define the cell population and compartment before scoring, because reported RIT1 tissue staining is cytoplasmic while UniProt assigns RIT1 to the cell membrane (HPA tissue IHC; UniProt Q92963 localisation). For a graded stain, calculate an H-score from the percentages of cells at intensity 0–3, or report the percentage positive at a prespecified threshold (standard IHC practice). If cells are sparse, report positive-cell density per mm² of evaluable tissue (standard IHC practice). Normalise each result to the number or area of eligible cells, excluding necrosis, folds and blank tissue (standard IHC practice). Use the same retrieval, detection, counterstain and scoring rules across specimens, with matched controls in each run (datasheet A06008-1; standard IHC practice).
How can I distinguish true RIT1 positivity from staining artefact?
Look for reproducible cellular signal in an expected population, such as kidney tubular cells, rather than staining confined to edges or necrotic regions (HPA: High in kidney tubular cells; standard IHC practice). Consider both membrane-associated and cytoplasmic patterns, since those locations are reported by different sources (UniProt Q92963 localisation; HPA tissue IHC). A nuclear-only pattern requires additional validation before it is assigned to RIT1 (UniProt Q92963 localisation; HPA tissue IHC; standard IHC practice). Check the no-primary control for endogenous enzyme activity or detection background, especially when DAB appears outside intact cells (standard chromogenic IHC practice). Interpret a positive result alongside the catalog condition and the tissue control, recognizing that HPA labels its tissue IHC profile Approved with external verification pending (datasheet A06008-1; HPA tissue IHC).
Boster reagents

Best RIT1 / GTP-binding protein Rit1 IHC Antibodies

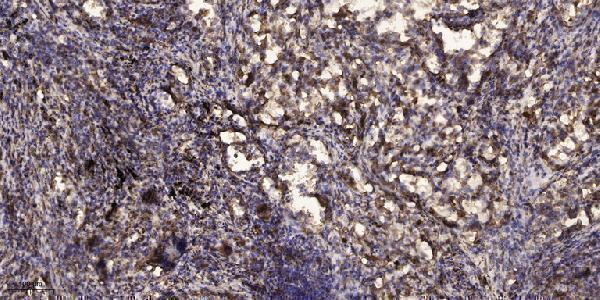
A06008-1 has an IHC image from paraffin-embedded human lung squamous cell carcinoma (catalog image caption). The catalog lists human and mouse reactivity (catalog: A06008-1).

Real IHC data Immunohistochemical analysis of paraffin-embedded human Squamous cell carcinoma of lung. 1, Antibody was diluted at 1:200 (4° overnight). 2, Tris-EDTA, pH9.0 was used for antigen retrieval. 3, Secondary antibody was diluted at 1:200 (room temperature, 45min).
Anti-GTP-binding protein Rit1 Rit1 Antibody
Cat # A06008-1

A06008-1 will render with its own IHC image of paraffin-embedded human lung squamous cell carcinoma (A06008-1 image caption). Its listed applications are ELISA, IHC and WB, with human and mouse reactivity; no IF image is provided (catalog: A06008-1).

Which to pick: Choose A06008-1 for paraffin-section tissue IHC: its image documents Tris-EDTA retrieval at pH 9.0 and primary antibody at 1:200 overnight at 4°C; the fixative is unreported (A06008-1 image caption). No SKU is listed for IF/ICC (catalog: A06008-1 applications). For cross-species work, A06008-1 is a rabbit polyclonal antibody listed as reactive with human and mouse, although its IHC image shows human tissue only (catalog: A06008-1 host, clonality and reactivity; A06008-1 image caption).

Each figure is that product's own IHC / IF validation image from its datasheet.

References

  1. UniProt Consortium. UniProt entry Q92963 (RIT1_HUMAN, GTP-binding protein Rit1).
  2. Human Protein Atlas. RIT1 tissue IHC expression (reliability: Approved).
  3. Human Protein Atlas. RIT1 subcellular location (ICC-IF): Highest expression in SuSa: 66.3 nTPM.
  4. Human Protein Atlas. RIT1 antibody validation summary (1 antibodies).
  5. RIT1 suppresses esophageal squamous cell carcinoma growth and metastasis and predicts good prognosis. Cell death & disease 2018 — PMC6197279.
  6. RIT1 Promotes the Proliferation of Gliomas Through the Regulation of the PI3K/AKT/c-Myc Signalling Pathway. Journal of cellular and molecular medicine 2025 — PMC11745823.
  7. Mutant RIT1 cooperates with YAP to drive an EMT-like lung cancer state. Cell reports 2025 — PMC12646131.
  8. RIT1 regulates mitosis and promotes proliferation by interacting with SMC3 and PDS5 in hepatocellular carcinoma. Journal of experimental & clinical cancer research : CR 2023 — PMC10685607.
  9. PubMed PMID:8824319 — UniProt-cited evidence.
  10. PubMed PMID:8918462 — UniProt-cited evidence.
  11. PubMed PMID:10545207 — UniProt-cited evidence.