STAR · Western blot design guide

STAR Western Blot Planning Guide

Plan a STAR Western blot around the catalog-observed 123.4 kDa band, image-backed A00051-1 evidence, HPA controls, and verified protocol records.
Evidence assembled July 2026 · For research use; verify linked source records and product datasheet before use
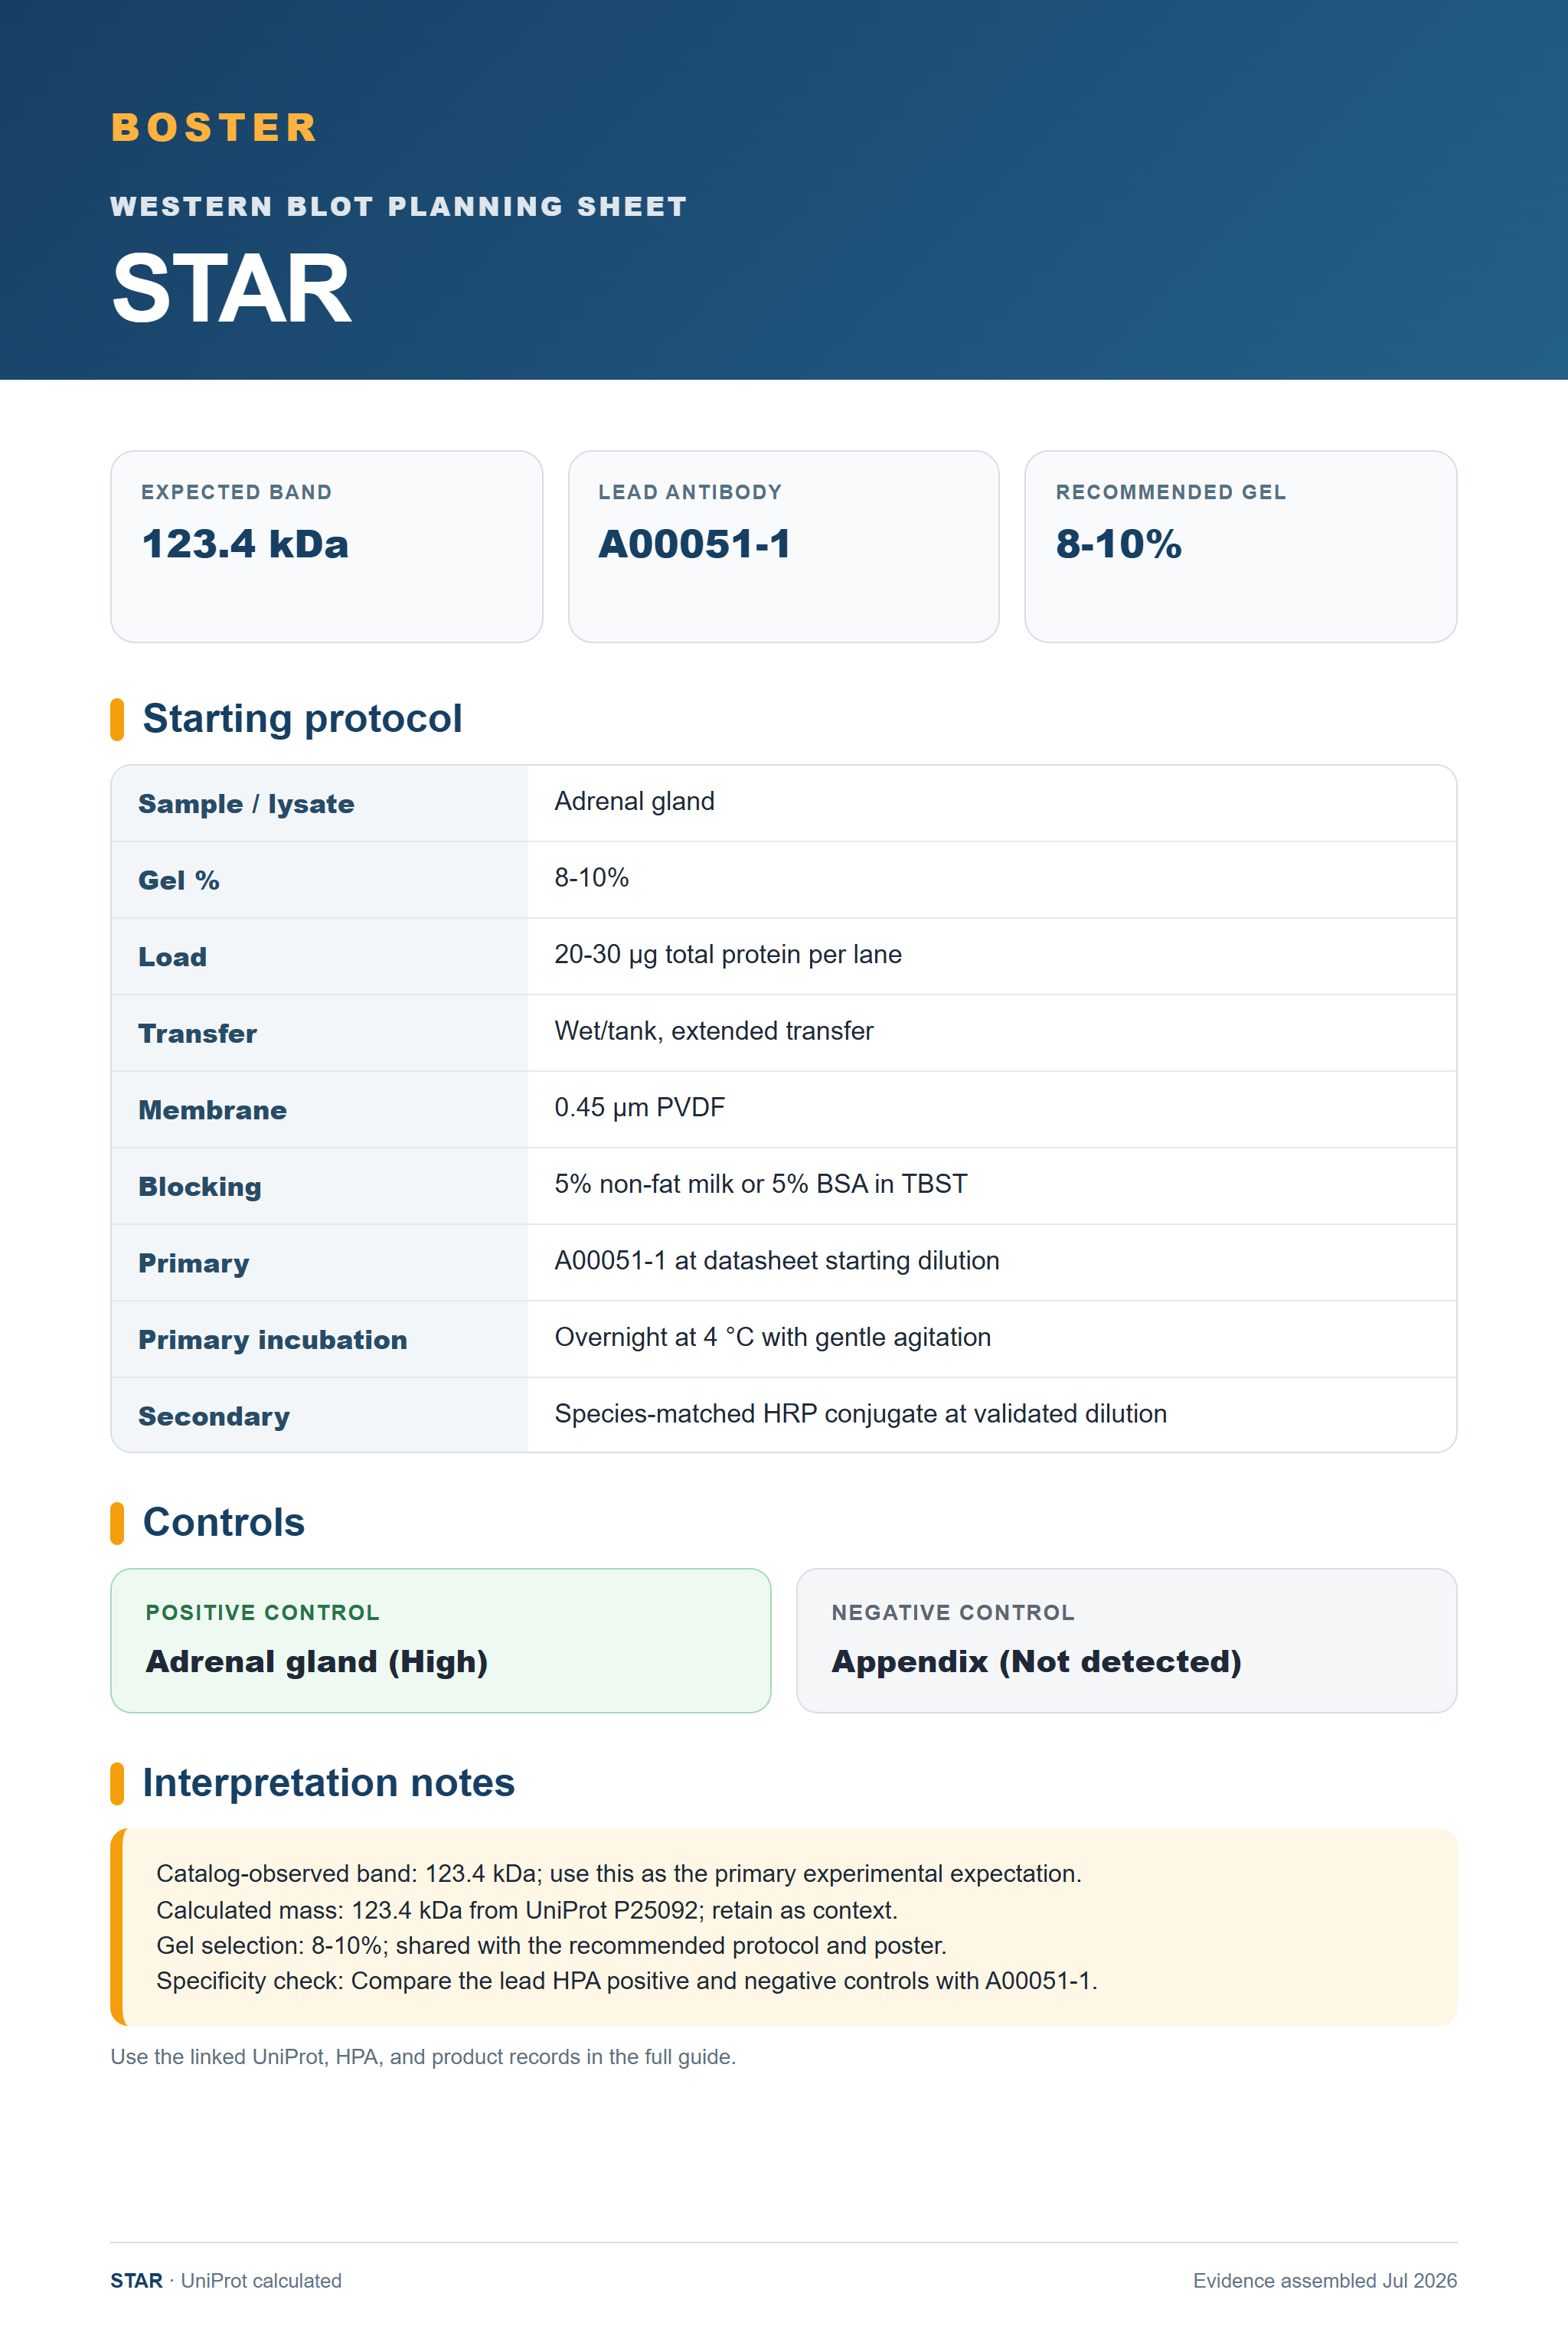
Western blot protocol sheet for STAR (STAR): expected band 123.4 kDa, antibody A00051-1, and guide-derived SDS-PAGE protocol steps
STAR Western blot protocol sheet — expected band 123.4 kDa, antibody A00051-1, controls and PMC citations. Open the full STAR WB guide →

STAR Western Blot Experimental Design Guide

Expected bands, documented protocol parameters, controls and antibodies — the at-a-glance facts below, then the full design guide.

Must know before running
Expected band 123.4 kDa
Observed band Not reported — verify product WB image
Gel 8-10%
Positive control ⓘ Adrenal gland
Negative control ⓘ Appendix
Important caveats
Reasons your observed band may differ from the expected size.
ⓘ Calculated mass 123.4 kDa
ⓘ Localization Cell membrane / Endoplasmic reticulum membrane
ⓘ Processing / PTM Record-dependent
ⓘ Reactivity Human / Mouse / Rat
Section 1

Real Curated STAR Western Blot Protocols

Start with the molecular-weight rule, then compare verified publication-derived conditions.

Recommended Western blot protocol parameters
Sample / lysateAdrenal gland
Gel %8-10%
Load20-30 µg total protein per lane
TransferWet/tank, extended transfer
Membrane0.45 µm PVDF
Blocking5% non-fat milk or 5% BSA in TBST
PrimaryA00051-1 at datasheet starting dilution
Primary incubationOvernight at 4 °C with gentle agitation
SecondarySpecies-matched HRP conjugate at validated dilution
Wash3 × 5 min in TBST
DetectionChemiluminescent substrate
ExposureBracket exposures to avoid saturation
Section 2

What Is the Expected STAR Western Blot Band Size?

Use the product-observed 123.4 kDa band as the primary planning value and retain the UniProt calculated mass as context.

What am I looking at on my blot?
123.4 kDaMatches the authoritative product WB observation.
123.4 kDa calculatedUse as UniProt context, not as a replacement observed band.
Unexpected additional signalDo not assign identity without orthogonal positive/negative controls.
💡Expected STAR appearancePlan around 123.4 kDa and keep the calculated mass as supporting context.
How each factor affects band size
Catalog-observed band123.4 kDa; use this as the primary experimental expectation.
Calculated mass123.4 kDa from UniProt P25092; retain as context.
Gel selection8-10%; shared with the recommended protocol and poster.
Specificity checkCompare the lead HPA positive and negative controls with A00051-1.
Why is my band missing or off?
SituationLikely causeNext action
123.4 kDaMatches the authoritative product WB observation.Confirm with orthogonal controls and the linked product record.
Additional bandMay reflect processing, modification, or non-specific signal.Run a dilution series and compare positive/negative controls.
Weak signalTarget abundance or transfer may be limiting.Verify transfer, increase positive-control abundance, and bracket exposure.

Sample controls for STAR Western blot

🧪Use Adrenal gland as the first positive-control candidate and Appendix as the HPA Not detected negative candidate.
Positive control: Adrenal gland (High)
Negative control: Appendix (Not detected)
HPA protein score determines control status; other expression data is supporting context only.

HPA tissue expression evidence for STAR

Comprehensive Human Protein Atlas IHC scoring per tissue. Rows are taken directly from the HPA tissue chart — click any row's HPA link to view the source.

Positive expression · recommended positive controls

TissueCell typeLevelEvidenceSource
Adrenal gland Reported tissue cells High Protein (HPA) HPA →
Testis Reported tissue cells High Protein (HPA) HPA →

Undetected expression · recommended negative controls

TissueCell typeLevelEvidenceSource
Appendix Reported tissue cells Not detected Protein (HPA) HPA →
Bone marrow Reported tissue cells Not detected Protein (HPA) HPA →
Section 3

Advanced STAR Western Blot Tips

Deeper troubleshooting and optimisation questions for STAR, answered from its protein features.

Which band should guide the blot?
Use 123.4 kDa, the observation attached to the authoritative A00051-1 WB record.
How should calculated mass be interpreted?
Treat the UniProt calculated mass as context; it does not replace the catalog-observed 123.4 kDa expectation.
Which positive control should I start with?
Start with Adrenal gland, the lead HPA protein-expression candidate.
Which negative control is defensible?
Use Appendix as an orthogonal HPA Not detected candidate.
Which gel should I use?
Use 8-10% consistently across the quick facts, protocol table, and poster.
What transfer method to use for STAR Western blot?
Use the transfer method in the recommended protocol and verify transfer before blocking.
How should A00051-1 be started?
Start at the linked datasheet condition and run a three-point primary-antibody dilution test.
Which publication-derived protocols can I compare?
No verified publication protocol was supplied; use only the deterministic recommended protocol.
Boster reagents

STAR Western Blot Reagents

Human/Mouse/Rat-reactive STAR Western blot reagents with authoritative product imagery.

Real WB data Western blot validation image for STAR using A00051-1; observed band 123.4 kDa
Anti-StAR Antibody Picoband®
Cat # A00051-1

Only image-backed, WB-validated Human/Mouse/Rat recommendations from the prepared catalog evidence are shown.

Source: prepared picoband-wb product evidence; each card retains its own SKU, URL, observed band, and authoritative WB image.

References

  1. UniProt P25092
  2. Human Protein Atlas — STAR
  3. A00051-1 product record
  4. PMC7922663 — Role of Constitutive STAR in Leydig Cells (International journal of molecular sciences, 2021)
  5. PMC11545013 — Elevated RBP4 in Subclinical Ketosis Cows Inhibits Follicular Granulosa Cell Proliferation and Steroid Hormone Synthesis (Animals : an open access journal from MDPI, 2024)
  6. PMC6787510 — Cyclophilin D participates in the inhibitory effect of high-fat diet on the expression of steroidogenic acute regulatory protein (Journal of cellular and molecular medicine, 2019)

