This website uses cookies to ensure you get the best experience on our website.


- Table of Contents
Plan paraffin-section TMBIM1 IHC using an IHC-validated antibody and cytoplasmic tissue staining as the starting pattern (HPA tissue IHC). This guide covers fixation consistency, chromogenic detection, and interpretation in light of its lysosome and endosome membrane annotation (UniProt).

Expected localisation, validated protocols, controls and antibodies — the at-a-glance facts below, then the full design guide.
| Expected localisation | Cytoplasmic tissue staining (HPA tissue IHC); lysosome and endosome membranes (UniProt) | |
| Staining pattern | Cytoplasmic staining in most tissues (HPA tissue IHC) | |
| Antigen retrieval | EDTA pH 8.0 HIER, heat-mediated (datasheet A10501-3) | |
| Positive control | Appendix+4 more · see all | |
| Negative control | None in HPA (detected in all 45 tissues); use no-primary + isotype controls |
| Fixation | Keep fixation consistent across sections (standard IHC practice; not target-specific) | |
| Caveat | Antibody staining and RNA show low consistency (HPA tissue IHC) | |
| Regulation | Expression regulation is not annotated (UniProt) | |
| Isoform / epitope | No isoforms or cleavage annotated; epitope side may affect access (UniProt) |
Compare the catalog antibody’s IHC-P protocol (datasheet A10501-3) with 4 published TMBIM1 IHC protocols (PMC12702014; PMC12842013; PMC8920937; PMC12923484).
| Sample | Paraffin-embedded human gastric cancer tissue; fixative not specified (datasheet A10501-3) |
| Fixation | Image fixative and duration unreported (datasheet A10501-3); verify before use. |
| Sectioning | 4–5 µm sections on charged slides (standard) |
| Deparaffinisation | Xylene, graded ethanol series to water (standard) |
| Antigen retrieval | Heat retrieval: EDTA pH 8.0 (datasheet A10501-3); 20 min, 95–100 °C (standard) |
| Peroxidase block | 3% H2O2, 10 min, room temperature (standard) |
| Blocking | 10% goat serum (datasheet A10501-3) |
| Primary antibody | Rabbit anti-TMBIM1, 2μg/ml (datasheet A10501-3) |
| Primary incubation | Overnight at 4 °C (datasheet A10501-3) |
| Detection | Streptavidin-biotin complex (SABC), DAB chromogen (datasheet A10501-3) |
| Counterstain | Hematoxylin, blue, dehydrate and mount (standard) |
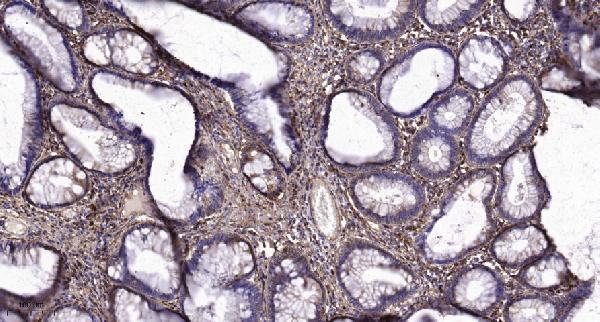
| Expected result | TMBIM1-positive staining in lymphoid tissue of appendix (HPA tissue IHC: High). HPA tissue profile: Cytoplasmic expression in most tissues. No signal in the no-primary control. |
TMBIM1 is a seven-pass membrane protein associated with lysosome and endosome membranes (UniProt Q969X1 topology and subcellular annotation). In paraffin-section IHC, expect predominantly cytoplasmic staining across many tissues, including lymphoid, hematopoietic, glandular, neuronal and squamous epithelial cells (HPA tissue IHC). HPA rates the tissue IHC result Approved, while reporting low consistency between staining and RNA data and pending external verification (HPA tissue IHC).
| Cytoplasmic staining is visible in breast, colon, duodenum or gallbladder glandular cells. | These cell types have reported High staining (HPA tissue IHC). Assess the signal within the identified cells and against controls; intensity alone cannot establish antibody specificity, particularly given HPA's low staining–RNA consistency (HPA tissue IHC). |
| Discrete cytoplasmic puncta appear, with nuclei largely free of signal. | A vesicular pattern is consistent with supported ICC-IF localization (HPA subcellular), and with endosome and lysosome membrane annotation (UniProt Q969X1). Chromogenic IHC may not resolve individual vesicles; broadly cytoplasmic staining also matches the reported tissue profile (HPA tissue IHC). |
| Strong staining is confined to nuclei or appears as an unrelated tissue-wide deposit. | That compartment does not match the reported membrane and vesicle localization (UniProt Q969X1; HPA subcellular). Treat it as suspicious, then inspect counterstain, morphology and controls before assigning it to nonspecific staining (general IHC practice). |
| A cell population stains intensely where HPA reports Low staining, such as smooth muscle cells or ovarian stroma cells. | The contrast merits checking cell identification, section quality and controls (HPA tissue IHC; general IHC practice). Low means some staining may occur: this observation alone cannot prove cross-reactivity, and HPA supplies no negative cell population here (HPA tissue IHC). |
| No signal is seen in a section containing an expected High-staining population. | First confirm that the relevant cells are present: appendix lymphoid tissue and bone marrow hematopoietic cells are reported High (HPA tissue IHC). If the run controls also fail, investigate the IHC workflow before interpreting the section as biologically negative (general IHC practice). |
| Tissue and cell population | HPA reports cytoplasmic expression in most tissues and low RNA tissue specificity, but staining varies by cell population: several glandular populations are High, while smooth muscle and ovarian stroma cells are Low (HPA tissue IHC). Compare like cells when judging intensity. |
| Intracellular compartment | Seven transmembrane segments support a membrane-associated target (UniProt Q969X1 topology). Endosome and lysosome membranes are annotated (UniProt Q969X1); HPA supports vesicular ICC-IF localization (HPA subcellular). Neither source establishes that every paraffin-section positive cell will show resolvable puncta. |
| Strength of tissue evidence | The tissue IHC profile is Approved, with low consistency between antibody staining and RNA expression data and external verification pending (HPA tissue IHC). An IHC antibody is listed as Approved; a separate ICC antibody is Supported (HPA antibodies). Keep those application assessments distinct. |
| IF/ICC Q: What pattern is supported? | A: Vesicles are the supported main location in ICC-IF images from HaCaT, RT-4 and U2OS (HPA subcellular). Use that as a localization comparison, while interpreting paraffin-section chromogen against the separate tissue IHC profile (HPA tissue IHC). |
| Epitope and retrieval | The supplied UniProt record gives topology but no antibody epitope (UniProt Q969X1 topology). It therefore cannot predict whether a particular retrieval condition exposes the catalog antibody's epitope. Compare retrieval conditions with the antibody's IHC instructions and run controls (general IHC practice). |
| Fixation sensitivity | Target-specific fixation sensitivity is unreported in the supplied UniProt and HPA evidence. Record fixation and retrieval conditions when comparing sections (general IHC practice), without attributing a change in TMBIM1 signal to fixation from these sources. |
| Situation | Likely cause | Next action |
|---|---|---|
| Expected High-staining cells show no chromogen. | The relevant cell population may be absent from the section, or the IHC run may have failed (HPA tissue IHC; general IHC practice). | Confirm tissue morphology and the expected cell population, then review a same-run positive control and the antibody's IHC instructions before scoring the sample negative (general IHC practice). |
| Signal is weak despite a present positive-control population. | Detection or retrieval conditions may be inadequate for the assay; no TMBIM1-specific retrieval effect is established here (general IHC practice). | Check reagent activity, detection steps and documented retrieval conditions using a same-run control; change one workflow variable at a time (general IHC practice). |
| Strong nuclear staining dominates the section. | Nuclear localization conflicts with the reported membrane and vesicular locations (UniProt Q969X1; HPA subcellular); an assay artifact is possible (general IHC practice). | Inspect morphology and a no-primary control, then repeat with the antibody's validated IHC conditions if the unexpected pattern persists (general IHC practice). |
| Chromogen appears widely outside recognizable cells. | Diffuse deposition can reflect nonspecific background or detection-system activity (general IHC practice); HPA's cytoplasmic tissue profile does not support extracellular deposits as the expected pattern (HPA tissue IHC). | Check a no-primary control, washing and detection blocking steps; judge cellular signal only after background is controlled (general IHC practice). |
| A Low-staining population appears as strong as the expected High-staining cells. | Cell identification or assay background may explain the mismatch (general IHC practice); HPA's Low designation is not a negative call (HPA tissue IHC). | Recheck the cell type and compare matched sections and controls. Report the discrepancy without calling cross-reactivity solely from the HPA intensity category (HPA tissue IHC; general IHC practice). |
| IHC looks cytoplasmic, but puncta are indistinct. | HPA describes the tissue IHC profile as cytoplasmic, while vesicles are supported in ICC-IF (HPA tissue IHC; HPA subcellular); chromogenic section resolution may limit puncta assessment (general IHC practice). | Score the identifiable cells and cytoplasmic distribution against the tissue IHC reference; reserve vesicle-level interpretation for suitably resolved imaging (HPA tissue IHC; general IHC practice). |




Comprehensive Human Protein Atlas IHC scoring per tissue (reliability: Approved — Low consistency between antibody staining and RNA expression data. Pending external verification.). Rows are taken directly from the HPA tissue chart — click any row's HPA link to view the source.
| Tissue | Cell type | Level | Evidence | Source |
|---|---|---|---|---|
| Appendix | Lymphoid tissue | High | Protein (IHC) | HPA → |
| Bone marrow | Hematopoietic cells | High | Protein (IHC) | HPA → |
| Breast | Glandular cells | High | Protein (IHC) | HPA → |
| Cerebral cortex | Neuronal cells | High | Protein (IHC) | HPA → |
| Cervix | Squamous epithelial cells | High | Protein (IHC) | HPA → |
| Tissue | Cell type | Level | Evidence | Source |
|---|---|---|---|---|
| None in HPA: TMBIM1 is detected in all 45 scored tissues. Use a no-primary (secondary-only) and an isotype control instead. | ||||
Troubleshoot TMBIM1 staining in paraffin sections by checking retrieval, compartment, controls, and scoring alongside the documented chromogenic IHC workflow.
Both antibodies have human paraffin-section IHC images (catalog image captions). Both list human, mouse, and rat reactivity; only A10501-1 lists IF (catalog applications/reactivity).
A10501-3 will render with a human gastric cancer paraffin-section IHC image; its catalog also shows human liver cancer and placenta IHC images (A10501-3 image captions). A10501-1 will render with a human colon cancer paraffin-section IHC image and lists IF as an application, with no IF image supplied (A10501-1 image caption; catalog applications/images).
Which to pick: For tissue IHC, choose A10501-3 when its human gastric cancer, liver cancer, or placenta examples match the planned sample: its paraffin-section captions use EDTA retrieval at pH 8.0, and the fixative is unreported (A10501-3 image captions). For IF, choose A10501-1 because IF is listed; ICC is unreported, and its own human colon cancer paraffin-section IHC caption uses Tris-EDTA retrieval at pH 9.0 with the fixative unreported (A10501-1 catalog applications; A10501-1 image caption). For mouse or rat work, either SKU lists reactivity, but the supplied IHC images are human only and clonality is unreported for both (catalog reactivity, image captions, and clone fields).