This website uses cookies to ensure you get the best experience on our website.
- Table of Contents

A comprehensive scientific guide for researchers and biotech professionals on how IHC is used for tumor microenvironment analysis—from single-plex biomarker detection and immune cell profiling in tissue to multiplex spatial biology and clinical applications in oncology.
Immunohistochemistry (IHC) immune profiling is the systematic application of antibody-based detection to quantify, localize, and characterize immune cells and their molecular markers within intact tumor tissue. Unlike bulk transcriptomic or flow cytometry approaches, IHC preserves tissue architecture, allowing researchers to interrogate not just what immune populations are present, but precisely where they reside relative to tumor cells, vasculature, and stromal compartments.
By examining the spatial arrangement of immune cells within a preserved tissue section, researchers gain insights into the functional state of the immune microenvironment that cannot be obtained from dissociated-cell assays alone.
The tumor microenvironment (TME) is a complex, dynamic ecosystem comprising cancer cells, stromal fibroblasts, endothelial cells, and a diverse array of infiltrating immune cells. Tumor microenvironment composition varies substantially across cancer types and even between patients with the same diagnosis. Characterizing the TME at the protein level, its tumor microenvironment immune cells, immune cell spatial organization, and checkpoint ligand expression, is now recognized as essential for understanding tumor microenvironment and cancer progression, as well as predicting and monitoring responses to immunotherapy.
These measurements complement studies of gene expression, helping researchers connect transcriptional activity with protein localization and cellular behavior within the tumor microenvironment.
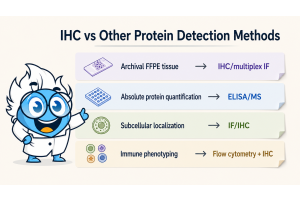
Key Insight: IHC, one of the most established methods for tissue-based biomarker detection, provides simultaneous information on protein identity, cell morphology, and anatomical localization that no other technique fully replicates.
Its ability to support accurate protein detection while preserving morphology makes it an essential component of modern translational oncology workflows.
Retains full tissue architecture; maps immune infiltration zones (intratumoral, invasive margin, stroma).
Detects post-translational modifications and co-expression patterns undetectable by mRNA-based methods.
Works on routinely archived formalin-fixed, paraffin-embedded tissue—enabling retrospective cohort studies.
IHC-based biomarkers (PD-L1, MMR, HER2) are the backbone of companion diagnostic testing worldwide.
The tumor microenvironment at a glance encompasses several functional immune cell subsets with opposing roles: cytotoxic CD8+ T effectors drive anti-tumor immunity, while regulatory T cells (Tregs) and myeloid-derived suppressor cells (MDSCs) dampen immune responses. Tumor microenvironment characteristics such as the CD8+/FOXP3+ ratio, PD-L1 expression density, and macrophage polarization (M1 vs. M2) have emerged as candidate tumor microenvironment markers with prognostic and predictive value, as detailed in high-impact tumor microenvironment review literature including Nature Reviews Cancer.
Interactions between cytotoxic T cells, regulatory immune populations, and tumor cells collectively shape the local cellular immune response and influence therapeutic outcomes.
Effective immune cell profiling in tissue begins with rational marker selection. The tumor microenvironment immune cells of interest span multiple lineages, and each cell type requires validated, specific antibodies with well-characterized staining patterns. Choosing the right tumor microenvironment markers for your IHC panel determines the depth and translational relevance of your profiling data. The following taxonomy of key markers is organized by functional immune compartment.
CD3 and CD8 are commonly used to assess T cell infiltration, while Granzyme B and Perforin provide information on cytotoxic activity.
Ki-67 may be added to evaluate proliferation, and CD56 can help identify NK or NK-like immune populations.
FOXP3 (Tregs)
CD25
IL-10
TGF-beta
FOXP3 and CD25 are often used to evaluate regulatory T cell populations.
IL-10 and TGF-beta may provide additional information on immunosuppressive signaling, but they should be interpreted in the context of staining pattern and tissue localization.
PD-L1, PD-1, CTLA-4, LAG-3, TIM-3, and TIGIT help characterize checkpoint-related immune regulation.
Their interpretation is strongest when combined with immune lineage markers and spatial tissue context.
Panel Design Principle: For comprehensive tumor microenvironment profiling, a minimum panel should include at least one effector marker (CD8), one regulatory marker (FOXP3), one myeloid marker (CD68 or CD163), and one checkpoint ligand (PD-L1). This panel provides a practical starting point for exploratory TME profiling.
Selection of tumor microenvironment markers should be guided by the specific cancer type, the clinical or research question, and antibody validation status. Refer to published tumor microenvironment review sources and the Human Protein Atlas for rigorous antibody characterization data before committing to a panel for translational studies.
Integrating complementary immune profiling technologies
Although IHC remains central to spatial analysis, many investigators combine it with flow cytometry, mass cytometry, and Single-Cell RNA-Seq to obtain a broader understanding of immune cell phenotypes and functional states. These approaches complement IHC by providing additional molecular and cellular information while sacrificing spatial context.
Our scientific team advises on multiplex IHC services, antibody validation, and tumor microenvironment analysis strategies tailored to your cancer model and research objectives.
Explore Our Services
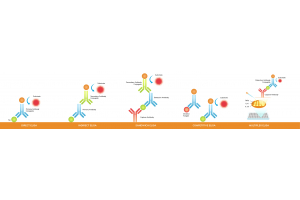
One of the most critical methodological decisions in tumor microenvironment analysis IHC is whether to use conventional single-plex (chromogenic) IHC or to advance to multiplex IHC immune profiling (mIHC) approaches.
Advanced approaches including multiplexed immunohistochemistry, multiplex immunofluorescence, and fluorescent multiplex immunohistochemistry allow simultaneous evaluation of multiple biomarkers within a single tissue specimen.
The choice profoundly impacts the data richness, throughput, and interpretive power of your immune profiling dataset—and ultimately determines whether you capture the full complexity of tumor microenvironment composition.
Visual Placeholder — Microscopy Comparison Panel
Single-plex DAB IHC (left) vs. multiplex fluorescence IHC (right): 7-color co-staining of CD8, FOXP3, PD-L1, CD68, pan-cytokeratin, and DAPI on identical NSCLC tissue section.
| Parameter | Single-Plex IHC | Multiplex IHC / mIF |
|---|---|---|
| Markers per section | 1 (chromogenic) or 2 (dual IHC) | 4–10+ simultaneously |
| Tissue requirement | Multiple consecutive sections needed | Single section; conserves scarce tissue |
| Cellular co-expression | Not determinable from one section | Direct single-cell co-expression analysis |
| Spatial relationships | Limited; registration artifacts possible | Precise spatial proximity analysis (micron-level) |
| Data output | Qualitative / semi-quantitative H-score | Quantitative phenotypic density maps |
| Infrastructure | Standard brightfield microscope | Fluorescence scanner; image analysis software |
| Cost per sample | Lower | Higher; offset by data richness |
| Regulatory acceptance | Well established (PD-L1 CDx) | Emerging; research-grade standard maturing |
| Best use case | Targeted biomarker confirmation, companion diagnostics, clinical pathology | TME phenotyping, spatial biology, immuno-oncology discovery |
Depending on the platform, multiplex workflows may rely on fluorescent multiplexing strategies or chromogenic multiplexed immunohistochemistry methods to distinguish individual biomarkers while maintaining tissue architecture.
Many multiplex platforms use a spectral scanner and reference spectral library to accurately separate overlapping fluorophore signals during image acquisition and analysis.
"Multiplex IHC enables the simultaneous detection of functionally distinct immune populations and their spatial organization within a single tissue section, revealing microenvironmental interactions that are more difficult to resolve with single-marker approaches."
Adapted from Hofman P. et al., Cancers 2019; and Taube JM et al., spatial predictors of immunotherapy response in triple-negative breast cancer studies.
For most translational immuno-oncology research workflows, the recommended strategy is a two-tier approach: use optimized single-plex IHC for initial biomarker screening and validation across large cohorts, then apply targeted multiplex IHC panels to specimens of highest biological interest for detailed spatial interrogation of the tumor microenvironment immune cells.
The spatial predictors of immunotherapy response in triple-negative breast cancer and other solid tumors have underscored a fundamental biological truth: location matters. Whether a CD8+ T cell is located within the tumor nest (intratumoral), at the invasive margin, or excluded to the surrounding stroma carries dramatically different biological and prognostic implications. Evaluating these distinct tumor regions provides critical information about immune accessibility and local immune suppression. IHC-based spatial analysis is the primary method for resolving these architecturally defined immune compartments.
TME Spatial Compartment Model — IHC-Based Zonal Analysis
TUMOR CORE (CT)
INVASIVE MARGIN (IM)
STROMA (S)
CD8+ cytotoxic T cells
FOXP3+ regulatory T cells
CD68+ macrophages
Stromal boundary (IHC-mapped)
Invasive margin zone
Tumor core (pan-CK+)
When IHC reveals CD8+ T cells predominantly in the stroma but excluded from the tumor nest, this "immune-excluded" phenotype is associated with resistance to PD-1/PD-L1 blockade. These tumors may respond to combination strategies that disrupt stromal barriers or enhance T cell trafficking. Such approaches are often investigated alongside immune checkpoint inhibitors to improve infiltration and anti-tumor activity.
Intratumoral CD8+ T cell density—measured by IHC or digital pathology scoring—is one of the strongest spatial predictors of response to checkpoint inhibitors. High intratumoral CD8 density combined with PD-L1 expression defines the classical "hot" tumor immune phenotype. These inflamed tumors frequently demonstrate greater sensitivity to PD-1/PD-L1 blockade and other immune checkpoint inhibitors currently used in immuno-oncology.
Advanced image analysis platforms enable automated quantification of cell-to-cell distances, nearest-neighbor analyses, and generation of spatial density maps from multiplex IHC-stained sections. These computational outputs are transforming how we interpret tumor microenvironment composition data and are increasingly referenced in high-impact cancer microenvironment publications.
Modern software combines digital image analysis with quantitative molecular analysis to generate reproducible spatial metrics from large patient cohorts.
Reproducibility is the cornerstone of translational IHC immune profiling. The following protocol overview covers the critical decision points and controls required for generating reliable tumor microenvironment data across single-plex and multiplex workflows.
Ensure cold ischemia time <1 hour; fix in 10% neutral buffered formalin for 6–24 hrs. Over-fixation reduces antigen retrieval efficiency for phosphorylated targets and some checkpoint markers. Document all tissue handling metadata.
Cut 4–5 μm sections on positively charged slides. For multiplex panels, bake at 60°C for 1 hr (FFPE). Use serial sections within 10 slides of each other to minimize tissue heterogeneity confounds in cross-section comparisons.
Optimize retrieval buffer (citrate pH 6.0 vs. EDTA pH 9.0) per each target antibody. Heat-induced epitope retrieval (HIER) is standard for most immune markers. Include validated positive tissue controls (e.g., tonsil for CD8, CD20; placenta for PD-L1).
Apply primary antibodies at validated concentrations; incubate 30 min to overnight at 4°C (marker-dependent). For chromogenic IHC use HRP-DAB or AP-Fast Red systems. For mIF, use TSA (tyramide signal amplification) with distinct fluorophore conjugates per target, with antibody stripping between rounds if using sequential cycling platforms.
Counterstain with hematoxylin (chromogenic) or DAPI (fluorescence). Mount with appropriate aqueous or permanent medium. Scan at 20× or 40× resolution using validated whole-slide imaging (WSI) platforms. Ensure spectral unmixing for mIF panels before quantitative analysis.
Apply validated image analysis algorithms (QuPath, HALO, inForm, or equivalent) for cell segmentation and phenotyping. These tools can help identify specific immune populations, quantify tumor-infiltrating lymphocytes, and characterize spatial distributions of T cells throughout the tissue. Define tissue compartments (tumor core, invasive margin, stroma) using cytokeratin or pathologist annotation masks. Report standardized density metrics (cells/mm²) to enable cross-study comparison.
Include run-matched positive and negative controls for each antibody. Report inter-observer and intra-observer variability metrics. For publications aligned with Nature Reviews Cancer or similar standards, include full antibody clone, concentration, supplier, and retrieval conditions in methods.
Visual Placeholder — IHC / mIHC Protocol Workflow Diagram
Full annotated workflow from FFPE block to digital phenotyping output, with QC checkpoints and branching single-plex / multiplex paths.
No single technology platform captures the full complexity of tumor microenvironment in cancer. IHC immune profiling and genomic assays are complementary, not competitive, providing orthogonal layers of biological information that together deliver the most actionable tumor portrait.
Comprehensive Genomic Profiling identifies key molecular alterations such as somatic mutations, tumor mutational burden (TMB), microsatellite instability (MSI), and copy number variations. These genomic features are critical for guiding targeted therapy and stratifying patients in immuno-oncology studies. However, CGP does not capture protein expression or spatial distribution within tissue samples, which limits its ability to describe functional immune interactions or the organization of neoplastic cells within the tumor niche.
When integrated with IHC, these datasets support more comprehensive molecular analysis of tumor biology and therapeutic response.
RNA-based approaches quantify immune gene signatures using tools such as CIBERSORT and ssGSEA, enabling inference of immune cell populations and transcriptional states. Single-cell RNA sequencing adds resolution at the cellular level but still lacks spatial context. Additionally, RNA expression reflects transcriptional activity rather than actual protein abundance, which may diverge due to post-transcriptional regulation. As a result, RNA-based methods cannot fully replace protein expression analysis achieved through IHC staining, particularly when evaluating immune checkpoint proteins or receptor localization.
Emerging Single-Cell RNA-Seq platforms further improve resolution by characterizing transcriptional heterogeneity among individual immune cells.
Flow cytometry and mass cytometry provide high-dimensional phenotyping of immune cells at single-cell resolution. Both flow cytometry and mass cytometry are widely used to characterize activation states, signaling pathways, and immune population diversity. These technologies can also be used to study T Cell Receptor expression patterns and functional markers associated with cytokine production.
These techniques are widely used in clinical diagnostics and immunology research to analyze immune subsets and activation states. However, they require tissue dissociation, which disrupts the spatial relationships between tumor cells and infiltrating immune populations. This loss of architecture limits interpretation of tumor microenvironment organization and excludes analysis of archived FFPE tissue samples, which are commonly used in retrospective studies.
IHC immune profiling provides spatially resolved, protein-level biomarker data directly within preserved tissue architecture. Using validated primary antibody and secondary antibody systems, IHC detects immune markers, checkpoint proteins, and tumor antigens in situ, enabling detailed mapping of immune infiltration and tumor-immune interactions. Unlike genomic or transcriptomic methods, IHC reflects functional protein expression and allows direct visualization of tumor markers within specific cellular compartments.
This capability makes IHC particularly useful for validating observations generated through flow cytometry, mass cytometry, and transcriptomic profiling workflows.
This spatial perspective is particularly valuable for evaluating immune infiltration, identifying tumor-infiltrating lymphocytes, and understanding how T cells are distributed across different tumor compartments.
This approach is especially valuable in anatomic pathology and molecular pathology, where interpretation of staining patterns contributes to pathological diagnosis and clinical decision-making. The ability to analyze archived FFPE tissue samples makes IHC indispensable for longitudinal studies and biomarker validation.
Research Strategy: For immuno-oncology biomarker programs, IHC should be planned as a co-primary analysis alongside any genomic assay from study inception—not added as an afterthought. Prospective tissue collection and processing protocols optimized for both FFPE-IHC and molecular assays are essential.
While IHC immune profiling is applicable across solid tumors, certain cancer types and clinical scenarios derive the highest informational yield from detailed tumor microenvironment characterization. Below are the highest-priority indication areas, informed by clinical evidence and the cancer microenvironment impact factor literature.
PD-L1 TPS by IHC is FDA-required companion diagnostic for pembrolizumab. Multiplex panels (CD8, FOXP3, CD68, PD-L1) further stratify response beyond TPS alone.
IHC-based characterization of tumor-infiltrating lymphocytes and T cells has become increasingly important for predicting response to immunotherapy in NSCLC.
Spatial predictors of immunotherapy response in triple-negative breast cancer—including stromal TIL density and CD8/FOXP3 ratios by IHC—are among the strongest validated prognostic markers in TNBC.
MMR protein IHC (MLH1, PMS2, MSH2, MSH6) is the standard-of-care screen for Lynch syndrome and predicts response to checkpoint inhibitors in dMMR/MSI-H CRC.
The density and localization of T cells within colorectal tumors provide additional prognostic information beyond molecular classification alone.
CD8 infiltration patterns and PD-L1 expression defined by IHC correlate with response to anti-PD-1 therapy. Multiplex IHC reveals tertiary lymphoid structure (TLS) presence as an emerging biomarker.
PD-L1 CPS (combined positive score) by IHC informs frontline immunotherapy eligibility. Spatial CD8 density at the invasive margin is associated with survival outcomes.
PD-L1 CPS and HPV status (p16 IHC) together stratify HNSCC for immunotherapy. Tumor microenvironment in HPV+ vs. HPV− tumors shows markedly different immune compositions.
Macrophage polarity (CD68 vs. CD163), CD8 density, and PD-L1 expression by IHC define immune subtypes of HCC with differential prognosis and IO sensitivity.
In gastric and GEJ cancer, HER2 IHC, PD-L1 CPS, and MMR status are commonly evaluated to support treatment stratification in selected clinical contexts. EBV status provides an additional molecular classification layer and is typically assessed by EBER in situ hybridization.
Across all these indications, a consistent pattern emerges from the tumor microenvironment and cancer progression literature: the combination of high effector T cell density, low immunosuppressive cell infiltration, and PD-L1 expression at the tumor-immune interface defines tumors most responsive to immunotherapy. IHC remains the most practical method for measuring all three of these parameters in clinical and translational settings.
Translational immuno-oncology research today demands a multi-platform strategy. Modern immune profiling tools now combine spatial pathology, genomic analysis, and computational methods to provide a more comprehensive understanding of tumor-immune interactions within the tumor microenvironment.
IHC immune profiling occupies a central and irreplaceable role, but its insights are most powerful when integrated within a broader experimental ecosystem. Targeting tumor microenvironment biology effectively requires pairing IHC spatial data with functional, transcriptomic, and metabolic readouts.
The strongest studies increasingly combine IHC with orthogonal technologies such as western blot, western blotting, flow cytometry, mass cytometry, and Single-Cell RNA-Seq.
Together, these complementary immune profiling tools help researchers validate biomarkers across multiple biological dimensions while preserving confidence in spatial observations derived from tissue-based analyses.
Core spatial phenotyping platform. 4–10+ markers, single section, quantitative outputs.
Resolves gene expression with spatial coordinates (Visium, Xenium, CosMx)—pairs with IHC protein data.
Together with protein-level data, these approaches improve interpretation of gene expression programs operating within the tumor microenvironment.
Transcriptomic resolution of individual cells. Combines with IHC annotation to validate cell identities spatially.
High-parameter single-cell protein quantification of dissociated tumor samples for immune phenotyping and functional characterization.
Automated WSI analysis and deep learning models for scalable, reproducible IHC scoring across large cohorts.
TMB, MSI, somatic mutation landscape—essential genomic context that IHC spatial data contextualizes at the protein level.
These datasets are often integrated with IHC-derived findings to support broader molecular analysis and biomarker development efforts.
Additional protein characterization approaches
While not spatially resolved, techniques such as western blot, western blotting, and single-cell western blotting can provide complementary validation of antibody performance and target expression. These methods are often used alongside IHC during assay development and biomarker verification studies.
More specialized workflows involving multiplex single cell profiling can further expand characterization of cellular heterogeneity across complex tumor samples.
Integrated Study Design
High-impact publications in the tumor microenvironment in the cancer field increasingly require multi-omic validation. Design studies so that IHC and molecular profiling are conducted from the same specimen, enabling direct cross-platform correlation and avoiding the confounds of tissue heterogeneity.
The convergence of IHC-based immune profiling with computational pathology and multi-omic integration is reshaping how the research community defines and targets tumor microenvironment characteristics. As researchers increasingly combine multiple immune profiling tools to characterize tumor biology from complementary perspectives, spatial context remains a critical component of data interpretation. As noted in recent tumor microenvironment review articles, including benchmark studies cited in Nature Reviews Cancer, the spatial dimension of immune data captured by IHC is now considered indispensable for mechanistic understanding of both tumor microenvironment and cancer progression and response to immunotherapy.
Insights generated through IHC immune profiling increasingly inform development of molecular therapies and selection of targeted drugs. By identifying spatial patterns of immune activation, suppression, and checkpoint signaling, researchers can better understand mechanisms of treatment response and resistance across diverse cancer types.
IHC is one of the widely used techniques that simultaneously reports protein identity, cell morphology, and spatial tissue context.
Multiplex IHC panels of 4–10+ markers can be applied to a single 4 μm FFPE section, preserving scarce tissue.
CD8+ intratumoral density is among the strongest single spatial predictors of checkpoint inhibitor response across solid tumors.
FDA-approved companion diagnostic assays are available for selected biomarkers such as PD-L1, HER2, and MMR proteins in specific cancer and therapy contexts.
Tumor microenvironment characteristics vary significantly between patients and even within different regions of the same tumor (intratumoral heterogeneity).
Designing an IHC immune profiling study? Our scientific team can advise on panel design, protocol optimization, and data analysis strategies for your specific tumor model and research question.
1. Galon J & Bruni D. Approaches to treat immune hot, altered and cold tumours with combination immunotherapies. Nat Rev Drug Discov. 2019.
2. Hofman P, et al. Multiplexed immunohistochemistry for molecular and immune profiling in lung cancer. Cancers. 2019;11(3):283.
3. Binnewies M, et al. Understanding the tumor immune microenvironment (TIME) for effective therapy. Nat Med. 2018;24:541–550.
4. Taube JM, et al. Colocalization of inflammatory response with B7-h1 expression in human melanocytic lesions supports an adaptive resistance mechanism. Sci Transl Med. 2012.
5. Hendry S, et al. Assessing tumor-infiltrating lymphocytes in solid tumors: a practical review for pathologists and proposal for a standardized method. Adv Anat Pathol. 2017.