This website uses cookies to ensure you get the best experience on our website.


- Table of Contents
Plan ACSL1 IHC in paraffin sections around cytoplasmic staining in adipocytes, hepatocytes and kidney distal tubules (HPA tissue IHC). Start the IHC-validated antibody at 0.5–1 µg/mL (datasheet PB10025), then score cell types against appropriate controls.

Expected localisation, validated protocols, controls and antibodies — the at-a-glance facts below, then the full design guide.
| Expected localisation | Cytoplasmic tissue staining (HPA tissue IHC) | |
| Staining pattern | Cytoplasm of adipocytes, hepatocytes and distal tubules (HPA tissue IHC) | |
| Antigen retrieval | EDTA pH 8.0 HIER, heat-mediated (datasheet PB10025) | |
| Positive control | Adipose tissue+4 more · see all | |
| Negative control | Appendix+4 more · see all |
| Fixation | Keep fixation consistent (standard IHC practice; not target-specific); Matched tissue-IHC evidence does not establish the fixation claim. Validate the specimen-specific method before use. (selected-SKU IHC image PB10025) | |
| Caveat | Adipocyte-rich regions can dominate tissue scoring (HPA tissue IHC) | |
| Regulation | Tissue-dependent expression (UniProt) | |
| Isoform / epitope | Three isoforms; cytoplasmic epitope coverage is unknown (UniProt) |
The catalog antibody’s IHC-P protocol (datasheet PB10025) is followed by published ACSL1 staining methods for mouse brain and kidney sections (PMC13073305; PMC6735294).
| Sample | Paraffin-embedded mouse kidney tissue; fixative not specified (datasheet PB10025) |
| Fixation | Image fixative and duration unreported (datasheet PB10025); verify before use. |
| Sectioning | 4–5 µm sections on charged slides (standard) |
| Deparaffinisation | Xylene, graded ethanol series to water (standard) |
| Antigen retrieval | Heat retrieval: EDTA pH 8.0 (datasheet PB10025); 20 min, 95–100 °C (standard) |
| Peroxidase block | 3% H2O2, 10 min, room temperature (standard) |
| Blocking | 10% goat serum (datasheet PB10025) |
| Primary antibody | Rabbit anti-ACSL1, 0.5-1μg/ml (datasheet PB10025) |
| Primary incubation | Overnight at 4 °C (datasheet PB10025) |
| Detection | Streptavidin-biotin complex (SABC), DAB chromogen (datasheet PB10025) |
| Counterstain | Hematoxylin, blue, dehydrate and mount (standard) |
| Expected result | ACSL1-positive staining in adipocytes of adipose tissue (HPA tissue IHC: High). HPA tissue profile: Cytoplasmic expression in several tissues, mainly in adipose tissue, sebaceous glands, liver and kidney. No signal in the no-primary control. |
ACSL1 staining in paraffin sections should appear mainly cytoplasmic, with strong signal in adipocytes, hepatocytes and kidney distal tubules (HPA: Enhanced tissue IHC; HPA: High in these cells). ACSL1 is anchored in mitochondrial outer, peroxisomal, microsomal and endoplasmic reticulum membranes, with most of the protein facing the cytoplasm (UniProt P33121 topology). The expected slide pattern is cellular staining, rather than a sharp outline of the cell surface.
| Strong cytoplasmic staining in hepatocytes, adipocytes or kidney distal tubules. | This fits the reported high IHC signal in those specific cell populations (HPA: High). Compare stained cells with nearby tissue structures; HPA's assessment is cell specific, so a positive kidney section does not imply equally strong staining throughout every tubule. |
| Predominantly nuclear staining, or staining restricted to the cell surface. | That distribution conflicts with the reported cytoplasmic tissue pattern and membrane topology (HPA: tissue IHC profile; UniProt P33121 topology). Treat it as suspect until a positive tissue control and an independently validated antibody support the same compartment. |
| Strong staining in a cell population reported as not detected. | For example, appendix endocrine cells and caudate glial cells are reported as not detected (HPA: tissue IHC). Cross-reactivity or endogenous chromogenic activity is possible (general IHC practice). Assess the named cells, since a negative call for one population does not classify the whole tissue. |
| Diffuse color across cells and surrounding tissue, with little cell-level contrast. | This does not resemble the reported cytoplasmic staining in defined cell populations (HPA: tissue IHC profile). Nonspecific antibody binding or detection background may obscure interpretation (general IHC practice); compare a no-primary control before scoring weak signal. |
| No visible staining in hepatocytes or adipocytes. | Both are reported as high staining populations (HPA: High in liver hepatocytes and adipose adipocytes), so an absent signal calls the IHC run into question. Check tissue preservation and positive controls, then review retrieval and detection steps (general IHC practice). |
| Subcellular distribution | ACSL1 occupies several intracellular membranes and has a cytoplasm-facing region from residues 46–698 (UniProt P33121 topology). A chromogenic IHC image may read as cytoplasmic rather than resolving each organelle (HPA: tissue IHC profile); do not infer one specific organelle from brown cytoplasmic color alone. |
| Choice of comparison cells | High IHC signal is reported in adipocytes, hepatocytes, cardiomyocytes, kidney distal tubules and lung alveolar type II cells (HPA: High). HPA also reports selected cells as low or not detected; compare the same cell type and compartment when judging an unexpected result. |
| Antibody validation | HPA rates ACSL1 tissue IHC reliability Enhanced and lists two antibodies with Enhanced IHC validation, HPA011316 and HPA011964 (HPA: tissue IHC; HPA: antibodies). That supports the reported pattern, but agreement with HPA alone does not prove that every signal from a different antibody is specific. |
| Isoforms and epitope | UniProt lists three ACSL1 isoforms (UniProt P33121). Without an epitope location for the antibody in this payload, the record cannot predict whether each isoform is detected or explain a discrepant tissue result by isoform choice. |
| IF/ICC Q&A: should vesicle signal match IHC? | HPA calls the ICC-IF location vesicles, with uncertain confidence, in images from A-431, RT-4 and U2OS (HPA: subcellular ICC-IF). This observation does not establish an organelle-specific pattern in paraffin tissue or replace the cytoplasmic IHC profile (HPA: tissue IHC). |
| Situation | Likely cause | Next action |
|---|---|---|
| A known-positive liver section has no hepatocyte signal. | Hepatocytes are reported as high staining (HPA: liver IHC); an absent signal may reflect an assay failure or an unsuitable specimen (general IHC practice). | Confirm that the tissue contains intact hepatocytes; check the positive control, antibody preparation, retrieval record and chromogenic detection steps before interpreting experimental negatives. |
| The slide shows nuclear color but little cytoplasmic color. | A nuclear-only pattern disagrees with ACSL1's intracellular membrane topology and HPA's cytoplasmic tissue profile (UniProt P33121 topology; HPA: tissue IHC). | Review the counterstain and no-primary control; seek the expected cytoplasmic signal in an HPA high cell population before calling nuclear color ACSL1. |
| Many cell types stain equally strongly in a mixed tissue. | Uniform staining weakens the expected cell-level contrast (HPA: tissue IHC). Nonspecific binding or endogenous detection activity can also produce color (general IHC practice). | Compare HPA high and not-detected cell populations by name; inspect no-primary and detection controls, then optimize blocking or antibody concentration if background persists (general IHC practice). |
| Diffuse brown deposit obscures cell boundaries. | Diffuse deposit prevents a confident match to the reported cytoplasmic pattern (HPA: tissue IHC profile); detection background is a possible explanation (general IHC practice). | Check a no-primary control and review blocking, washing and chromogen development (general IHC practice). Score only cell-associated signal that remains distinct from background. |
| Kidney staining is present, but distal tubules are weak. | High kidney staining is assigned specifically to distal tubules (HPA: kidney IHC). A positive section-level impression can therefore conceal a mismatch in the relevant cells. | Identify distal tubules on the section and compare their cytoplasmic signal with a positive control; review assay performance if those cells remain weak (general IHC practice). |
| An HPA not-detected comparator appears positive. | HPA's negative observations apply to named populations, such as appendix endocrine cells or caudate glial cells (HPA: tissue IHC); color elsewhere in those tissues does not contradict that call. | Verify the stained cell identity first. If the named population itself is positive, assess no-primary and independent-antibody controls before attributing the color to ACSL1 (general IHC practice). |


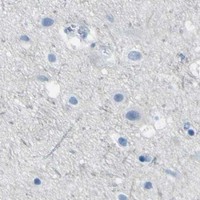


Comprehensive Human Protein Atlas IHC scoring per tissue (reliability: Enhanced — High consistency between antibody staining and RNA expression data. Antibody staining in cells/structures not annotated, view images.). Rows are taken directly from the HPA tissue chart — click any row's HPA link to view the source.
| Tissue | Cell type | Level | Evidence | Source |
|---|---|---|---|---|
| Adipose tissue | Adipocytes | High | Protein (IHC) | HPA → |
| Breast | Adipocytes | High | Protein (IHC) | HPA → |
| Duodenum | Endocrine cells | High | Protein (IHC) | HPA → |
| Epididymis | Glandular cells | High | Protein (IHC) | HPA → |
| Heart muscle | Cardiomyocytes | High | Protein (IHC) | HPA → |
| Tissue | Cell type | Level | Evidence | Source |
|---|---|---|---|---|
| Appendix | Endocrine cells | Not detected | Protein (IHC) | HPA → |
| Caudate | Glial cells | Not detected | Protein (IHC) | HPA → |
| Cerebellum | Cells in granular layer | Not detected | Protein (IHC) | HPA → |
| Cerebral cortex | Endothelial cells | Not detected | Protein (IHC) | HPA → |
| Cervix | Glandular cells | Not detected | Protein (IHC) | HPA → |
Troubleshoot ACSL1 staining in paraffin sections by checking retrieval, cellular distribution and controls before interpreting DAB intensity (datasheet PB10025; HPA tissue IHC).
PB10025 has IHC images from paraffin sections of mouse and rat kidney and human liver cancer tissue, plus an IF/ICC image from U20S cells (catalog image captions).
PB10025 is listed for IHC and IF/ICC, with human, mouse and rat reactivity (catalog applications; catalog reactivity). Its IHC captions show mouse and rat kidney and human liver cancer tissue; its IF caption shows U20S cells (catalog image captions).
Which to pick: For tissue IHC, choose PB10025: its mouse kidney image used a paraffin section, EDTA retrieval at pH 8.0 and 1 μg/ml primary antibody; the fixative is unreported (PB10025 IHC image caption). For IF/ICC, PB10025 has a U20S cell image using 5 μg/ml primary antibody (PB10025 IF image caption). For IHC across species, PB10025 has paraffin-section images from mouse and rat kidney and human liver cancer tissue (PB10025 IHC image captions).