This website uses cookies to ensure you get the best experience on our website.


- Table of Contents
Plan chromogenic BCL2L11 IHC in paraffin sections using the observed cytoplasmic pattern and documented positive cell populations (HPA tissue IHC). Compare the antibody epitope with the 20 annotated isoforms before interpreting staining intensity (UniProt).

Expected localisation, validated protocols, controls and antibodies — the at-a-glance facts below, then the full design guide.
| Expected localisation | General cytoplasmic tissue staining (HPA tissue IHC) | |
| Staining pattern | Cytoplasmic staining; high in kidney tubules and lung macrophages (HPA tissue IHC) | |
| Antigen retrieval | EDTA pH 8.0 HIER, heat-mediated (datasheet A01552-4) | |
| Positive control | Appendix+4 more · see all | |
| Negative control | None in HPA (detected in all 45 tissues); use no-primary + isotype controls |
| Fixation | Keep fixation consistent across sections (standard IHC practice; not target-specific) | |
| Caveat | Isoform diversity may affect antibody epitope coverage (UniProt) | |
| Regulation | Phosphorylation-linked degradation may lower signal (UniProt) | |
| Isoform / epitope | 20 isoforms; verify epitope coverage (UniProt) |
The catalog antibody's IHC-P protocol (datasheet A01552-4) is presented alongside a published thyroid IHC protocol (PMC12881209).
| Sample | Paraffin-embedded human lung cancer tissue; fixative not specified (datasheet A01552-4) |
| Fixation | Image fixative and duration unreported (datasheet A01552-4); verify before use. |
| Sectioning | 4–5 µm sections on charged slides (standard) |
| Deparaffinisation | Xylene, graded ethanol series to water (standard) |
| Antigen retrieval | Heat retrieval: EDTA pH 8.0 (datasheet A01552-4); 20 min, 95–100 °C (standard) |
| Peroxidase block | 3% H2O2, 10 min, room temperature (standard) |
| Blocking | 10% goat serum (datasheet A01552-4) |
| Primary antibody | Rabbit anti-BCL2L11, 2-5 μg/ml (datasheet A01552-4) |
| Primary incubation | Overnight at 4 °C (datasheet A01552-4) |
| Detection | Streptavidin-biotin complex (SABC), DAB chromogen (datasheet A01552-4) |
| Counterstain | Hematoxylin, blue, dehydrate and mount (standard) |
| Expected result | BCL2L11-positive staining in lymphoid tissue of appendix (HPA tissue IHC: High). HPA tissue profile: General cytoplasmic expression. No signal in the no-primary control. |
BCL2L11 should appear chiefly in the cytoplasm on IHC, consistent with its association with intracytoplasmic membranes and mitochondria despite having no annotated transmembrane segment (HPA: general cytoplasmic IHC expression; UniProt O43521: subcellular location and topology). Strong staining is reported in kidney tubule cells, lung macrophages and endometrial glandular cells, among others (HPA: High in each). Treat intensity as a guide: HPA rates the tissue IHC profile Approved, with medium consistency between staining and RNA data (HPA: reliability).
| Cytoplasmic staining in kidney tubule cells, lung macrophages or endometrial glandular cells. | This matches reported High staining in those cell types (HPA: tissue IHC). Assess intensity against neighboring cells within the same section; a positive result need not outline individual mitochondria in chromogenic IHC (standard IHC interpretation). |
| Signal confined to nuclei, with little or no cytoplasmic staining. | An isolated nuclear pattern conflicts with the reported cytoplasmic IHC profile and mitochondrial or intracytoplasmic membrane location (HPA: tissue IHC; UniProt O43521: subcellular location). Reassess staining specificity and distinguish chromogen from the nuclear counterstain (standard IHC practice). |
| Strong staining mainly in a cell population reported as Low, such as smooth muscle cells or fibroblasts. | That distribution differs from the HPA tissue examples (HPA: Low in smooth muscle cells and soft-tissue fibroblasts). Consider cross-reactivity or endogenous detection activity before calling it BCL2L11; a Low designation does not mean every cell must be blank (standard IHC interpretation). |
| Diffuse color across cells, stroma or slide regions, without recognizable cellular boundaries. | A widespread haze is difficult to score as the reported cytoplasmic pattern (HPA: tissue IHC). Uneven detection or nonspecific background is possible; compare a matched negative control and inspect whether the signal follows tissue structures (standard IHC practice). |
| No detectable staining in a kidney section containing tubules, despite an interpretable counterstain. | Tubule cells are a reported High-staining reference, so an entirely blank result warrants a technical check (HPA: High in kidney tubule cells). It does not alone establish biological absence: evaluate tissue preservation, antibody and detection controls, and the scoring threshold (standard IHC practice). |
| Compartment and resolution | UniProt places BCL2L11 at mitochondria and intracytoplasmic membranes, while HPA describes general cytoplasmic tissue IHC staining (UniProt O43521: subcellular location; HPA: tissue IHC). Score the compartment visible by chromogenic microscopy rather than requiring resolved mitochondrial puncta (standard IHC practice). |
| Tissue and isoform variation | BimEL, BimL and BimS are widely expressed with tissue-specific variation; Bim-gamma is most abundant in small intestine and colon (UniProt O43521: tissue specificity). The HPA IHC levels describe observed cell populations, not isoform-specific staining (HPA: tissue IHC). |
| Strength of IHC evidence | HPA calls the tissue IHC profile Approved and reports medium agreement between antibody staining and RNA expression (HPA: reliability). CAB026332 is IHC Approved; no IHC Enhanced designation is supplied for it (HPA: antibody validation). Interpret unexpected staining with controls rather than treating the profile as universal. |
| Can IF/ICC help judge the compartment? | Yes. HPA reports supported mitochondrial localization in U2OS ICC-IF images and lists CAB079899 as ICC Supported (HPA: subcellular location; HPA: antibody validation). That supports a mitochondrial IF comparison; it does not set a required punctate appearance for paraffin-section chromogenic IHC (HPA: general cytoplasmic IHC expression). |
| Situation | Likely cause | Next action |
|---|---|---|
| Kidney tubules show no color. | The result conflicts with their reported High staining; a failed staining or detection step remains possible (HPA: High in kidney tubule cells; standard IHC practice). | Check the IHC control, reagent sequence and detection system, then review section quality before interpreting the sample as negative (standard IHC practice). |
| Only nuclei are colored. | Nuclear-only signal does not fit the reported cytoplasmic and mitochondrial locations (HPA: tissue IHC; UniProt O43521: subcellular location). | Compare with the counterstain and a negative control; reassess antibody specificity if the nuclear signal persists (standard IHC practice). |
| Smooth muscle or fibroblasts dominate the positive area. | These populations are listed as Low in the supplied HPA examples; cross-reactivity or endogenous activity may contribute (HPA: tissue IHC; standard IHC interpretation). | Compare the staining with a matched negative control and with an HPA High cell population in the same staining run (HPA: tissue IHC; standard IHC practice). |
| Brown haze obscures cell boundaries. | Diffuse background prevents a reliable call of the cytoplasmic pattern (HPA: tissue IHC; standard IHC interpretation). | Inspect the negative control and review blocking, washing and detection conditions as general chromogenic IHC checks (standard IHC practice). |
| Macrophages stain strongly while nearby cells are weak. | This can reflect the reported cell-specific distribution: lung macrophages are High, while the HPA profile does not assign every nearby cell the same level (HPA: lung tissue IHC). | Identify the stained cell population on morphology and score its cytoplasmic signal separately from adjacent cells (standard IHC practice). |
| IHC looks broadly cytoplasmic, but an IF image looks mitochondrial. | Both observations can fit the supplied evidence: tissue IHC is described as generally cytoplasmic, and ICC-IF localization is supported at mitochondria (HPA: tissue IHC; HPA: subcellular location). | Interpret each image at its own resolution; use the tissue IHC cell distribution for chromogenic scoring (HPA: tissue IHC; standard IHC interpretation). |
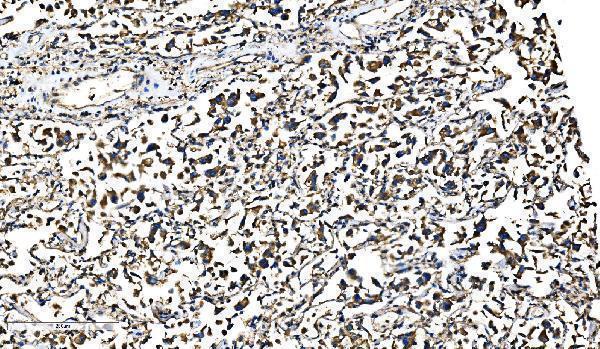
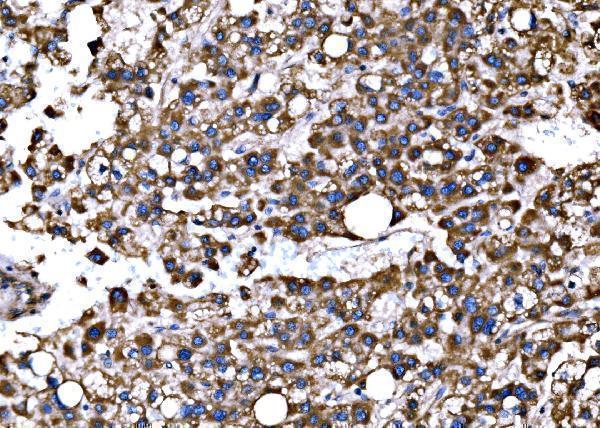


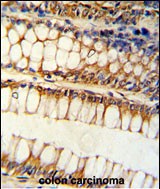
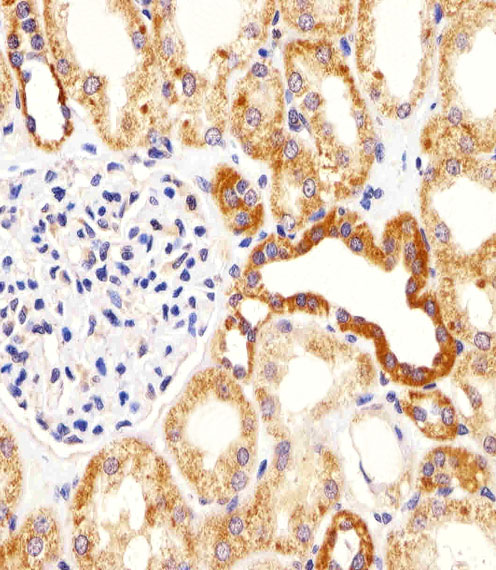


Comprehensive Human Protein Atlas IHC scoring per tissue (reliability: Approved — Medium consistency between antibody staining and RNA expression data.). Rows are taken directly from the HPA tissue chart — click any row's HPA link to view the source.
| Tissue | Cell type | Level | Evidence | Source |
|---|---|---|---|---|
| Appendix | Lymphoid tissue | High | Protein (IHC) | HPA → |
| Breast | Adipocytes | High | Protein (IHC) | HPA → |
| Endometrium | Glandular cells | High | Protein (IHC) | HPA → |
| Kidney | Cells in tubules | High | Protein (IHC) | HPA → |
| Lung | Macrophages | High | Protein (IHC) | HPA → |
| Tissue | Cell type | Level | Evidence | Source |
|---|---|---|---|---|
| None in HPA: BCL2L11 is detected in all 45 scored tissues. Use a no-primary (secondary-only) and an isotype control instead. | ||||
Troubleshoot BCL2L11 staining in paraffin sections by checking retrieval, cellular context and controls before interpreting chromogenic signal (datasheet A01552-4; HPA tissue IHC).
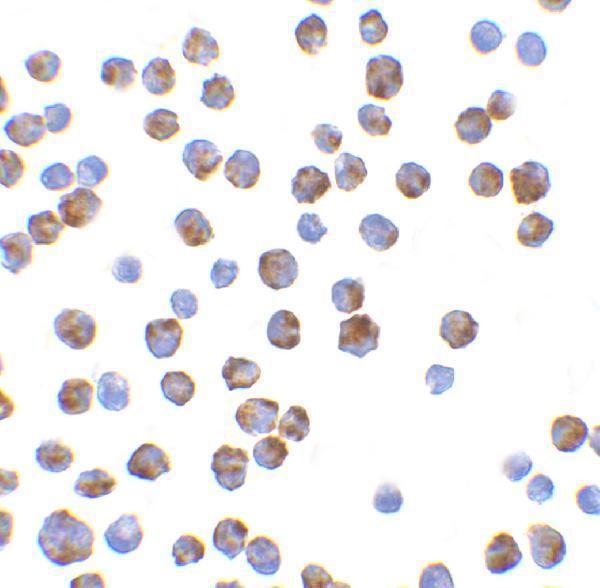
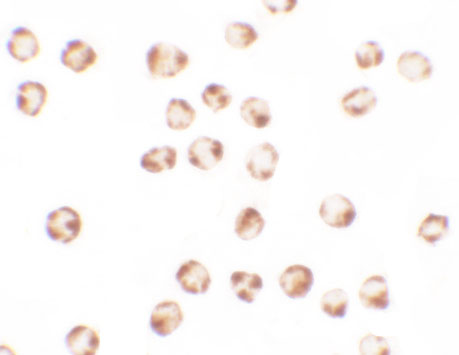
The catalog shows human paraffin-section IHC examples (A01552-4, M01552, A01552-3: image captions) and K562 IF/ICC examples (A01552, A01552-2: image captions).
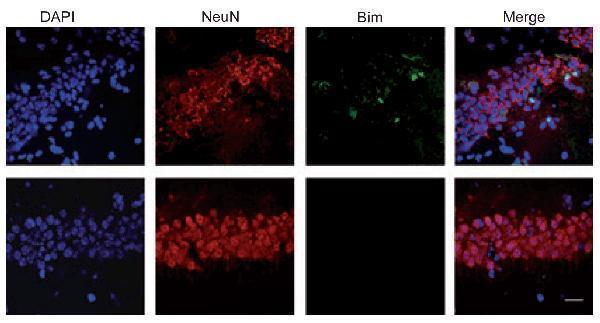
A01552-4 shows human lung cancer IHC (catalog image caption); M01552 shows human prostate cancer IHC (catalog image caption); and A01552-3 shows formalin-fixed, paraffin-embedded human colon carcinoma IHC (catalog image caption). A01552 shows IF in K562 cells and IHC in mouse hippocampus (catalog image captions); A01552-2 shows ICC/IF in K562 cells (catalog image captions).
Which to pick: For human paraffin-section IHC, start with A01552-4 at 2–5 μg/ml (catalog: IHC dilution); its lung cancer caption specifies EDTA retrieval at pH 8.0 but does not report the fixative (A01552-4: IHC caption). For IF/ICC, choose A01552 for human samples (catalog: application validation) or A01552-2 when targeting the Bim EL isoform (catalog: title and IF/ICC captions). For a monoclonal option with listed human, mouse and rat reactivity across IHC and IF/ICC, choose M01552 (catalog: clone CBE-2, applications and reactivity); its paraffin-section IHC caption does not report the fixative (M01552: IHC caption).