This website uses cookies to ensure you get the best experience on our website.


- Table of Contents
Plan chromogenic CA2 IHC in paraffin sections with catalog antibody M00143 at 0.5–1 μg/mL (datasheet M00143). Use the observed cytoplasmic and nuclear tissue pattern to guide staining assessment (HPA tissue IHC).

Expected localisation, validated protocols, controls and antibodies — the at-a-glance facts below, then the full design guide.
| Expected localisation | Tissue IHC: cytoplasm/nucleus; UniProt: cytoplasm/membrane (HPA tissue IHC; UniProt) | |
| Staining pattern | GI tract, kidney tubules, gallbladder, glia: cytoplasm/nucleus (HPA tissue IHC) | |
| Antigen retrieval | EDTA pH 8.0 HIER, heat-mediated (datasheet M00143) | |
| Positive control | Appendix+4 more · see all | |
| Negative control | Adipose tissue+4 more · see all |
| Fixation | Keep paraffin-section fixation consistent across samples. (standard IHC practice; not target-specific) | |
| Caveat | Antibody staining has medium concordance with RNA expression (HPA tissue IHC) | |
| Regulation | PKC/PMA displaces membrane-associated CA2 (UniProt) | |
| Isoform / epitope | No isoforms; chain 2–260; no extracellular domain (UniProt) |
The catalog antibody’s IHC-P protocol (datasheet: M00143) is accompanied by published CA2 staining protocols for chicken uterine tissue (PMC9513254) and ovarian granulosa cell areas (PMC13592854).
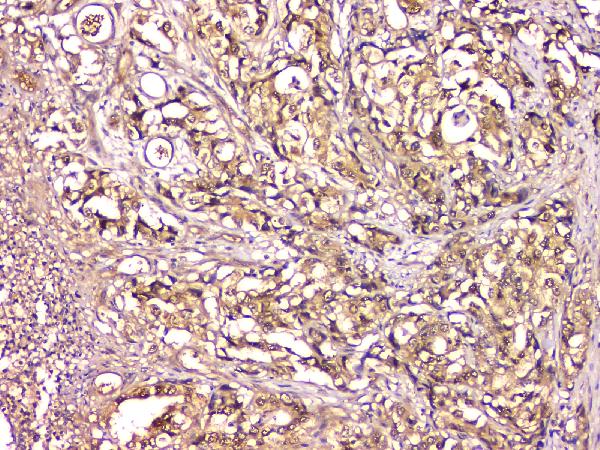
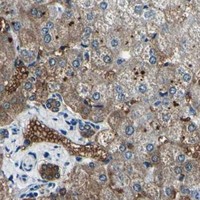
| Sample | Paraffin-embedded human gastric cancer tissue; fixative not specified (datasheet M00143) |
| Fixation | Image fixative and duration unreported (datasheet M00143); verify before use. |
| Sectioning | 4–5 µm sections on charged slides (standard) |
| Deparaffinisation | Xylene, graded ethanol series to water (standard) |
| Antigen retrieval | Heat retrieval: EDTA pH 8.0 (datasheet M00143); 20 min, 95–100 °C (standard) |
| Peroxidase block | 3% H2O2, 10 min, room temperature (standard) |
| Blocking | 10% goat serum (datasheet M00143) |
| Primary antibody | Mouse monoclonal (clone 10E11) anti-CA2, 0.5-1μg/ml (datasheet M00143) |
| Primary incubation | Overnight at 4 °C (datasheet M00143) |
| Detection | Streptavidin-biotin complex (SABC), DAB chromogen (datasheet M00143) |
| Counterstain | Hematoxylin, blue, dehydrate and mount (standard) |
| Expected result | CA2-positive staining in endocrine cells of appendix (HPA tissue IHC: High). HPA tissue profile: Cytoplasmic and nuclear expression in gastrointestinal tract, kidney tubules, gallbladder and glial cells. No signal in the no-primary control. |
In paraffin-section IHC, expect CA2 staining chiefly in cytoplasm, with nuclear staining reported in gastrointestinal cells, kidney tubules, gallbladder cells and glial cells (HPA tissue IHC). CA2 is cytoplasmic and can associate with the cell membrane; it has no transmembrane segment (UniProt P00918). HPA rates the tissue pattern Enhanced, while describing only medium consistency between antibody staining and RNA expression (HPA tissue IHC).
| Distinct cytoplasmic staining in gallbladder glandular cells, intestinal endocrine cells or glial cells. | This fits reported positive populations; HPA lists gallbladder glandular cells, appendix, colon and duodenum endocrine cells, and several glial populations as High (HPA tissue IHC). Judge the named cells within their tissue, rather than treating every cell on the section as an expected positive. |
| Nuclear staining accompanies cytoplasmic staining, or cerebellar granular-cell nuclei stain strongly. | Do not reject nuclear signal solely because UniProt lists cytoplasm and cell membrane: HPA reports nuclear expression in its tissue profile and High staining in cerebellar granular-cell nuclei (HPA tissue IHC; UniProt P00918). Check whether the signal follows those reported cells and retains clear boundaries. |
| Staining is confined to extracellular material or appears only as a continuous outline around every cell. | That distribution does not match the reported cytoplasmic and nuclear tissue pattern or establish CA2 membrane association (HPA tissue IHC; UniProt P00918). Review the negative control and detection steps before assigning the signal to CA2 (standard IHC practice). |
| Strong signal appears in adipocytes or bronchial respiratory epithelial cells while expected positive cells are also stained. | HPA reports CA2 as Not detected in those specific cell populations (HPA tissue IHC). Consider antibody cross-reactivity or endogenous detection activity, and compare a reagent-omission control; a positive control elsewhere does not validate every stained cell (standard IHC practice). |
| Known positive cells lack staining, or the whole section has a diffuse brown haze. | Absent signal in a reported High population makes a negative interpretation inconclusive; uniform haze makes cell-level scoring unreliable (HPA tissue IHC; standard IHC practice). Inspect section integrity, detection controls and background before interpreting either result. |
| Compartment and tissue context | UniProt places CA2 in cytoplasm and at the cell membrane, whereas HPA tissue IHC also reports nuclear staining; interpret nuclear signal in the reported cells in that context, especially cerebellar granular-cell nuclei (UniProt P00918; HPA tissue IHC). |
| Choice of positive and comparison tissue | Gallbladder glandular cells, intestinal endocrine cells and glial cells provide reported High populations; adipocytes and bronchial respiratory epithelial cells are listed as Not detected (HPA tissue IHC). These are cell-specific comparisons, not claims that an entire tissue is uniformly positive or negative. |
| IHC evidence versus IF/ICC evidence: can the pattern be transferred? | HPA lists two antibodies with Enhanced IHC validation, HPA001550 and CAB010102, but gives neither an ICC validation status nor ICC/IF images or a main subcellular location (HPA antibodies; HPA subcellular). Use the tissue pattern as IHC evidence; an IF/ICC result needs its own validation. |
| Processing and isoforms | UniProt lists one CA2 chain spanning residues 2–260, no signal peptide or propeptide, and no annotated isoforms (UniProt P00918). The supplied record therefore gives no basis for expecting a distinct processed or isoform-specific tissue staining pattern. |
| Chromogenic detection background | Endogenous peroxidase activity or nonspecific reagent binding can generate brown signal independently of the primary antibody; blocking and reagent-omission controls help identify it (standard IHC practice). This is a general detection concern, not a reported CA2-specific effect. |
| Situation | Likely cause | Next action |
|---|---|---|
| No stain in gallbladder glandular cells or another reported High population. | The run may have failed, or the chosen preparation and detection settings may need optimization; HPA's High rating describes observed staining, not guaranteed performance in every run (HPA tissue IHC; standard IHC practice). | Check tissue preservation and a run control, then review the IHC-validated antibody's supplied IHC-P conditions, retrieval step and detection reagents before scoring the sample negative (standard IHC practice). |
| Brown precipitate is widespread, including areas without identifiable positive cells. | Excess chromogen development, incomplete washing or endogenous detection activity can obscure a cell-specific pattern (standard IHC practice). | Compare a primary-antibody omission control; inspect wash and detection steps, and reduce nonspecific background before interpreting CA2 localisation (standard IHC practice). |
| Adipocytes or bronchial respiratory epithelial cells stain strongly. | Those cells are listed as Not detected, so cross-reactivity or detection background is plausible; HPA status alone cannot identify the cause in this run (HPA tissue IHC; standard IHC practice). | Compare the omission control and a reported High cell population on the same run; investigate antibody specificity if the unexpected cellular signal persists (HPA tissue IHC; standard IHC practice). |
| Only nuclei stain, across nearly all cell types. | HPA supports nuclear staining in some populations, notably cerebellar granular cells, but a uniform, tissue-wide nuclear pattern is not established by its CA2 profile (HPA tissue IHC). | Identify the stained cell types, compare their cytoplasm and the omission control, and avoid calling the pattern CA2-specific until the cellular distribution is supported (HPA tissue IHC; standard IHC practice). |
| An IF/ICC image seems to disagree with the paraffin-section IHC result. | HPA supplies Enhanced IHC antibody status but no ICC validation status, ICC/IF images or main ICC/IF location for CA2 (HPA antibodies; HPA subcellular). | Treat the IF/ICC observation as a separate result requiring validation; do not use this IHC tissue profile as proof of an IF/ICC compartment pattern (HPA tissue IHC; HPA subcellular). |


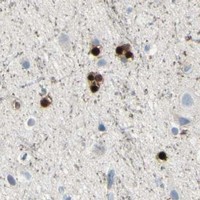


Comprehensive Human Protein Atlas IHC scoring per tissue (reliability: Enhanced — Medium consistency between antibody staining and RNA expression data.). Rows are taken directly from the HPA tissue chart — click any row's HPA link to view the source.
| Tissue | Cell type | Level | Evidence | Source |
|---|---|---|---|---|
| Appendix | Endocrine cells | High | Protein (IHC) | HPA → |
| Caudate | Glial cells | High | Protein (IHC) | HPA → |
| Cerebellum | Granular cells - nucleus | High | Protein (IHC) | HPA → |
| Cerebral cortex | Glial cells | High | Protein (IHC) | HPA → |
| Colon | Endocrine cells | High | Protein (IHC) | HPA → |
| Tissue | Cell type | Level | Evidence | Source |
|---|---|---|---|---|
| Adipose tissue | Adipocytes | Not detected | Protein (IHC) | HPA → |
| Adrenal gland | Glandular cells | Not detected | Protein (IHC) | HPA → |
| Bronchus | Respiratory epithelial cells | Not detected | Protein (IHC) | HPA → |
| Cervix | Glandular cells | Not detected | Protein (IHC) | HPA → |
| Endometrium | Cells in endometrial stroma | Not detected | Protein (IHC) | HPA → |
Troubleshoot CA2 staining in paraffin sections by checking retrieval, cell type, compartment, detection controls, and scoring (datasheet M00143; HPA tissue IHC; UniProt P00918).
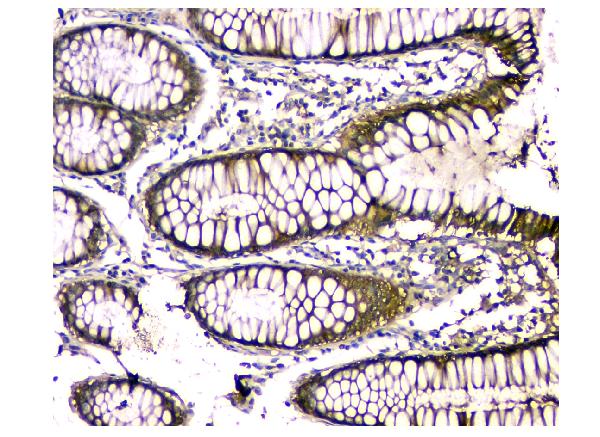
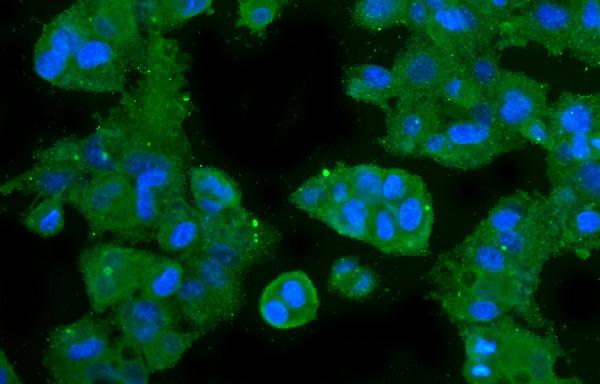
Anti-CA2 IHC images cover paraffin sections of human gastric, colon and liver cancers and mouse/rat intestine; IF imagery covers HEPG2 cells (catalog image captions).
M00143 has IHC images from human gastric and colon cancers and mouse/rat intestine, plus IF imagery from HEPG2 cells (M00143 image captions). PB9989 has IHC images from human gastric and liver cancers and lists IF/ICC among its applications (PB9989 image captions; catalog applications).
Which to pick: For tissue IHC, M00143’s paraffin-section caption uses EDTA retrieval at pH 8, while PB9989’s uses citrate at pH 6; neither caption reports the fixative (M00143 and PB9989 IHC captions). For IF/ICC, choose M00143 for its HEPG2 IF image; PB9989 lists IF/ICC but has no IF image in the payload (M00143 IF caption; PB9989 applications and image payload). For cross-species IHC, M00143 is a mouse monoclonal with human, mouse and rat tissue images; PB9989 is rabbit-hosted and lists those species as reactive, but its IHC images show human tissue only (catalog host, clone and reactivity; M00143 and PB9989 IHC captions).