This website uses cookies to ensure you get the best experience on our website.


- Table of Contents
This guide covers paraffin-section FLOT2 IHC using an IHC-validated catalog antibody (datasheet: PB9623). It helps select controls and score the cytoplasmic and membranous tissue pattern reported by HPA (HPA tissue IHC).

Expected localisation, validated protocols, controls and antibodies — the at-a-glance facts below, then the full design guide.
| Expected localisation | Cytoplasmic and membranous tissue staining (HPA tissue IHC) | |
| Staining pattern | Broad cytoplasmic and membranous staining; endocrine cells high (HPA tissue IHC) | |
| Antigen retrieval | EDTA pH 8.0 HIER, heat-mediated (datasheet PB9623) | |
| Positive control | Appendix+4 more · see all | |
| Negative control | None in HPA (detected in all 45 tissues); use no-primary + isotype controls |
| Fixation | Keep fixation consistent across sections (standard IHC practice; not target-specific). Selected-image fixative and duration unreported (datasheet PB9623); verify before use. | |
| Caveat | Squamous epithelium and muscle may stain weakly (HPA tissue IHC) | |
| Regulation | No staining regulator established (UniProt) | |
| Isoform / epitope | No isoforms or transmembrane segment annotated (UniProt) |
Compare the catalog antibody’s IHC-P protocol (PB9623 datasheet) with two published FLOT2 IHC protocols (PMC4496397; PMC6365903).
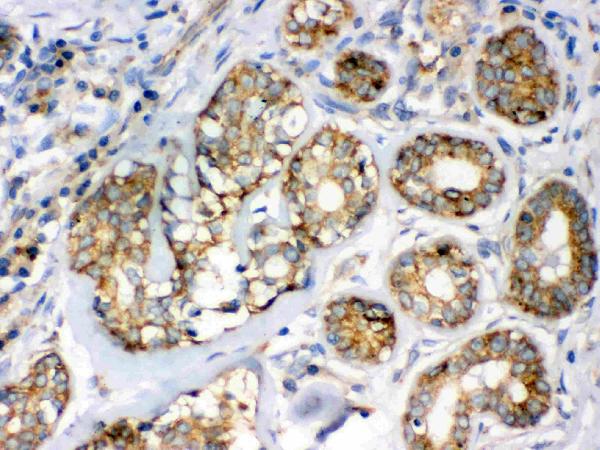
| Sample | Paraffin-embedded human mammary cancer tissue; fixative not specified (datasheet PB9623) |
| Fixation | Image fixative and duration unreported (datasheet PB9623); verify before use. |
| Sectioning | 4–5 µm sections on charged slides (standard) |
| Deparaffinisation | Xylene, graded ethanol series to water (standard) |
| Antigen retrieval | Heat retrieval: EDTA pH 8.0 (datasheet PB9623); 20 min, 95–100 °C (standard) |
| Peroxidase block | 3% H2O2, 10 min, room temperature (standard) |
| Blocking | 10% goat serum (datasheet PB9623) |
| Primary antibody | Rabbit anti-FLOT2, 0.5-1μg/ml (datasheet PB9623) |
| Primary incubation | Overnight at 4 °C (datasheet PB9623) |
| Detection | Streptavidin-biotin complex (SABC), DAB chromogen (datasheet PB9623) |
| Counterstain | Hematoxylin, blue, dehydrate and mount (standard) |
| Expected result | FLOT2-positive staining in endocrine cells of appendix (HPA tissue IHC: High). HPA tissue profile: Ubiquitous cytoplasmic and membranous expression. No signal in the no-primary control. |
FLOT2 should show cytoplasmic and membranous staining across many tissues, with stronger staining in selected cell populations (HPA tissue IHC: ubiquitous expression; Supported reliability, medium consistency with RNA). Its association with the cell membrane, caveolae and endosomes supports a peripheral or vesicular pattern; it has no annotated transmembrane segment (UniProt Q14254). In skin, assess epidermal layers separately because basal and suprabasal cells differ (UniProt Q14254 tissue specificity).
| Membranous staining with some cytoplasmic staining in expected cells. | This fits the reported tissue pattern (HPA tissue IHC). Membrane-associated FLOT2 and its endosomal location make peripheral and intracellular signal plausible (UniProt Q14254). Judge distribution within identified cells, alongside the intensity of the control tissue; HPA reports medium consistency between staining and RNA (HPA tissue IHC: Supported). |
| Strong nuclear-only staining, with little membrane or cytoplasmic signal. | A dominant nuclear pattern conflicts with the reported tissue and subcellular distributions (HPA tissue IHC; HPA ICC-IF: plasma membrane and vesicles; UniProt Q14254). Suspect nonspecific staining or a detection artefact; assess a known-positive tissue and a no-primary control before treating it as FLOT2 (general IHC practice). |
| Strong staining in basal epidermal cells, without the expected suprabasal pattern. | This reverses the reported skin distribution: FLOT2 is described in epidermal layers except the basal layer, and in suprabasal but not basal hair-follicle cells (UniProt Q14254 tissue specificity). Check cell identification and controls; persistent basal staining may reflect cross-reactivity or endogenous detection activity (general IHC practice). |
| Diffuse chromogen across cells, stroma or the entire section. | Diffuse deposition obscures the reported cytoplasmic and membranous pattern (HPA tissue IHC). It may arise from nonspecific antibody binding, incomplete blocking or endogenous detection activity (general IHC practice). A no-primary control helps separate detection background from antibody-dependent staining (general IHC practice). |
| No detectable staining in a selected high-expression cell population. | An absent signal in glandular endometrial cells or neuronal cerebral-cortex cells conflicts with their reported High staining (HPA tissue IHC: Endometrium, glandular cells; Cerebral cortex, neuronal cells). Verify that the intended cells are present, then review the IHC workflow and controls; one negative section does not establish absence of FLOT2 (general IHC practice). |
| Cell population and tissue selection | HPA reports High staining in appendix and colon endocrine cells, endometrial and fallopian-tube glandular cells, and selected brain cells; it lists low staining in several muscle and squamous epithelial populations (HPA tissue IHC). Compare like cell populations, since whole-tissue averages can hide a positive minority (general IHC practice). |
| Skin layer | Epidermal and appendage staining is expected, while dermis and basal epidermal or hair-follicle layers are not described as expressing FLOT2 (UniProt Q14254 tissue specificity). Identify the layer before calling unexpected staining positive or negative (general IHC practice). |
| Compartment and topology | FLOT2 is membrane associated, including caveolae, and is also reported at endosomes; no transmembrane segment is annotated (UniProt Q14254). HPA tissue IHC describes cytoplasmic and membranous staining. Interpret both compartments, without requiring a continuous surface outline in every cell (HPA tissue IHC; general IHC practice). |
| Antibody evidence | The tissue profile has Supported reliability with medium staining–RNA consistency (HPA tissue IHC). HPA lists IHC as Supported for HPA001396 and CAB004395; those entries do not establish that every antibody reproduces the same pattern (HPA antibodies; general IHC practice). |
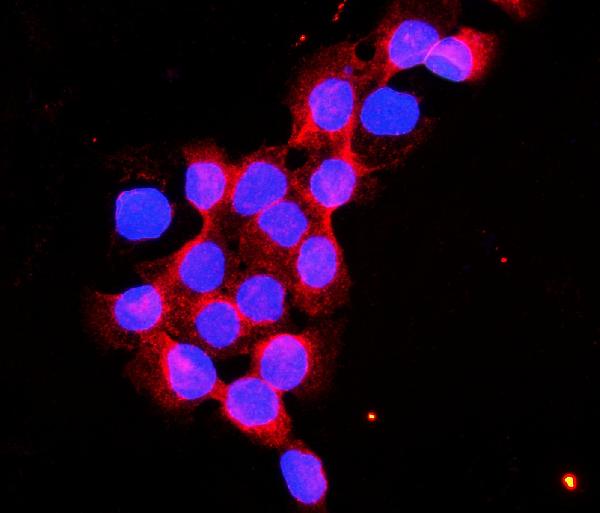
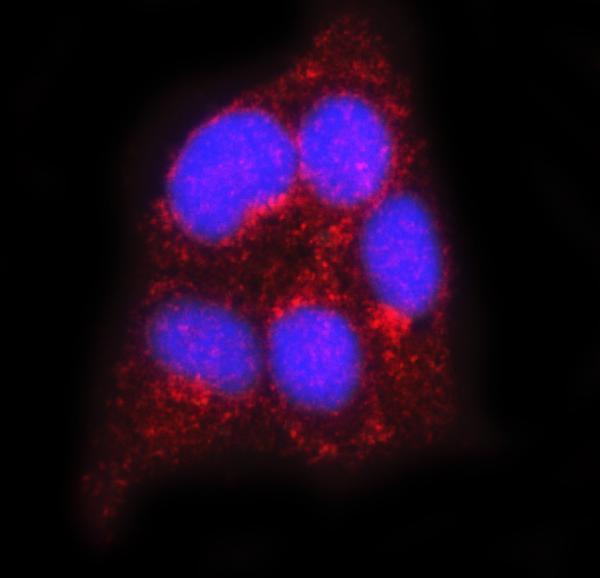
| IF/ICC Q: What should fluorescence show? | A: Mainly plasma-membrane signal with additional vesicular signal (HPA ICC-IF: both supported). ICC-IF is a separate application; use its own guide for assay setup. The tissue IHC profile describes broader cytoplasmic and membranous staining in paraffin sections (HPA tissue IHC). |
| Chromogenic detection background | Endogenous enzyme activity or nonspecific detection can add chromogen independently of the primary antibody (general IHC practice). Control this possibility before assigning diffuse or unexpected cell staining to FLOT2; HPA tissue staining levels do not identify the source of background in a new section (HPA tissue IHC; general IHC practice). |
| Situation | Likely cause | Next action |
|---|---|---|
| Expected High cells appear negative. | The intended cell population may be absent, or the IHC detection workflow may have failed (general IHC practice). | Target-specific fixation effects are not established by the supplied assay evidence. Verify with a matched IHC source before attributing a result to fixation. |
| Staining is predominantly nuclear. | The distribution conflicts with membrane, vesicular and cytoplasmic evidence (HPA ICC-IF; HPA tissue IHC; UniProt Q14254). | Inspect morphology and compare a known-positive section with a no-primary control. If nuclear signal persists without the expected pattern, treat target assignment as uncertain (general IHC practice). |
| Basal epidermis stains more strongly than suprabasal epidermis. | The apparent layer distribution conflicts with the reported skin pattern (UniProt Q14254 tissue specificity). | Recheck layer identification and staining controls. Investigate cross-reactivity or endogenous detection signal before interpreting basal staining as FLOT2 (general IHC practice). |
| Chromogen covers most of the section diffusely. | Nonspecific binding or endogenous detection activity can obscure cellular localisation (general IHC practice). | Compare with a no-primary control; review blocking, washing and detection conditions, then reassess whether membrane and cytoplasmic signal remains cell associated (general IHC practice; HPA tissue IHC: expected pattern). |
| A low-staining population shows intense, uniform signal. | The result differs from the reported low staining in, for example, skeletal-muscle myocytes or esophageal squamous epithelial cells (HPA tissue IHC). | Verify cell identity and compare a High reference population on the same run. Use detection controls to assess unexpected signal; HPA tissue profiles describe observed patterns, not a universal negative cutoff (HPA tissue IHC; general IHC practice). |
| The membrane outline is weak but intracellular staining is visible. | Cytoplasmic tissue staining and vesicular ICC-IF signal are documented, so a weak outline alone does not exclude FLOT2 (HPA tissue IHC; HPA ICC-IF). | Judge the cellular pattern against an identified High population and controls. Record membrane and cytoplasmic components separately rather than scoring the outline alone (HPA tissue IHC; general IHC practice). |


Comprehensive Human Protein Atlas IHC scoring per tissue (reliability: Supported — Medium consistency between antibody staining and RNA expression data.). Rows are taken directly from the HPA tissue chart — click any row's HPA link to view the source.
| Tissue | Cell type | Level | Evidence | Source |
|---|---|---|---|---|
| Appendix | Endocrine cells | High | Protein (IHC) | HPA → |
| Caudate | Glial cells | High | Protein (IHC) | HPA → |
| Cerebellum | Cells in molecular layer | High | Protein (IHC) | HPA → |
| Cerebral cortex | Neuronal cells | High | Protein (IHC) | HPA → |
| Colon | Endocrine cells | High | Protein (IHC) | HPA → |
| Tissue | Cell type | Level | Evidence | Source |
|---|---|---|---|---|
| None in HPA: FLOT2 is detected in all 45 scored tissues. Use a no-primary (secondary-only) and an isotype control instead. | ||||
Troubleshoot FLOT2 chromogenic IHC in paraffin sections using the catalog antibody’s documented staining conditions and expected localisation.
The catalog includes anti-FLOT2 antibodies with IHC images from human, mouse and rat paraffin sections and IF images from A431 and SiHa cells (catalog image captions).
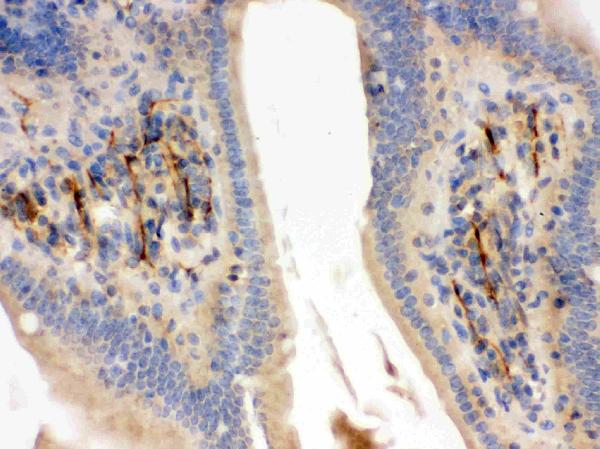
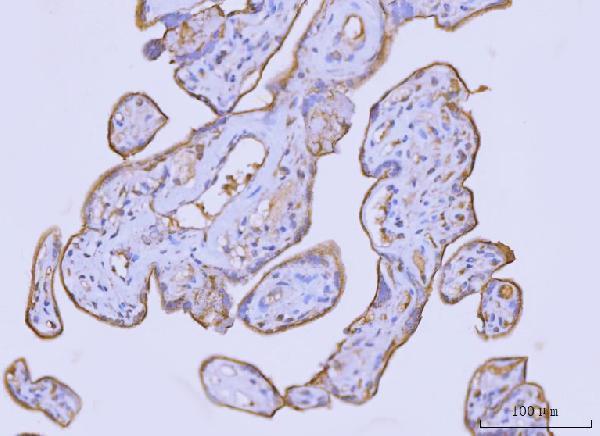
PB9623 has paraffin-section IHC images from human mammary cancer, mouse intestine and rat kidney, plus an A431 cell IF image (PB9623 image captions). M06107-2 has a human placenta paraffin-section IHC image and a SiHa cell IF image; its listed reactivity is human, mouse and rat (M06107-2 image captions; catalog reactivity).
Which to pick: For tissue IHC across human, mouse and rat, choose PB9623: its own paraffin-section captions document all three species with EDTA pH 8.0 retrieval (PB9623 IHC image captions). For IF/ICC, M06107-2 offers mouse monoclonal clone 4D8A3 and a SiHa cell IF example; PB9623 also lists IF/ICC and has an A431 cell IF example (catalog host, clone and applications; IF image captions). M06107-2’s tissue IHC caption documents human placenta with EDTA pH 8.0 retrieval; the fixative is unreported in both products’ IHC captions (M06107-2 and PB9623 IHC image captions).