This website uses cookies to ensure you get the best experience on our website.


- Table of Contents
Plan MSRA IHC-P using kidney tubules and bone marrow hematopoietic cells as tissues with medium staining (HPA tissue IHC). Start the IHC-validated antibody at 1:10–1:50 (datasheet: A04413-1 IHC-P), then assess cellular staining with chromogenic detection.

Expected localisation, validated protocols, controls and antibodies — the at-a-glance facts below, then the full design guide.
| Expected localisation | Mitochondrial matrix expected; tissue IHC compartment unassigned (UniProt) | |
| Staining pattern | Medium in kidney tubules and marrow cells (HPA tissue IHC) | |
| Antigen retrieval | Tris-EDTA pH 9.0 HIER, 95–98 °C, 20 min (rule: nuclear antigen) | |
| Positive control | Appendix+4 more · see all | |
| Negative control | Adipose tissue+4 more · see all |
| Fixation | Use formalin-fixed paraffin sections (selected-SKU IHC image A04413-1); Matched tissue-IHC evidence does not establish the fixation claim. Validate the specimen-specific method before use. (selected-SKU IHC image A04413-1) | |
| Caveat | Low staining–RNA consistency; splice discrepancy (HPA tissue IHC) | |
| Regulation | Kidney and liver RNA tissue enhanced (HPA tissue RNA) | |
| Isoform / epitope | 5 isoforms; N-terminal epitope coverage unknown (UniProt; datasheet: A04413-1) |
Compare the catalog antibody’s IHC-P protocol with published MSRA staining methods for rat skin (PMC6393874), aortic valves (PMC12972393), and paraffin tissue (PMC9391305).
| Sample | FFPE human hepatocarcinoma tissue (datasheet A04413-1) |
| Fixation | Image formalin-fixed; duration unreported (datasheet A04413-1); verify before use. |
| Sectioning | 4–5 µm sections on charged slides (standard) |
| Deparaffinisation | Xylene, graded ethanol series to water (standard) |
| Antigen retrieval | Heat-induced epitope retrieval in Tris-EDTA buffer, pH 9.0, 20 min at 95–98 °C (standard rule: nuclear antigen) |
| Peroxidase block | 3% H2O2, 10 min, room temperature (standard) |
| Blocking | 10% normal serum of the secondary host, 30 min, room temperature (standard) |
| Primary antibody | Rabbit anti-MSRA, 1:10-1:50 (datasheet A04413-1) |
| Primary incubation | Overnight at 4 °C (standard) |
| Detection | HRP-polymer secondary, DAB chromogen 5–10 min (standard) |
| Counterstain | Hematoxylin, blue, dehydrate and mount (standard) |
| Expected result | MSRA-positive staining in glandular cells of appendix (HPA tissue IHC: Medium). HPA tissue profile: Expression in several tissues, including bone marrow and kidney. No signal in the no-primary control. |
MSRA is annotated in the mitochondrial matrix, cytoplasm and nucleus, with no transmembrane segment (UniProt Q9UJ68). In tissue IHC, expect staining in kidney tubule cells, bone marrow hematopoietic cells and several glandular or respiratory epithelial populations (HPA tissue IHC: Medium). Treat these as guides to interpretation: HPA rates its tissue IHC evidence Approved but reports low consistency between antibody staining and RNA expression, with a possible splice or transcript discrepancy.
| Kidney tubule cells or bone marrow hematopoietic cells stain above adjacent background. | This fits the reported cell-level pattern (HPA tissue IHC: Medium in both populations). Cytoplasmic or nuclear staining can fit the annotated locations (UniProt Q9UJ68); a mitochondrial component is also plausible (UniProt Q9UJ68). Judge the stained cells against tissue structure, because a positive region alone does not show which cells contain the signal. |
| A sharp cell-surface outline dominates, with little intracellular staining. | Recheck specificity and detection before calling this the expected pattern. MSRA has no annotated transmembrane segment, although membrane is among its listed locations (UniProt Q9UJ68). HPA ICC-IF instead reports mainly nucleoplasmic and cytosolic signal (HPA subcellular: supported). A surface-dominant IHC result therefore needs corroboration; it is not, by itself, proof of an artefact. |
| Adipocytes stain strongly while the expected positive cells are weak or unstained. | Adipocytes are reported as Not detected, whereas kidney tubule cells and bone marrow hematopoietic cells are Medium (HPA tissue IHC). Consider cross-reactivity or endogenous detection activity, and compare the signal with controls processed using the same detection steps. HPA non-detection is a reference observation, not proof that every adipocyte sample must be negative. |
| Brown color spreads across cells and surrounding tissue without a clear cell pattern. | Diffuse background cannot establish MSRA localization. Check whether signal persists in a control omitting the primary antibody, then review blocking, washes and chromogen development as general IHC troubleshooting steps. Interpret any residual cell-specific signal cautiously because HPA reports low consistency between tissue staining and RNA expression (HPA tissue IHC: reliability note). |
| No convincing signal appears in kidney tubule cells or bone marrow hematopoietic cells. | These are useful reference populations because both were scored Medium (HPA tissue IHC). First verify tissue preservation, the detection run and antibody performance with an appropriate control. A negative run alone cannot establish absent MSRA: HPA flags staining–RNA inconsistency and a possible splice or transcript discrepancy (HPA tissue IHC: reliability note). |
| Tissue and cell choice | Kidney tubule cells and bone marrow hematopoietic cells offer reported Medium IHC reference patterns; adipocytes are reported Not detected (HPA tissue IHC). Compare the specified cells within each tissue, since a tissue-wide average can hide a cell-specific result. |
| Location evidence | UniProt places MSRA in mitochondria, cytoplasm and nucleus and annotates no transmembrane segment (UniProt Q9UJ68). HPA ICC-IF supports mainly nucleoplasm and cytosol (HPA subcellular). These sources support intracellular interpretation but do not establish a required chromogenic texture in paraffin sections. |
| Transcript variation and evidence limits | Five isoforms are listed (UniProt Q9UJ68). HPA notes low staining–RNA consistency and a possible splice or transcript discrepancy despite an Approved IHC reliability rating (HPA tissue IHC). Avoid treating disagreement between one stain and RNA data as a settled biological difference. |
| Mitochondrial processing | UniProt annotates a mitochondrial chain spanning residues 24–235 (UniProt Q9UJ68). This establishes processing in the record, but the supplied sources give no antibody epitope or isoform coverage; they cannot predict whether processing changes this IHC antibody's staining. |
| Antibody validation scope | HPA023804 and HPA075766 are Approved for IHC; HPA053069 has no listed IHC status (HPA antibodies). HPA's overall tissue IHC rating is Approved with a reliability caveat (HPA tissue IHC). Apply those statuses to the named antibodies only; no catalog antibody identity is supplied. |
| Situation | Likely cause | Next action |
|---|---|---|
| Expected positive cells are unstained. | The detection run, antibody conditions or section quality may be limiting; the supplied sources give no MSRA-specific retrieval setting. | Check an appropriate positive control and the detection reagents, then optimize retrieval and antibody dilution as general IHC practice. Use kidney tubule or bone marrow hematopoietic cells as reported Medium references (HPA tissue IHC), while retaining HPA's reliability caveat. |
| Color appears where the primary antibody was omitted. | A primary-independent detection contribution is possible; the observation does not identify MSRA. | Review endogenous enzyme blocking, secondary reagent behavior and chromogen development as general chromogenic IHC checks. Repeat with the same omission control and assess whether the cell-specific signal remains. |
| Adipocytes show prominent staining. | This conflicts with the reported Not detected adipocyte pattern (HPA tissue IHC); cross-reactivity or detection background is possible. | Inspect the omission control and compare cell-level staining with kidney tubule cells or bone marrow hematopoietic cells, reported Medium (HPA tissue IHC). Do not infer target abundance from chromogen intensity alone. |
| Only a crisp membrane rim is visible. | A surface-dominant pattern has limited support: MSRA has no transmembrane segment (UniProt Q9UJ68), while HPA ICC-IF mainly supports nucleoplasm and cytosol (HPA subcellular). | Check morphology and background controls, then seek independent antibody or localization evidence before assigning the rim to MSRA. UniProt also lists membrane localization, so the rim alone cannot settle specificity (UniProt Q9UJ68). |
| Tissue staining and RNA abundance disagree. | HPA explicitly reports low consistency and a possible splice or transcript discrepancy (HPA tissue IHC); UniProt lists five isoforms (UniProt Q9UJ68). | Report the stained cell population and the discordance separately. Confirm antibody identity and its IHC validation status before comparison; HPA lists IHC approval for HPA023804 and HPA075766 (HPA antibodies). |
| Can IF/ICC resolve an uncertain compartment? | Chromogenic tissue IHC may leave compartment boundaries ambiguous; HPA ICC-IF reports supported nucleoplasmic and cytosolic localization (HPA subcellular). | Use the separate IF/ICC guide for that application and compare its localization result with the IHC section. Treat the HPA ICC-IF pattern as supporting evidence, while retaining UniProt's mitochondrial annotation (UniProt Q9UJ68). |


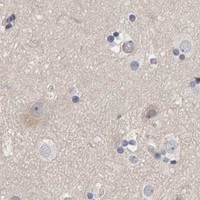


Comprehensive Human Protein Atlas IHC scoring per tissue (reliability: Approved — Low consistency between antibody staining and RNA expression data. Caution, Splice and/or transcript discrepancy exists.). Rows are taken directly from the HPA tissue chart — click any row's HPA link to view the source.
| Tissue | Cell type | Level | Evidence | Source |
|---|---|---|---|---|
| Appendix | Glandular cells | Medium | Protein (IHC) | HPA → |
| Bone marrow | Hematopoietic cells | Medium | Protein (IHC) | HPA → |
| Bronchus | Respiratory epithelial cells | Medium | Protein (IHC) | HPA → |
| Colon | Glandular cells | Medium | Protein (IHC) | HPA → |
| Duodenum | Glandular cells | Medium | Protein (IHC) | HPA → |
| Tissue | Cell type | Level | Evidence | Source |
|---|---|---|---|---|
| Adipose tissue | Adipocytes | Not detected | Protein (IHC) | HPA → |
| Caudate | Glial cells | Not detected | Protein (IHC) | HPA → |
| Cervix | Glandular cells | Not detected | Protein (IHC) | HPA → |
| Esophagus | Squamous epithelial cells | Not detected | Protein (IHC) | HPA → |
| Fallopian tube | Glandular cells | Not detected | Protein (IHC) | HPA → |
Use the IHC observations, MSRA localisation data and matched controls to troubleshoot chromogenic staining; interpret tissue patterns with the reported HPA consistency warning.
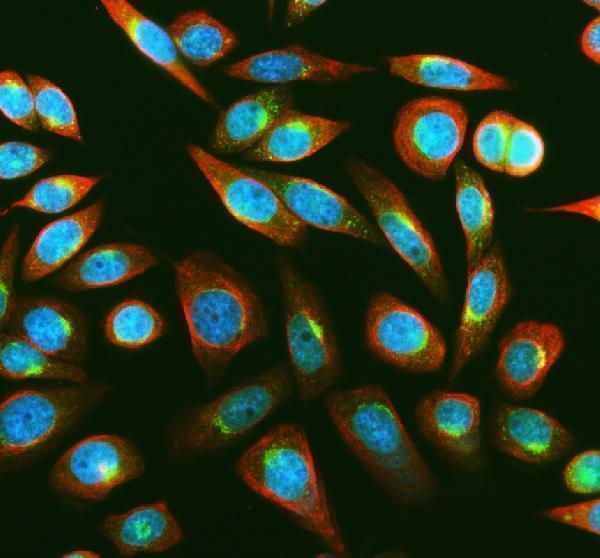
The catalog includes antibodies with IHC-P data in human hepatocarcinoma and IF/ICC data in SIHA cells; listed reactivity spans human, mouse, and rat (catalog image captions; catalog reactivity).
A04413-1 lists IHC-P and IF for human and mouse, with DAB IHC data from formalin-fixed, paraffin-embedded human hepatocarcinoma (catalog applications; catalog reactivity; A04413-1 image caption). A04413-2 lists IF/ICC for human, mouse, and rat, with IF data from SIHA cells (catalog applications; catalog reactivity; A04413-2 image caption).
Which to pick: Choose A04413-1 for tissue IHC: it lists IHC-P at 1:10–1:50, and its own DAB image documents formalin-fixed, paraffin-embedded human hepatocarcinoma (catalog applications; catalog dilution; A04413-1 image caption). Choose A04413-2 for IF/ICC when SIHA-cell data are useful; it lists 5 μg/ml for IF/ICC, while A04413-1 also lists IF, and both are rabbit polyclonals (A04413-2 image caption; catalog dilutions; catalog applications; catalog clonality). For rat samples, A04413-2 lists reactivity and IF/ICC, whereas A04413-1 lists human and mouse reactivity with IHC-P (catalog reactivity; catalog applications).