This website uses cookies to ensure you get the best experience on our website.


- Table of Contents
Plan ROCK2 chromogenic IHC on paraffin sections with the catalog antibody at 0.5–1 μg/mL (datasheet PB9387). Assess cytoplasmic staining against tissue controls, bearing in mind the low consistency between antibody staining and RNA expression (HPA tissue IHC).

Expected localisation, validated protocols, controls and antibodies — the at-a-glance facts below, then the full design guide.
| Expected localisation | Cytoplasmic staining in most tissues (HPA tissue IHC) | |
| Staining pattern | Cytoplasmic staining across most tissues (HPA tissue IHC) | |
| Antigen retrieval | EDTA pH 8.0 HIER, heat-mediated (datasheet PB9387) | |
| Positive control | Testis+4 more · see all | |
| Negative control | Adipose tissue+4 more · see all |
| Fixation | Keep fixation consistent across paraffin sections. (standard IHC practice; not target-specific) | |
| Caveat | Antibody staining and RNA show low consistency (HPA tissue IHC) | |
| Regulation | No expression regulator specified (UniProt) | |
| Isoform / epitope | No isoforms or processing annotated; epitope unmapped (UniProt) |
The catalog antibody’s IHC-P protocol (datasheet: PB9387) is accompanied by 3 published ROCK2 IHC protocols (PMC5513090; PMC6069530; PMC6372474).
| Sample | Paraffin-embedded Human Mammary Cancer tissue; fixative not specified (datasheet PB9387) |
| Fixation | Image fixative and duration unreported (datasheet PB9387); verify before use. |
| Sectioning | 4–5 µm sections on charged slides (standard) |
| Deparaffinisation | Xylene, graded ethanol series to water (standard) |
| Antigen retrieval | Heat retrieval: EDTA pH 8.0 (datasheet PB9387); 20 min, 95–100 °C (standard) |
| Peroxidase block | 3% H2O2, 10 min, room temperature (standard) |
| Blocking | 10% goat serum (datasheet PB9387) |
| Primary antibody | Rabbit anti-ROCK2, 0.5-1μg/ml (datasheet PB9387) |
| Primary incubation | Overnight at 4 °C (datasheet PB9387) |
| Detection | Streptavidin-biotin complex (SABC), DAB chromogen (datasheet PB9387) |
| Counterstain | Hematoxylin, blue, dehydrate and mount (standard) |
| Expected result | ROCK2-positive staining in leydig cells of testis (HPA tissue IHC: High). HPA tissue profile: Cytoplasmic expression in most tissues. No signal in the no-primary control. |
ROCK2 staining should be predominantly cytoplasmic across most tissues, with high staining in testicular Leydig cells and medium staining in several epithelial and neuronal cell populations (HPA tissue IHC). ROCK2 has no transmembrane segment, although UniProt also lists membrane, nuclear, and cytoskeletal associations (UniProt O75116 topology and subcellular location). Interpret tissue patterns cautiously: HPA rates its IHC profile Approved but reports low consistency with RNA expression (HPA tissue IHC).
| Leydig cells show strong cytoplasmic chromogen, with surrounding structures distinguishable. | This matches the clearest supplied positive reference: high Leydig cell staining in testis (HPA tissue IHC). Compare intensity within identified cells rather than calling an entire section uniformly positive (standard IHC practice). |
| Neuronal cells in cerebral cortex or glandular cells in appendix show moderate cytoplasmic staining. | These are medium examples, consistent with HPA’s broad cytoplasmic profile (HPA tissue IHC). A weaker result than the Leydig cell reference can therefore be expected without implying assay failure (HPA tissue IHC). |
| Signal is confined to nuclei or outlines every cell membrane, with little cytoplasmic staining. | Question the pattern against HPA’s cytoplasmic tissue profile (HPA tissue IHC). UniProt lists nuclear and membrane associations, so those compartments alone do not prove artefact; check whether the cell distribution and controls support the result (UniProt O75116 subcellular location; standard IHC practice). |
| Prominent staining appears in adipocytes or cardiomyocytes, which are listed as undetected. | Consider cross-reactivity or endogenous detection activity, and examine negative controls (HPA tissue IHC; standard IHC practice). HPA’s not detected calls describe those specific cells; they do not make the entire adipose or heart section a universal negative control (HPA tissue IHC). |
| Weak chromogen covers tissue and empty areas, or a known-positive Leydig cell section has no signal. | Diffuse background weakens confidence in cellular localisation; absence of the high reference calls for a control and workflow review (standard IHC practice; HPA tissue IHC). Neither observation alone establishes ROCK2 absence or a target-specific fixation effect (standard IHC practice). |
| Tissue and cell choice | Use Leydig cells as a high reference and, if useful, appendix glandular or cerebral cortex neuronal cells as medium comparators (HPA tissue IHC). Score the named cell population, since the listed levels do not describe every cell in a tissue (HPA tissue IHC). |
| Compartment and protein topology | Expect a mainly cytoplasmic IHC pattern (HPA tissue IHC). ROCK2 lacks a transmembrane segment, yet UniProt records plasma membrane, actin-associated, and nuclear localisation; isolated membrane or nuclear signal needs contextual review rather than automatic acceptance or rejection (UniProt O75116 topology and subcellular location). |
| Antibody validation and tissue concordance | HPA lists HPA007459 and CAB008666 as IHC Approved, while its tissue profile notes low staining-to-RNA consistency (HPA antibodies; HPA tissue IHC). Approval supports use as a reference point, but discordant cellular patterns still warrant controls (HPA tissue IHC; standard IHC practice). |
| Processing and epitope interpretation | UniProt lists one 1–1388 chain, no signal peptide or propeptide, and no glycosylation sites (UniProt O75116 processing and glycosylation). The payload gives no epitope position or target-specific fixation sensitivity, so it cannot predict a retrieval setting or processing-dependent pattern. |
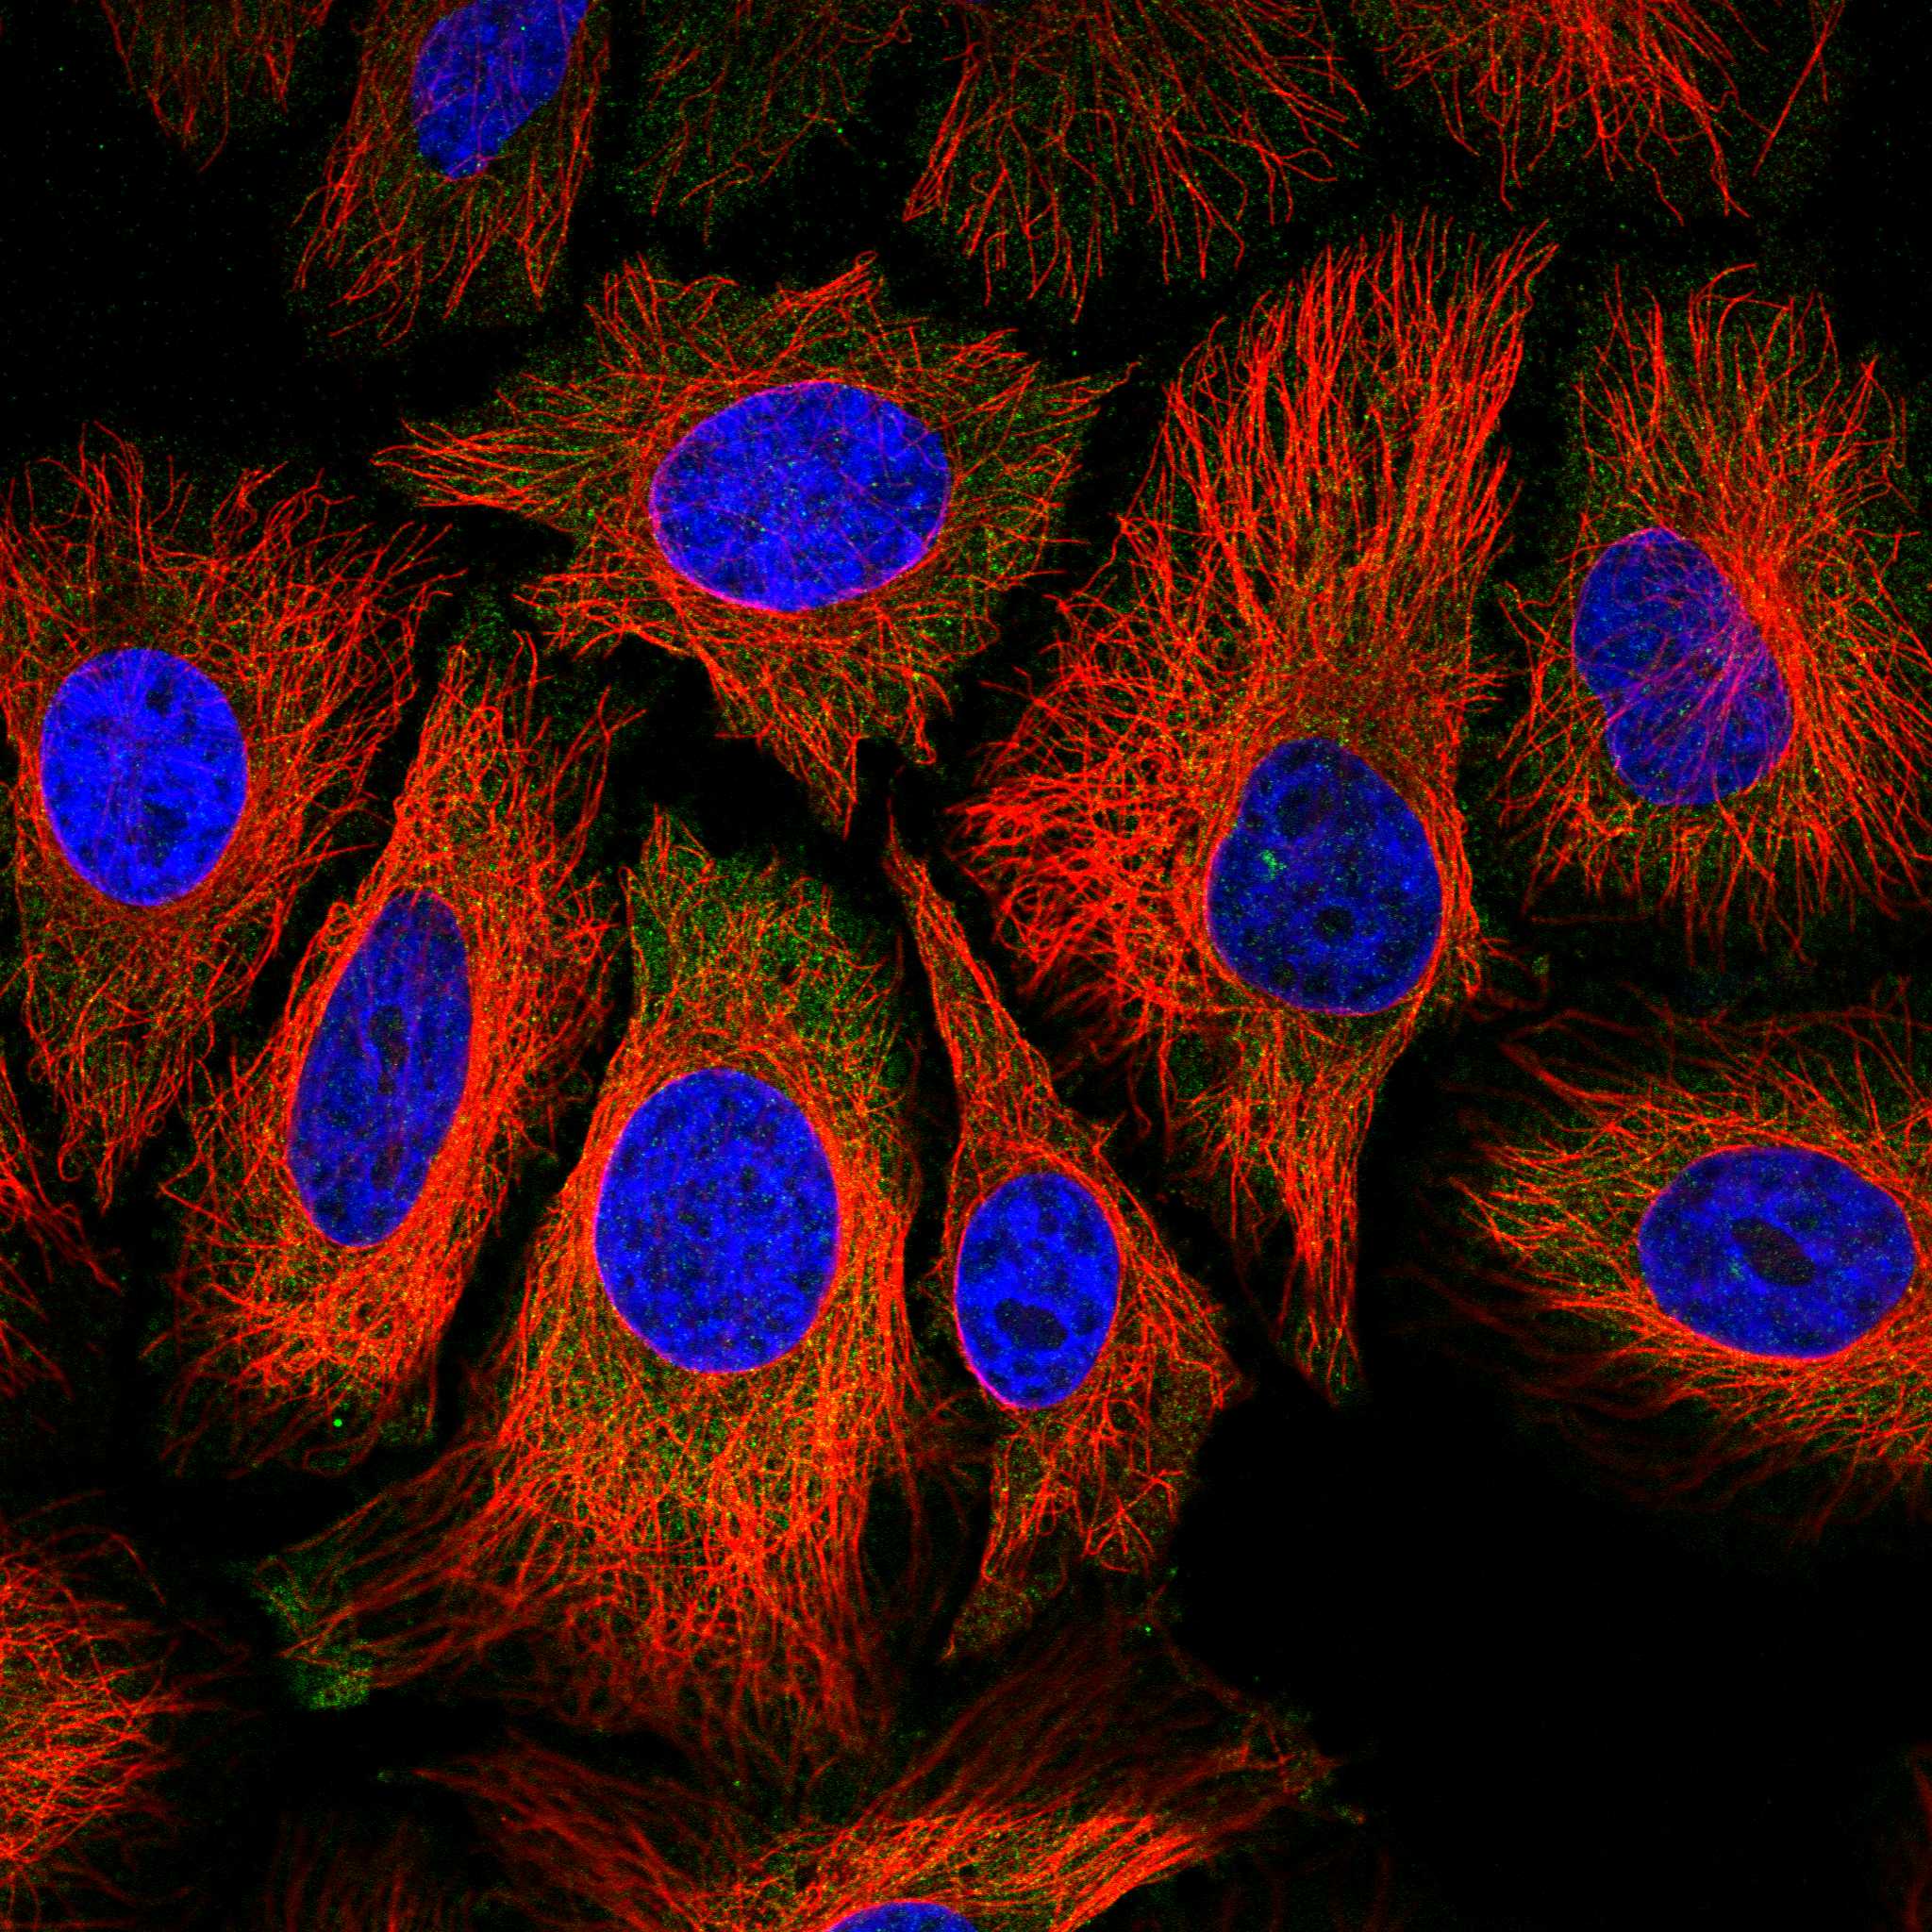
| IF/ICC cross-check | Q: What should IF/ICC show? A: Predominantly cytosolic ROCK2; HPA marks that location Supported and lists HPA044109 as ICC Supported (HPA subcellular; HPA antibodies). Use this as a localisation comparison, not an IHC intensity standard (HPA subcellular; HPA tissue IHC). |
| Situation | Likely cause | Next action |
|---|---|---|
| No staining in Leydig cells of a testis positive control. | The expected high reference is missing (HPA tissue IHC); the slide alone cannot identify the failed step (standard IHC practice). | Check that the intended cells are present, then review primary antibody use, retrieval, detection reagents, and control slide performance (standard IHC practice). Do not infer ROCK2 absence from this run. |
| All compartments show a diffuse brown haze. | Non-specific antibody or detection background can obscure a cellular pattern (standard IHC practice). | Inspect the no-primary control; review blocking, washes, primary antibody concentration, and chromogen development against the kit instructions (standard IHC practice). Reassess cytoplasmic localisation after background is controlled (HPA tissue IHC). |
| Brown deposits persist in a no-primary control. | Endogenous detection activity or a detection-reagent problem may contribute signal independently of the primary antibody (standard IHC practice). | Check the detection chemistry and its matching endogenous-activity block, then repeat the control alongside the test slide (standard IHC practice). |
| Adipocytes or cardiomyocytes stain strongly despite the expected negative reference. | HPA lists these cells as not detected; cross-reactivity or endogenous detection activity is possible, though HPA reports low tissue-profile concordance (HPA tissue IHC; standard IHC practice). | Confirm cell identity and compare a no-primary control and a listed positive cell population in the same run (standard IHC practice; HPA tissue IHC). Treat disagreement as unresolved until controls clarify it. |
| Only nuclei or continuous membrane rims stain across many cell types. | That distribution departs from HPA’s predominantly cytoplasmic tissue pattern, although UniProt permits nuclear and membrane association (HPA tissue IHC; UniProt O75116 subcellular location). | Review counterstain and morphology, compare the listed positive cells, and check the no-primary control before scoring compartment-specific staining (standard IHC practice; HPA tissue IHC). |
| A medium-reference tissue looks weaker than the Leydig cell control. | Different reported levels are expected: Leydig cells are high, while appendix glandular and cerebral cortex neuronal cells are medium (HPA tissue IHC). | Score intensity in the specified cell types with the same run’s controls (standard IHC practice). Investigate only if the positive control fails or the expected cellular pattern is lost (HPA tissue IHC; standard IHC practice). |


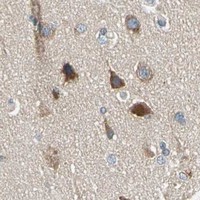

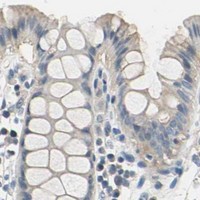

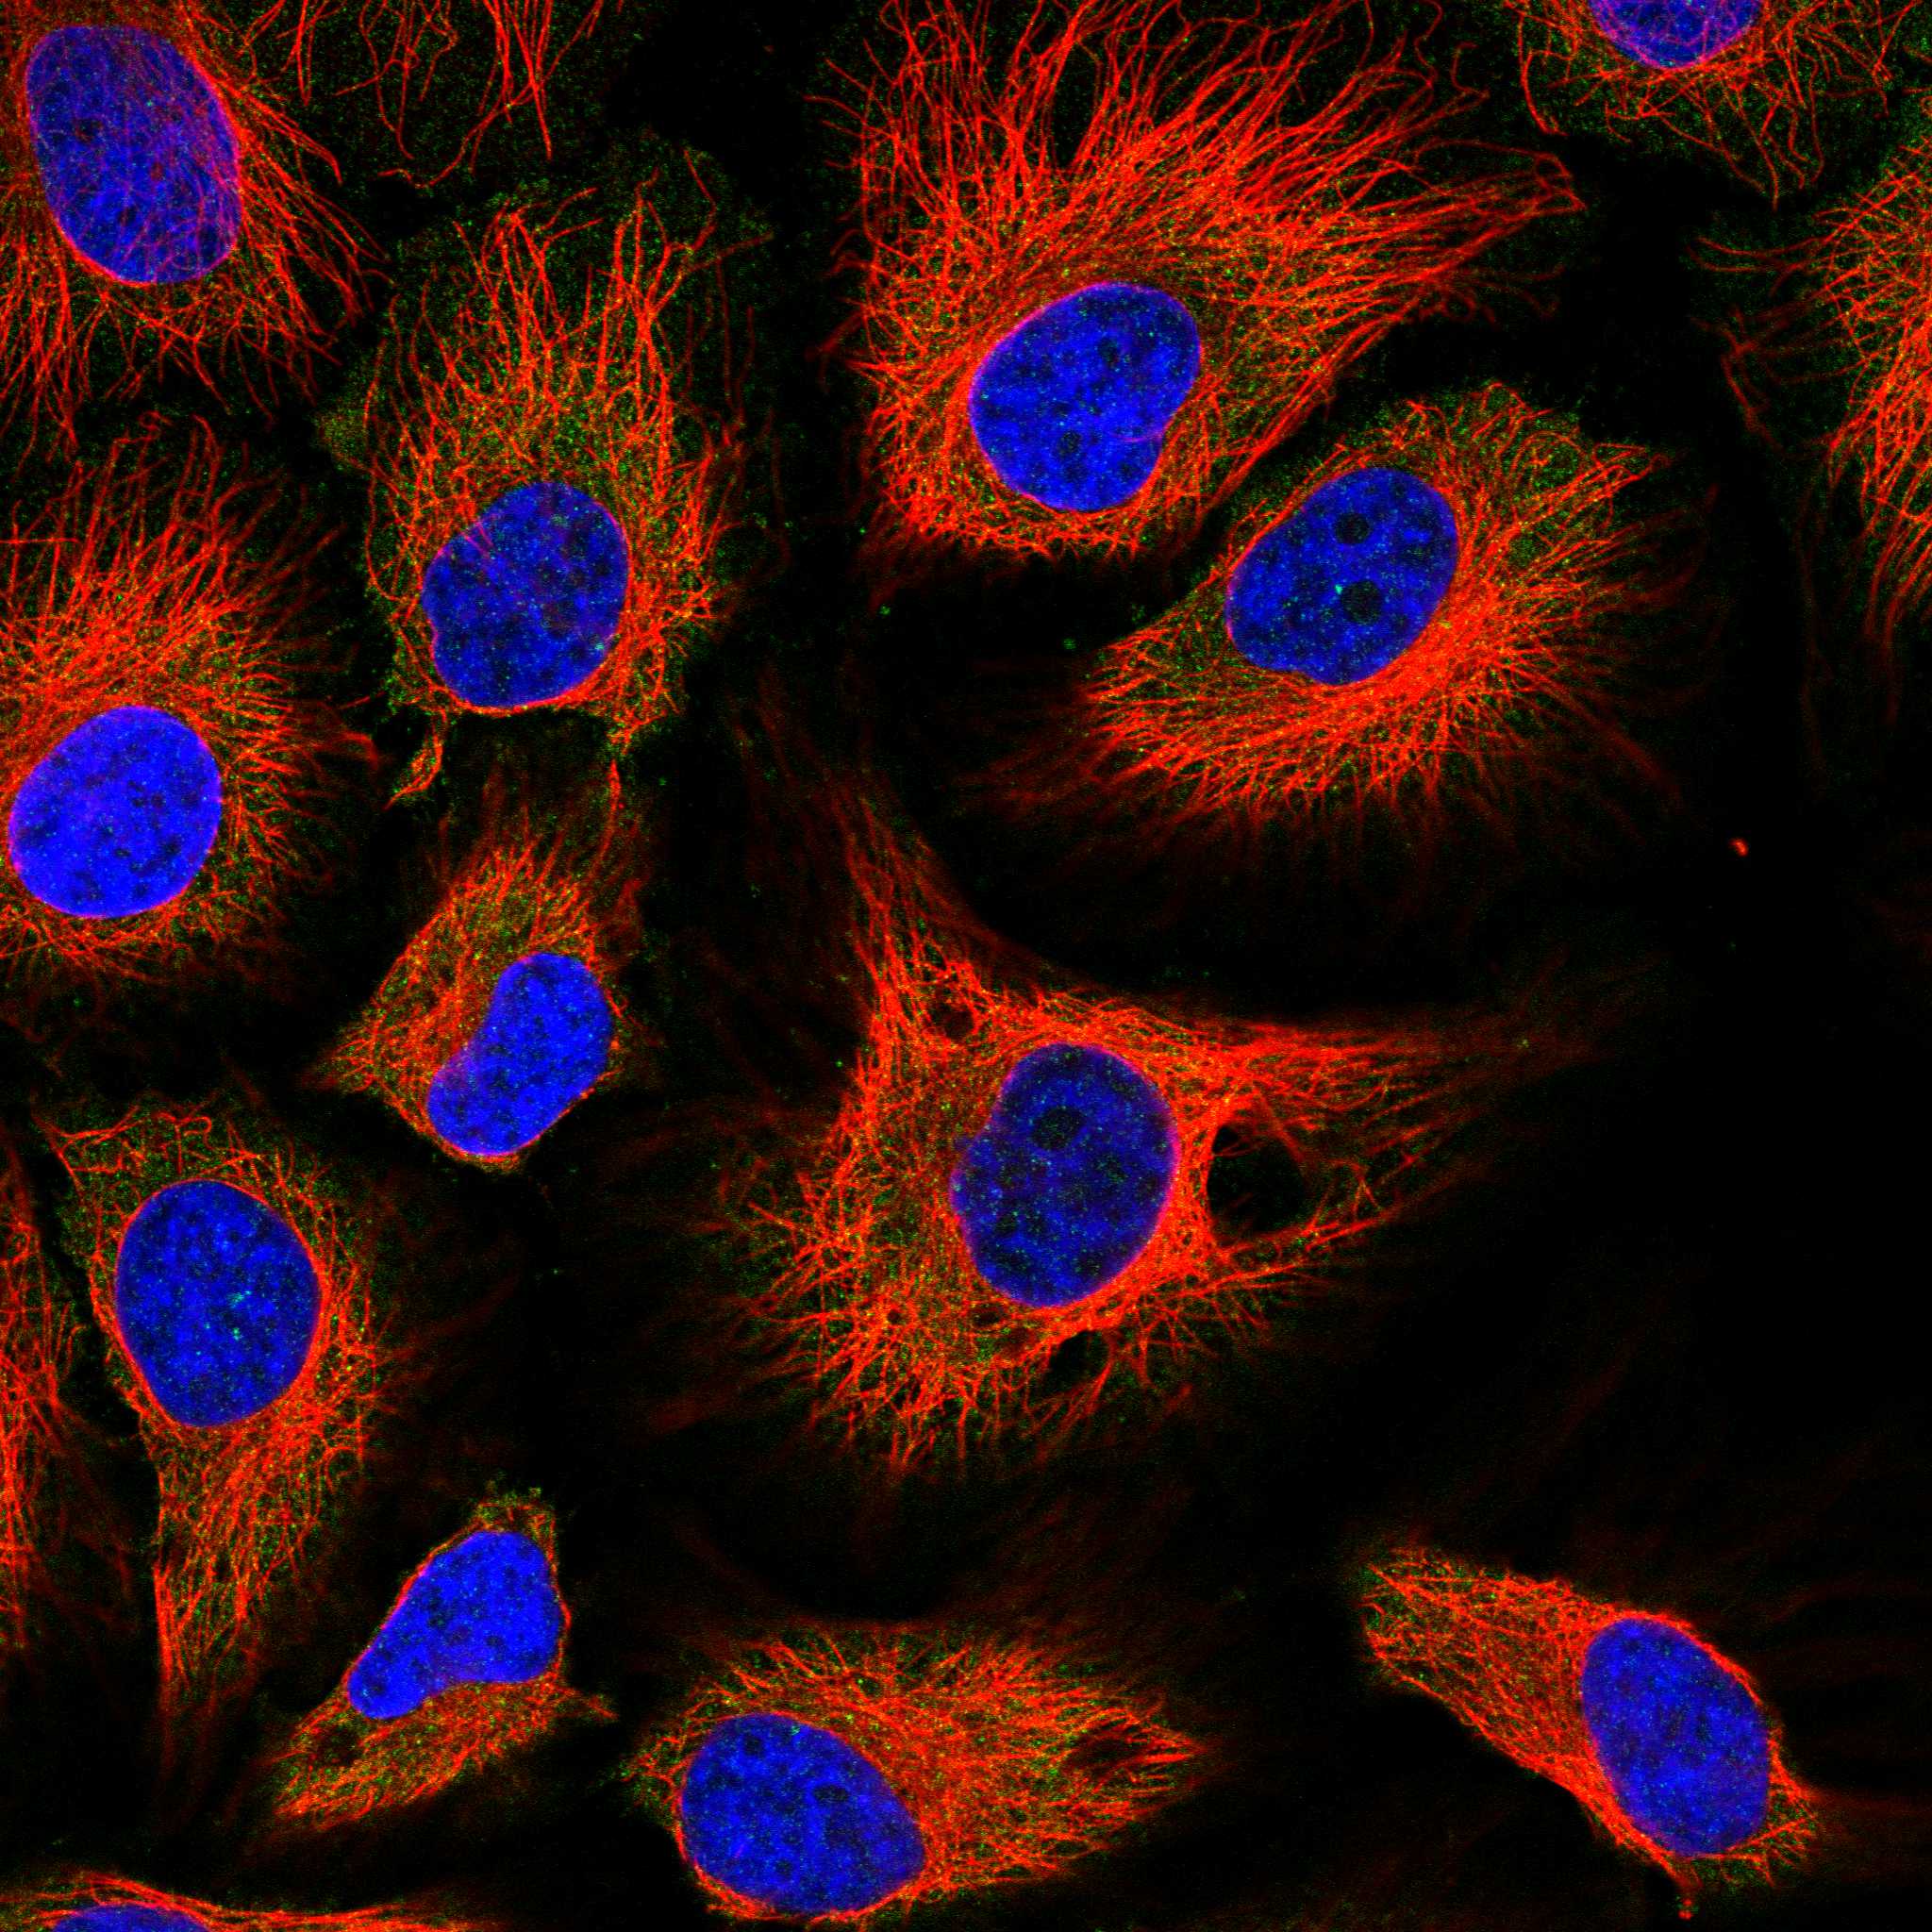
Comprehensive Human Protein Atlas IHC scoring per tissue (reliability: Approved — Low consistency between antibody staining and RNA expression data.). Rows are taken directly from the HPA tissue chart — click any row's HPA link to view the source.
| Tissue | Cell type | Level | Evidence | Source |
|---|---|---|---|---|
| Testis | Leydig cells | High | Protein (IHC) | HPA → |
| Appendix | Glandular cells | Medium | Protein (IHC) | HPA → |
| Bone marrow | Hematopoietic cells | Medium | Protein (IHC) | HPA → |
| Breast | Glandular cells | Medium | Protein (IHC) | HPA → |
| Bronchus | Respiratory epithelial cells | Medium | Protein (IHC) | HPA → |
| Tissue | Cell type | Level | Evidence | Source |
|---|---|---|---|---|
| Adipose tissue | Adipocytes | Not detected | Protein (IHC) | HPA → |
| Heart muscle | Cardiomyocytes | Not detected | Protein (IHC) | HPA → |
| Kidney | Cells in glomeruli | Not detected | Protein (IHC) | HPA → |
| Liver | Cholangiocytes | Not detected | Protein (IHC) | HPA → |
| Oral mucosa | Squamous epithelial cells | Not detected | Protein (IHC) | HPA → |
Troubleshoot ROCK2 staining in paraffin sections by checking retrieval, compartment, controls and cell-specific scoring before interpreting chromogenic signal.
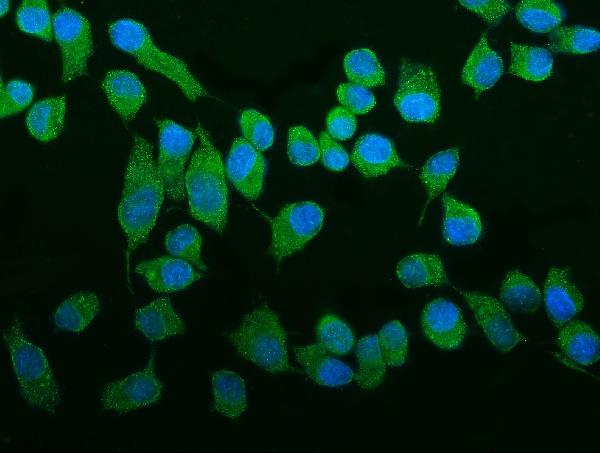
Anti-ROCK2 antibodies have IHC images from human mammary cancer, mouse cardiac muscle, and rat brain paraffin sections (PB9387 image captions), and an IF/ICC image from Hep cells (A01023-1 image caption).
PB9387 is listed for IHC and has paraffin-section images from human mammary cancer, mouse cardiac muscle, and rat brain (PB9387 applications and image captions). A01023-1 is listed for IF/ICC and has an image from Hep cells (A01023-1 applications and image caption).
Which to pick: Choose PB9387 for tissue IHC: its paraffin-section images use heat retrieval in EDTA at pH 8.0 and 1 μg/ml primary antibody, while the fixative is unreported (PB9387 image captions). Choose A01023-1 for IF/ICC: its Hep-cell image uses 5 μg/ml primary antibody; its fixative is unreported (A01023-1 image caption). For IHC across species, PB9387 has image evidence in human, mouse, and rat tissue; A01023-1 lists the same species as reactive, but its supplied image demonstrates IF/ICC in Hep cells (PB9387 image captions; A01023-1 reactivity and image caption).