This website uses cookies to ensure you get the best experience on our website.


- Table of Contents
Why outer wells read high or low, how to recognize positional bias, and what to change before the next plate.
You finish an ELISA, review the optical density values, and notice that the outer wells do not behave like the center. Rows A and H may read higher, columns 1 and 12 may read lower, or the four corner wells may show the largest shift. The immediate question is whether the result reflects biology, evaporation, temperature, washing, dispensing order, or another plate-related artifact.
This position-dependent variation is commonly called the ELISA edge effect. It is not defined by one direction of change: outer wells can read either higher or lower than inner wells. The more useful clue is a repeatable spatial pattern that follows well position rather than sample identity. This guide explains how to recognize that pattern, distinguish it from other artifacts, test likely causes, design diagnostic plate maps, and reduce its impact on ELISA data.
Quick Answer
An ELISA edge effect is a systematic difference between peripheral and central wells. A complete outer ring, stronger corner deviations, or a repeatable edge-to-center gradient supports positional bias. High or low OD alone does not identify the cause; review the plate pattern and confirm it with controlled QC placement.
The clearest way to recognize an edge effect is to map raw OD values to their physical well positions before relying on calculated concentrations. Typical signs include:
The direction can vary by assay. Some plates show a high-OD perimeter, while others show lower edge values. Position dependence and reproducibility are more informative than the direction of the shift.
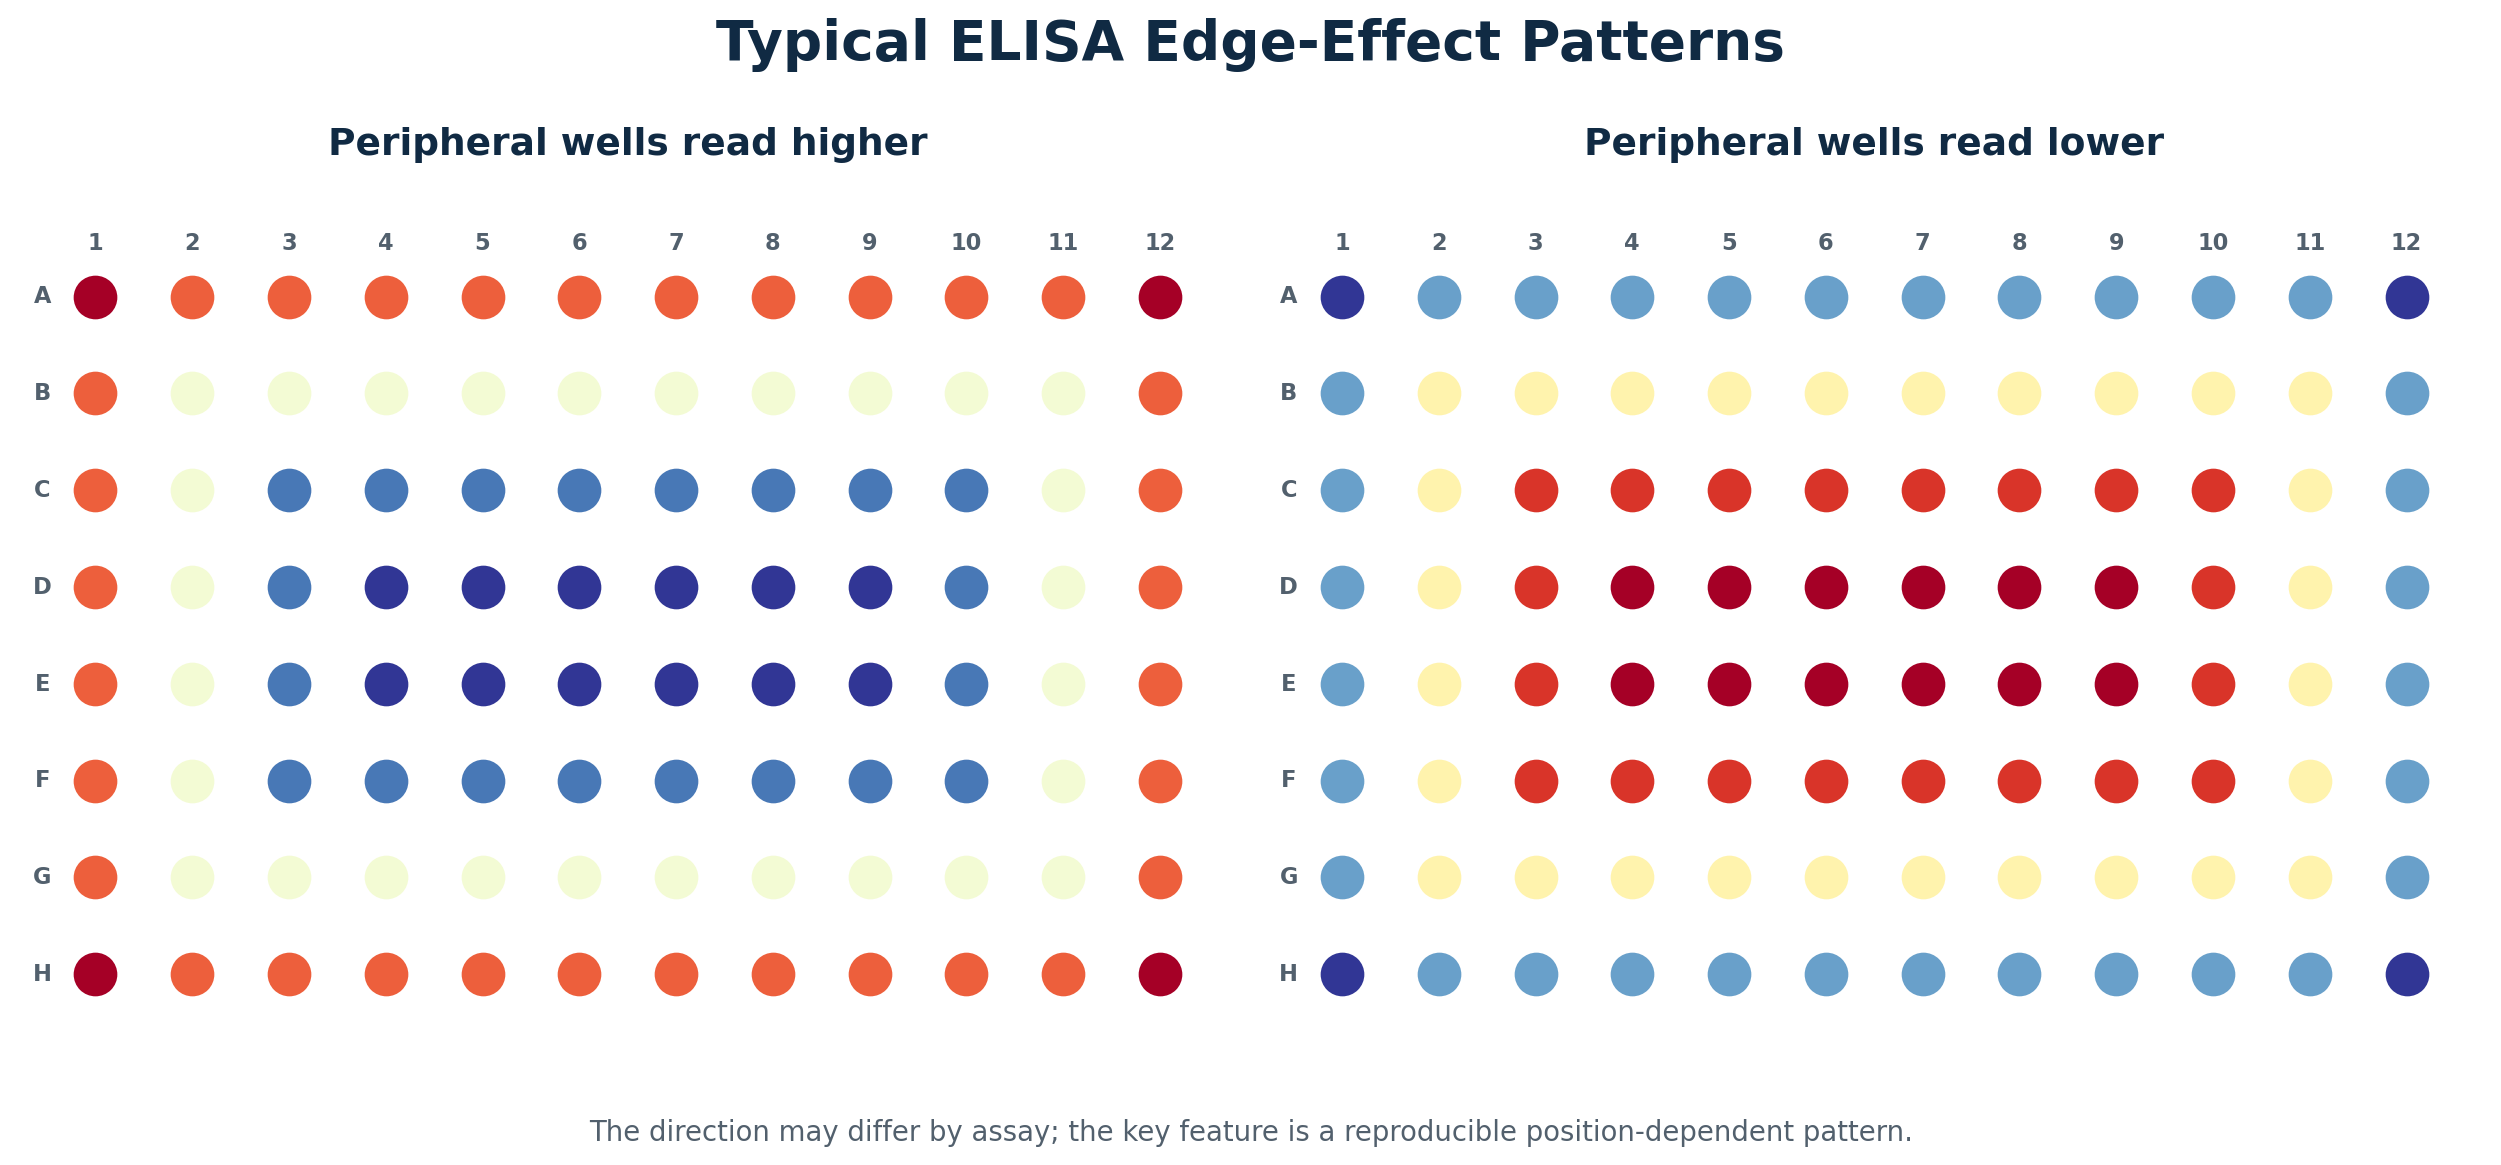
Figure 1. Typical high- and low-perimeter edge-effect patterns. The exact direction is assay-dependent; the diagnostic feature is a reproducible relationship with plate position.
Not every abnormal outer well is a classic edge effect. The spatial pattern often points to the step that should be investigated first.
| Pattern on the plate | More likely explanation |
|---|---|
| Complete perimeter ring, often strongest at corners | Temperature, evaporation, sealing, or plate-position effects |
| One side of the plate differs | Directional environmental exposure, incomplete sealing, or reader-related bias |
| Gradual left-to-right or top-to-bottom change | Dispensing, substrate, stop-solution, or reading-time drift |
| One entire row or column differs | Multichannel pipette or plate-washer issue |
| Irregular local cluster | Contamination, bubbles, splashing, or local washing problem |
| Scattered isolated wells | Pipetting error, bubbles, or particulate material |
| Same experimental group differs after randomized placement | Biological variation becomes more plausible |
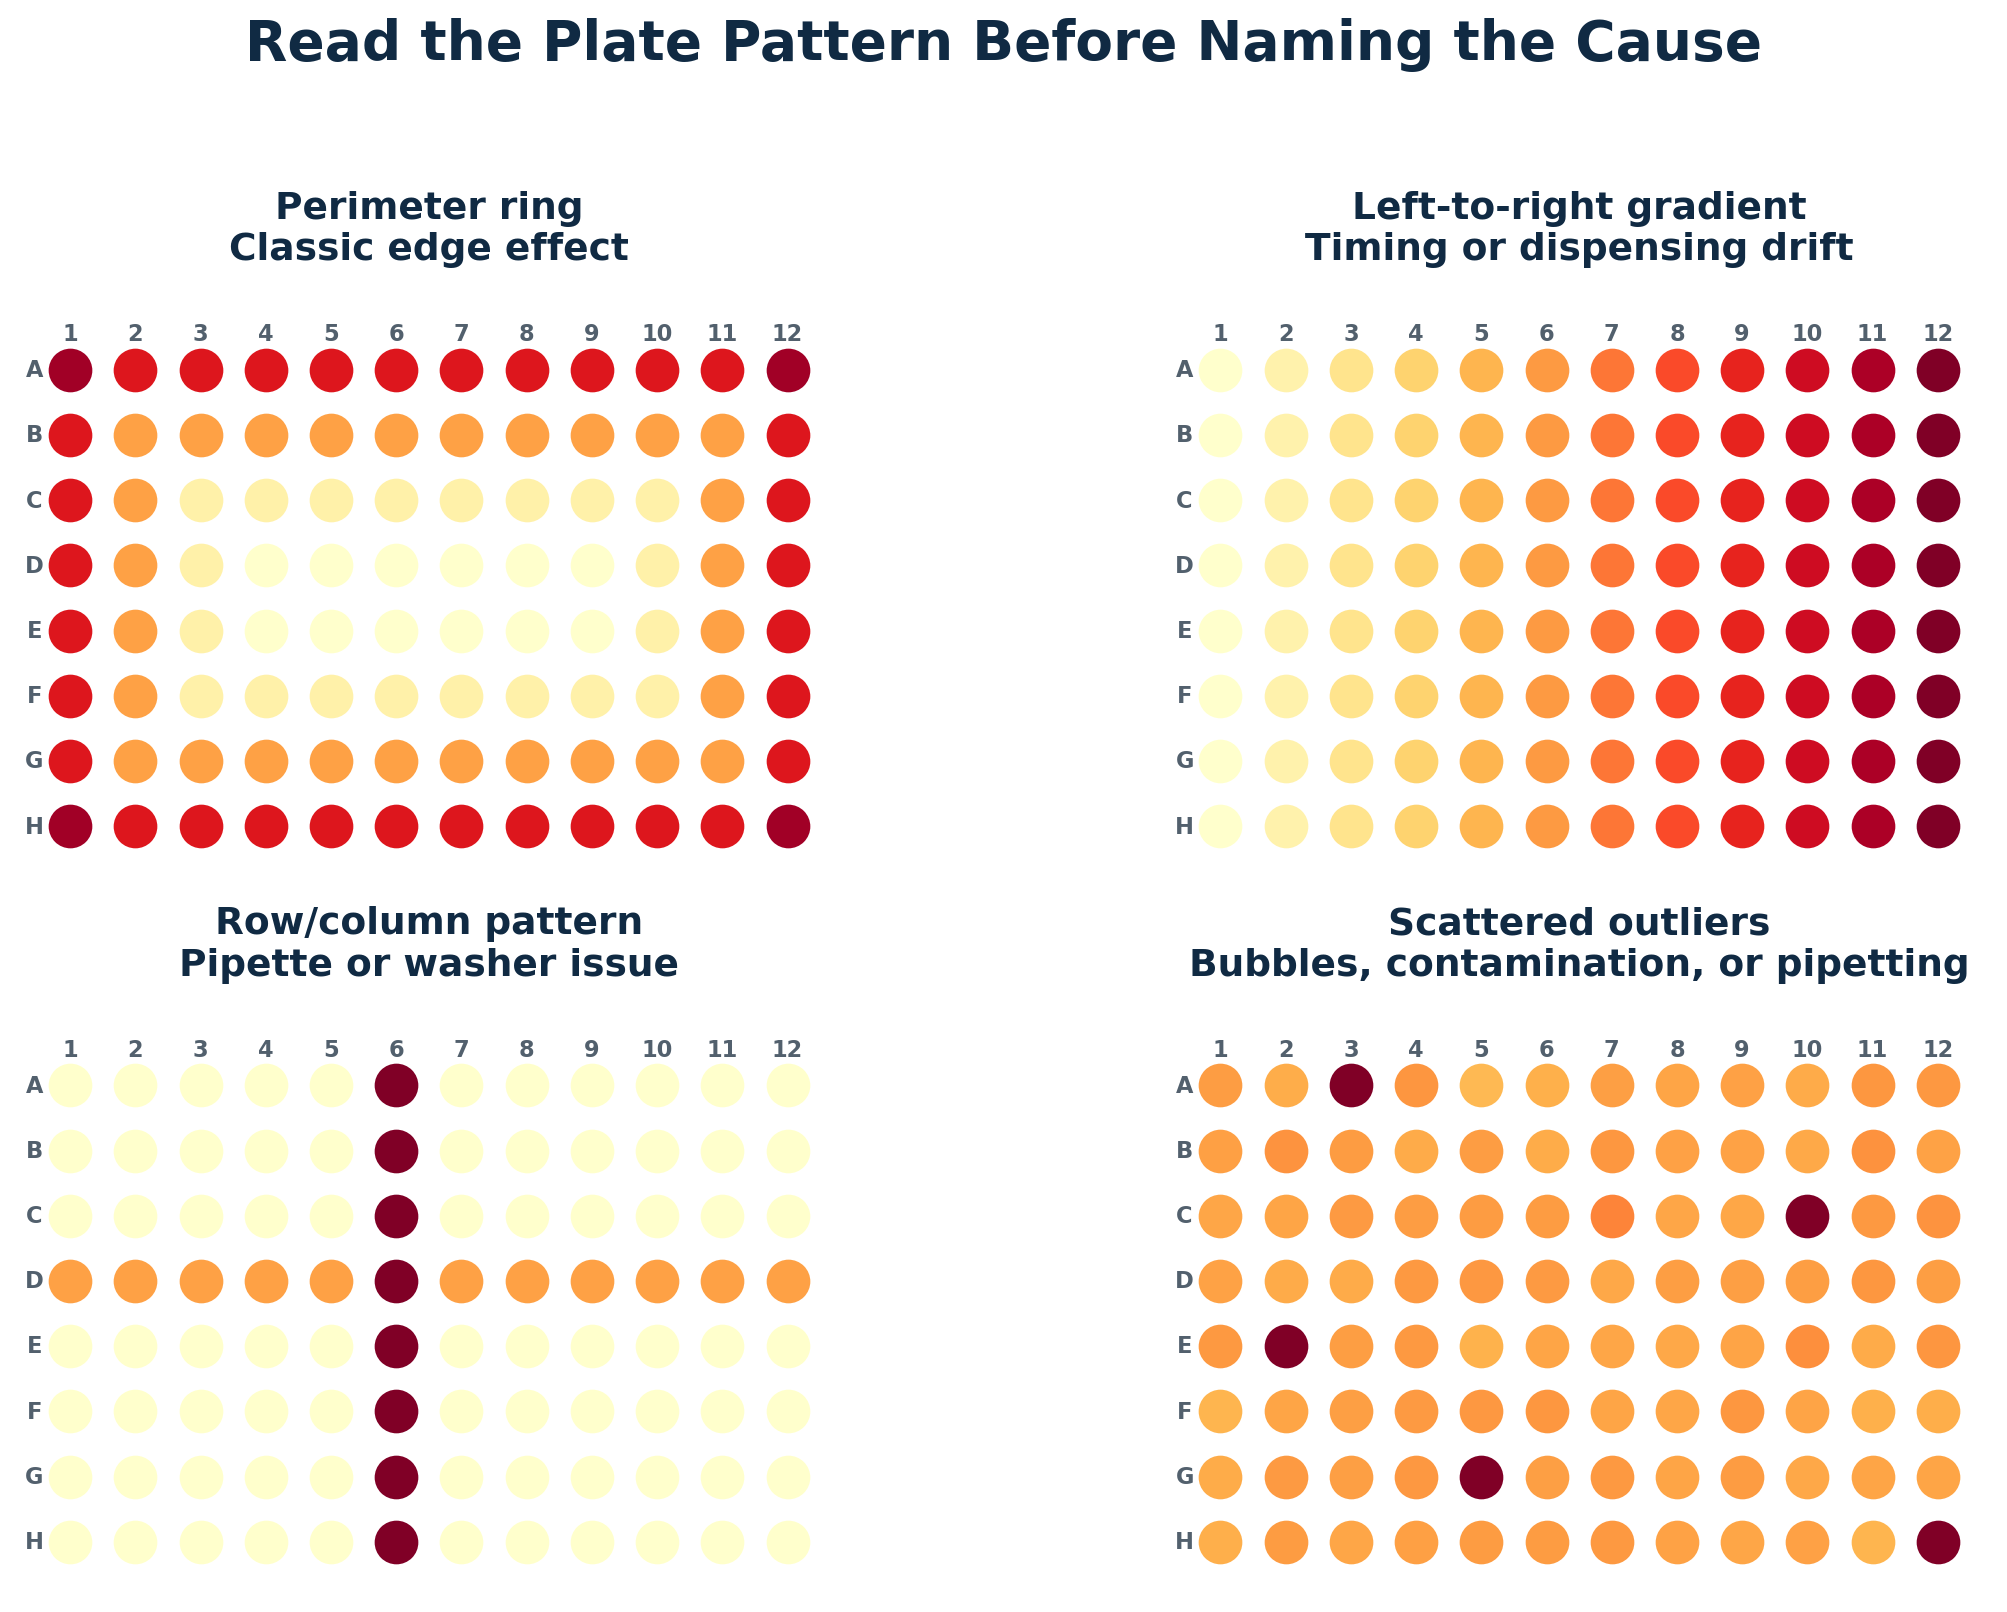
Figure 2. Four common plate patterns. A perimeter ring is different from directional timing drift, row/column artifacts, and scattered outliers.
For a broader checklist covering weak signal, high background, poor replicates, and inconsistent runs, use Boster Bio’s ELISA troubleshooting guide.
Several mechanisms can act at the same time. The dominant factor depends on assay format, incubation conditions, sealing, plate material, washing, and the stage at which the pattern develops.


ELISA (Enzyme-Linked Immunosorbent Assay) remains one of the most widely used methods for protein quantification in immunology, oncology, neuroscience, biomarker discovery, and translational research. Researchers use ELISA to measure cytokines, chemokines, growth factors, hormones, signaling proteins, and disease biomarkers across a wide range of sample types. The accuracy and reliability of these assays often depend on well-validated elisa antibody pairs, which are designed to specifically capture and detect target proteins with high sensitivity and specificity.
However, choosing an ELISA kit is often more complicated than selecting the target protein alone.
Two ELISA kits for the same analyte may differ significantly in:
These differences...

Dilution ratio describes a simple dilution – a unit volume of solute (or sample) is combined with a desired unit volume of solvent (or diluent), to reach a desired total volume (Vsolute + Vsolvent = Total Vsolution)
Thus, a dilution ratio of 1:4 describes 1 part solute + 4 parts solvent = 5 parts total. The sum of both solute plus solvent equals total, f...


ELISA results can look “clean”—tight duplicates and a smooth standard curve—and still be misleading. In practice, the most common failure is not pipetting technique, but controls that do not isolate the specific failure mode (system background, non-specific binding, matrix interference, or out-of-range samples). If you want a broader setup framework before drilling into controls, Boster’s ELISA experimental design checklist is a useful companion read.
This post focuses on four controls that most reliably de-risk interpretation:

ELISA can be deceptively “clean.” The standard curve looks smooth, duplicates are close, and the plate reads without errors—yet the final concentrations don’t make biological sense, shift between runs, or fail to reproduce across days or operators.
In most cases, the issue isn’t pipetting skill. It’s experimental design: missing controls, standards that don’t match the sample range, dilution choices made without a quick pre-check, or plate reading/recording steps that ar
...