Click image to see more details
-

-
-
-
-
+29
Product Info Summary
| SKU: | PA1080 |
|---|---|
| Size: | 100 μg/vial |
| Reactive Species: | Human, Mouse, Rat |
| Host: | Rabbit |
| Application: | IHC, WB |
Customers Who Bought This Also Bought

Product info
Product Name
Anti-VEGF/VEGFA Antibody Picoband®
SKU/Catalog Number
PA1080
BA0407 is an alternative SKU for this antibody, used in previous lots.
Size
100 μg/vial
Form
Lyophilized
Description
Boster Bio Anti-VEGF/VEGFA Antibody catalog # PA1080. Tested in IHC, WB applications. This antibody reacts with Human, Mouse, Rat. The brand Picoband indicates this is a premium antibody that guarantees superior quality, high affinity, and strong signals with minimal background in Western blot applications. Only our best-performing antibodies are designated as Picoband, ensuring unmatched performance.
Storage & Handling
Store at -20˚C for one year from date of receipt. After reconstitution, at 4˚C for one month. It can also be aliquotted and stored frozen at -20˚C for six months. Avoid repeated freeze-thaw cycles.
Cite This Product
Anti-VEGF/VEGFA Antibody Picoband® (Boster Biological Technology, Pleasanton CA, USA, Catalog # PA1080)
Host
Rabbit
Contents
Each vial contains antibody formulated with stabilizing components, 0.9mg NaCl, 0.2mg Na2HPO4, 0.01mg NaN3.
*This antibody is supplied in a stabilized formulation.
Compatibility with conjugation reactions depends on the chemistry of the conjugation method used.
For conjugation methods that are not compatible with the stabilizing components present in this formulation, a carrier-free antibody format is required.
Clonality
Polyclonal
Isotype
Rabbit IgG
Immunogen
A synthetic peptide corresponding to a sequence at the N-terminus of human VEGF, identical to the related mouse and rat sequences.
Cross-reactivity
No cross-reactivity with other proteins
Reactive Species
PA1080 is reactive to VEGFA in Human, Mouse, Rat
Observed Molecular Weight
27 kDa
Calculated molecular weight
27.0 kDa
Background of VEGFA
VEGF, a homodimeric glycoprotein of relative molecular mass 45,000, is the only mitogen that specifically acts on endothelial cells. It may be a major regulator of tumor angiogenesis in vivo. Vascular endothelial growth factor is a mitogen primarily for vascular endothelial cells. It is, however, structurally related to platelet-derived growth factor. VEGF shares homology with the PDGF A chain and B chain, including conservation of all 8 cysteines found in PDGFA and PDGFB. VEGF gene contains 8 exons. Vascular endothelial growth factor (VEGF) induces remodeling and enhances TH2-mediated sensitization and inflammation in the lung. VEGF regulates haematopoietic stem cell survival by an internal autocrine loop mechanism. Vascular endothelial growth factor (VEGF) stimulates neurogenesis in vitro and in vivo.
Antibody Validation
Boster validates all antibodies on WB, IHC, ICC, Immunofluorescence, and ELISA with known positive control and negative samples to ensure specificity and high affinity, including thorough antibody incubations.
Application & Images
Applications
PA1080 is guaranteed for IHC, WB Boster Guarantee
Recommend Dilution
| Application | Dilution | Species |
|---|---|---|
| Western blot | 0.1-0.5μg/ml | Human, Mouse, Rat |
| Immunohistochemistry (Paraffin-embedded Section) | 2-5μg/ml | Human |
Tested application
Suggested blocking solution with 5% non-fat milk or BSA; (*)Recommended protein loading: 20-40 µg per lane
Validation Images & Assay Conditions
Click image to see more details
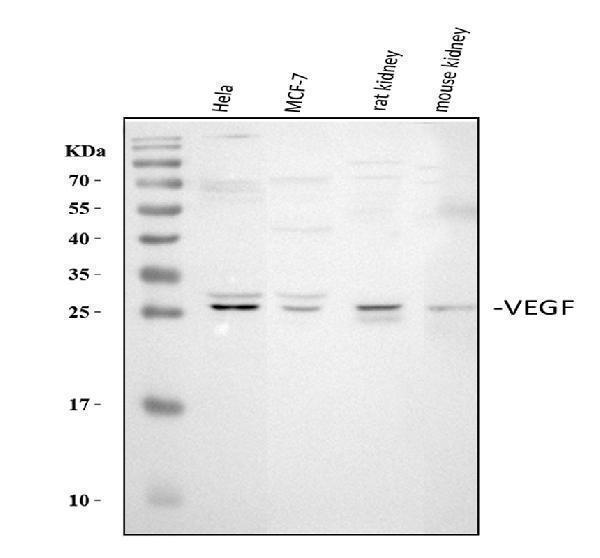
Western blot analysis of VEGFA using anti-VEGFA antibody (PA1080).
Electrophoresis was performed on a 5-20% SDS-PAGE gel at 70V (Stacking gel) / 90V (Resolving gel) for 2-3 hours. The sample well of each lane was loaded with 30 ug of sample under reducing conditions.
Lane 1: human Hela whole cell lysates,
Lane 2: human MCF-7 whole cell lysates,
Lane 3: rat kidney tissue lysates,
Lane 4: mouse kidney tissue lysates.
After electrophoresis, proteins were transferred to a nitrocellulose membrane at 150 mA for 50-90 minutes. Blocked the membrane with 5% non-fat milk/TBS for 1.5 hour at RT. The membrane was incubated with rabbit anti-VEGFA antigen affinity purified polyclonal antibody (Catalog # PA1080) at 0.5 μg/mL overnight at 4°C, then washed with TBS-0.1%Tween 3 times with 5 minutes each and probed with a goat anti-rabbit IgG-HRP secondary antibody at a dilution of 1:5000 for 1.5 hour at RT. The signal is developed using an Enhanced Chemiluminescent detection (ECL) kit (Catalog # EK1002) with Tanon 5200 system. A specific band was detected for VEGFA at approximately 27 kDa. The expected band size for VEGFA is at 27 kDa.

Click image to see more details
IHC analysis of VEGFA using anti-VEGFA antibody (PA1080).
VEGFA was detected in a paraffin-embedded section of human lung cancer tissue. Heat mediated antigen retrieval was performed in EDTA buffer (pH 8.0, epitope retrieval solution). The tissue section was blocked with 10% goat serum. The tissue section was then incubated with 2 μg/ml rabbit anti-VEGFA Antibody (PA1080) overnight at 4°C. Peroxidase Conjugated Goat Anti-rabbit IgG was used as secondary antibody and incubated for 30 minutes at 37°C. The tissue section was developed using HRP Conjugated Rabbit IgG Super Vision Assay Kit (Catalog # SV0002) with DAB as the chromogen.

Click image to see more details
IHC analysis of VEGFA using anti-VEGFA antibody (PA1080).
VEGFA was detected in a paraffin-embedded section of human liver cancer tissue. Heat mediated antigen retrieval was performed in EDTA buffer (pH 8.0, epitope retrieval solution). The tissue section was blocked with 10% goat serum. The tissue section was then incubated with 2 μg/ml rabbit anti-VEGFA Antibody (PA1080) overnight at 4°C. Peroxidase Conjugated Goat Anti-rabbit IgG was used as secondary antibody and incubated for 30 minutes at 37°C. The tissue section was developed using HRP Conjugated Rabbit IgG Super Vision Assay Kit (Catalog # SV0002) with DAB as the chromogen.

Click image to see more details
Molecular mechanism validation of P-Nb2C-PEG@si-circPUM1 anti-angiogenic performance in vivo. (A) H&E staining showed increased necrotic loci within tumors of P-Nb2C-PEG@si-circPUM1 group. (B, D) IHC staining of Ki-67 demonstrated a clear reduction in Ki-67-positive cells in P-Nb2C-PEG@si-circPUM1 group. (C, F) IHC staining of CD31 indicated a marked decrease in MVD within tumors of P-Nb2C-PEG@si-circPUM1 group. (H) QPCR showed a significant downregulation of circPUM1 expression in the P-Nb2C-PEG@si-circPUM1 treated group. IHC (E, G) and Western blot (I, J) demonstrated significant down-regulation of RAB27B and VEGFA.
Index in PubMed under a CC BY license. PMID: 41050095

Click image to see more details
ZGF Promotes VEGF/Notch1/Noggin Pathway Activation. (A) RT-PCR was used to detect NOG, Notch1, and VEGF mRNA expression levels in the tibial metaphysis of Wistar and GK rats. (B–C) Target proteins NOG, Notch1, and VEGF expression levels were measured by Western blot in the tibial metaphysis of Wistar and GK rats. (Uncropped Western blot images are included in Additional file 1.) Data are expressed as mean ± SD. *P < 0.05, **P < 0.01, ***P < 0.001, ****P < 0.0001 VS. MC group. #P < 0.05, ##P < 0.01, ###P < 0.001, ####P < 0.0001 VS. PC group. ^P < 0.05, ^^P < 0.01, ^^^P < 0.001, ^^^^P < 0.0001 VS. BC group, (n = 3).
Index in PubMed under a CC BY license. PMID: 38524608

Click image to see more details
In vitro antitumor performance of P-Nb2C@si-circPUM1 in ovarian cancer cells. (A) Confocal microscopy images showed intracellular uptake of Cy3-labeled circPUM1 siRNA. Cell apoptosis assays (B), Transwell assays (C), wound healing assays (E) and EdU proliferation assays (F) showed that P-Nb2C-loaded circPUM1 siRNA effectively suppressed ovarian cancer cell phenotypes. (G) RT-qPCR demonstrated a significant downregulation of circPUM1 expression in lipo2000-transfected and P-Nb2C-loaded siRNA groups. Immunofluorescence (D) and Western blot (H) validated the downregulation of VEGFA and RAB27B expression in cells treated with P-Nb2C@si-circPUM1. (I) CCK8 assays showed inhibition of ovarian cancer cell viability in lipo2000-transfected and P-Nb2C-loaded siRNA groups.
Index in PubMed under a CC BY license. PMID: 41050095

Click image to see more details
The anti-angiogenic activity of SPS on HUVECs in vitro . ( a ) Dose- and time-dependent growth-inhibiting effects of SPS on HUVECs. Cells were cultured in 96-well plate and treated with different concentrations of SPS (0–1.5 mg/ml) for 12 and 24 h. The cell viability was analyzed by MTT assay. Each data indicated the mean ± SD of three independent experiments (n = 3). * P < 0.05, ** P < 0.01 versus medium control. After A549 cells were treated without (I) or with 0.2 (II), 0.3 (III) and 0.4 (IV) mg/ml of SPS for 8–10 h, cell migration was analyzed using scratch-wound assay ( b ) as well as Transwell assay ( c ). Quantitative evaluations of HUVECs migration induced by SPS in the scratch-wound assay ( d ) and Transwell assay ( e ). ( f ) SPS inhibited the formation of new capillary tube of HUVECs. HUVECs were plated on the surface of the Matrigel in a 96-well plate, where endothelial cells could align and form cords and treated without (I) or with 0.2 (II), 0.3 (III) and 0.4 (IV) mg/ml of SPS for 6 h. ( g ) SPS did not disrupt the preformed vascular network of HUVECs. After the new tube-like structures established, various concentrations of SPS, 0 (I), 0.2 (II), 0.4 (III) and 0.6 (IV) mg/ml were added and incubated for another 12 h. The disruption on the preformed tubes was observed and recorded using an inverted microscope. ( h ) After treated with SPS for 24 h, HUVECs were lysed and western blotting analysis was performed to detect the expressions of VEGF and VEGFR. ( i ) Histograms showed the quantitative evaluation of VEGF and VEGFR protein levels, which were measured by Image J and results were normalized to untreated cells.
Index in PubMed under a CC BY license. PMID: 27216943

Click image to see more details
Western blot analysis of the human and chicken VEGF-A protein in the CAM . In the NCI-H446/HIF-1α and NCI-H446/siHIF-1α groups, the SCLC cells were transduced with Ad-HIF-1α or Ad-siHIF-1α (MOI = 50) for 60 h before implanting onto the CAM to form transplantation tumors. Western blots were performed to detect the VEGF-A protein level in the tumors and peripheral tissues on day 17 of incubation. Data are presented as means ± SD. (A) Representative images of three independent experiments (Lane A - human VEGF-A protein expression in the tumors from the NCI-H446 group; Lane B - human VEGF-A protein expression in the tumors from the NCI-H446/HIF-1α group; and Lane C - human VEGF-A protein expression in the tumors from the NCI-H446/siHIF-1α group) (human - * p < 0.05 group C vs. group B; ** p < 0.05 group C vs. group D) (chicken - * p < 0.05 group C vs. group B; ** p < 0.05 group C vs. group D). (B) Representative images of three independent experiments (Lane A - chicken VEGF-A protein expression of control group; Lane B - chicken VEGF-A protein expression in the tumors from the NCI-H446 group; Lane C - chicken VEGF-A protein expression in the tumors from the NCI-H446/HIF-1α group; and Lane D - Chicken VEGF-A protein expression in tumors from the NCI-H446/siHIF-1α group). (C) Densitometry analysis of the relative expression of VEGF-A protein compared to the corresponding β-actin in each group (p < 0.05).
Index in PubMed under a CC BY license. PMID: 21843314

Click image to see more details
STAT1 inhibitor attenuated IL-17-induced IL-6, IL-8, and VEGF production in human lung adenocarcinoma. A549/H292 cells were incubated with IL-17 or IL-17 plus a STAT1 inhibitor for 6 or 48 h (100 ng/ml IL-17; and 30 μM inhibitor). The IL-6, IL-8, and VEGF mRNA and protein levels were determined by qRT-PCR and ELISA, respectively. (A) IL-6, IL-8, and VEGF mRNA levels in A549/H292 cells, mRNA expression levels were calculated using the 2 −ΔΔCt method, and target gene expression was normalized to the GAPDH housekeeping gene. The data are presented as the mean ± SEM of three independent experiments. (B) IL-6, IL-8, and VEGF protein levels in A549/H292 cells. The data are presented as the mean ± SEM of three independent experiments. Comparisons were performed using the t-test. *p < 0.05; **p < 0.01; and ***p < 0.001.
Index in PubMed under a CC BY license. PMID: 27819281

Click image to see more details
IL-6, IL-8, VEGF and STAT1 expression were augmented in A549-IL-17 cell-bearing nude tissues. (A , B) The relative protein expression of IL-6, IL-8, VEGF and STAT1 in tumour tissues of A549-IL-17 vs. A549-Neo cell-bearing nude mice was determined by WB. (C) The relative mRNA expression of IL-6, IL-8, VEGF and STAT1 in tumour tissues of A549-IL-17 vs. A549-Neo cell-bearing nude mice was determined by qRT-PCR (n = 5). mRNA expression levels were calculated using the 2 −ΔΔCt method, and target gene expression was normalized to the GAPDH housekeeping gene. The data are presented as the mean ± SEM for five mice per group, and the results are representative of two independent experiments. *p < 0.05; **p < 0.01; and ***p < 0.001.
Index in PubMed under a CC BY license. PMID: 27819281

Click image to see more details
Expression of CD31, IL-17, IL-6, IL-8, and VEGF protein in human lung adenocarcinoma tissues. Immunohistochemical determination of CD31, IL-17, IL-6, IL-8, VEGF protein in 30 patients with lung adenocarcinoma. ( A – F ) High CD31, IL-17, IL-6, IL-8, VEGF protein expression were presented in tumor tissue of case 58. ( G – L ) Low CD31, IL-17, IL-6, IL-8, VEGF protein expression were showed in tumor tissue of case 34. No staining was observed when an isotype-matched control mAb ( A , G ) was used (magnification, × 200).
Index in PubMed under a CC BY license. PMID: 27819281

Click image to see more details
Correlation between MVD and IL-17, IL-6, IL-8, VEGF in human lung adenocarcinoma tissues. IL-17, IL-6, IL-8, VEGF mRNA and protein and CD31 protein levels were determined in human lung adenocarcinoma tissues by qRT-PCR or IHC, respectively. (A) Spearman’s correlation analysis was performed to analyse the correlation between IL-17 (a), IL-6 (b), IL-8 (c), VEGF (d) protein expression and tumour microvessel density (MVD) by CD31 staining in tumor tissues with human lung adenocarcinoma. (B) Spearman’s correlation analysis was performed to analyse the correlation between IL-17 (a), IL-6 (b), IL-8 (c), VEGF (d) expression and tumour microvessel density by CD31 staining in 28 tissues with human lung adenocarcinoma. mRNA expression levels were calculated using the −ΔΔCt method, and target gene expression was normalized to the GAPDH housekeeping gene.
Index in PubMed under a CC BY license. PMID: 27819281

Click image to see more details
Vascular endothelial growth factor (VEGF) ligands and receptors were found to be essential for the angiogenesis-promoting role of deer TMSB10 in HUVECs. a Representative images of VEGFA, VEGFB, VEGFC, VEGFD, FLT1, KDR, and FLT4 protein levels in HUVECs overexpressing deer TMSB10 after Western blot analysis. b Quantification of Western blotting for the VEGF family. The protein levels were normalized with GAPDH. The relative levels of proteins were calculated and plotted. The data are expressed as mean ± SD, n = 3 experiments. * P < 0.05, ** P < 0.01, compared with vector (control set at 100%). c VEGF family involved in the angiogenic process
Index in PubMed under a CC BY license. PMID: 29921287

Click image to see more details
Effects of deer TMSB10 on cell proliferation, tube formation, and motility of HUVECs as well as on DRG outgrowth. a HUVECs overexpressing deer TMSB10 compared with vector alone. HUVECs overexpressing deer TMSB10 had significantly higher growth rates than that of the vector control group. b Determination of HUVEC proliferation using the MTT assay. HUVEC cells were exposed for 24, 48, and 72 h in the presence of deer exogenous TMSB10 (eTMSB10: 50, 100, or 150 ng/ml) and compared with control. The growth rates of the HUVECs treated with deer eTMSB10 (50, 100, and 150 ng/ml) were significantly higher than in controls. c Representative images (inverted phase contrast) of tube formation assays. Scale bars = 200 μm. d Quantification of tube formation by calculating the average number of branched vessels per field of view in response to exogenous TMSB10 (eTMSB10: 50, 100, or 150 ng/ml), overexpressed TMSB10 (TMSB10), and vascular endothelial growth factor (VEGF) as a positive control. Results showed that deer eTMSB10 and deer TMSB10 overexpressing HUVECs showed more tube formation in the HUVECs compared with controls or vector. e Transwell migration assays with HUVECs treated with deer eTMSB10 (50, 100, and 150 ng/ml) or overexpressing deer TMSB10 were compared with their controls. Results showed that deer eTMSB10 and deer TMSB10 overexpressing HUVECs showed more migration compared with the control or vector. f Lamellipodium emerging from a DRG neuron after treatment for 2 days or 5 days with 50, 100, and 150 ng/ml eTMSB10 or nerve growth factor (NGF; 50 ng/ml) as a positive control. Scale bar = 100 μm. g Quantification of average length of lamellipodium. Results showed that deer eTMSB10 significantly increased the growth of lamellipodium from DRG compared with the control. Data represent mean ± SD of three or four experiments. * P < 0.05, ** P < 0.01, compared with control or vector (control or vector control = 100%). OD optical density
Index in PubMed under a CC BY license. PMID: 29921287

Click image to see more details
Effect of miR-542-3p overexpression on angiogenetic capacity of HESCs. ( a ) q-PCR analysis of VEGF, MMP9.COX2 mRNA levels in control or miR-542-3p mimic or mimics NC groups. ( b ) Representative western blots showing VEGF, MMP9.COX2 protein levels in control or miR-542-3p mimic or mimics NC groups. ( c ) Capillary-like tube formation performed by HUVECs with /without the supernatant of miR-542-3p-overexpressing HESCs. Representative images (100X) are showed. Number of Tube area (tube meshes and total master segment length) were acquired automatically. *p < 0.05, **p < 0.01. Values are expressed as mean ± SD of three independent experiments.
Index in PubMed under a CC BY license. PMID: 33785768

Click image to see more details
Transplantation of PDGF-BB-primed MSCs via UTMD reduces cardiomyocyte apoptosis and improves angiogenesis in rat hearts post-MI. ( A ) Representative images of TUNEL-positive cardiomyocytes in the ischemic area 30 days after MI. Apoptotic nuclei were identified as TUNEL positive (green fluorescence), and total nuclei were identified by DAPI counterstaining (blue fluorescence). Myocardium was stained using a monoclonal antibody against cardiac troponin I (red fluorescent). Bar, 20 μm. ( B ). Quantification of TUNEL-positive cardiomyocytes. ( C - F ) Western blotting of activated caspase 3, Bax, and BCL-2 in the ischemic heart. GAPDH was used as a loading control. ( G ) Representative images of CD31 staining and α-SMA staining in the ischemic hearts of rats 30 days post-MI. Bar, 20 μm. ( H ) Quantitative analysis of the capillary density in the ischemic heart. (I) Quantitative analysis of the arteriole density in the ischemic heart. ( J - M ) Protein expression of VEGF, bFGF and IGF-1 determined by Western blotting in ischemic myocardium, with GAPDH as the internal control. Values are the mean ± SEM. Significant differences were determined by using one-way ANOVA. N = 5/group. *p < 0.01 vs. MI; # p < 0.01 vs. MI-MSC-vehicle
Index in PubMed under a CC BY license. PMID: 38102643

Click image to see more details
As 2 O 3 inhibited angiogenesis by modulating TSP-1, TGF-β1, CTGF and VEGF expression in RA-FLS. RA-FLS and HDMECs co-cultures were respectively treated with As 2 O 3 alone or together with TNF-α (100ng/ml) for 48 h. A. TSP-1, TGF-β1, CTGF and VEGF protein expression in the supernatants from RA-FLS and HDMECs co-cultures were analyzed by ELISA. Results showed that concentrations of TSP-1, TGF-β1, CTGF and VEGF increased significantly after treatment with TNF-α (100 ng/ml) ( n = 3) compared to vehicle control group ( n = 3; & p < 0.05), and then significantly decreased concentrations of TSP-1, TGF-β1, CTGF and VEGF were observed after the treatment of As 2 O 3 at doses of 1.0 μM and 2.0 μM ( n = 3, respectively; # p < 0.05, ## p < 0.01). TSP-1, TGF-β1, CTGF and VEGF protein expression in the supernatants from RA-FLS and HDMECs co-cultures without TNF-α addition also decreased significantly after treatment of As 2 O 3 at doses of 1.0 μM ( n = 3) and 2.0 μM ( n = 3) compared to vehicle control ( n = 3; * p < 0.05). B. mRNA levels of TSP1, TGF-β1, CTGF and VEGF expression in RA-FLS co-cultured were performed by real-time PCR. Results showed similar changes of TSP-1, TGF-β1, CTGF and VEGF mRNA expression as demonstrated in protein regulation after treatment of As 2 O 3 alone ( n = 3) or together with TNF-α (100ng/ml) ( n = 3; * p < 0.05, ** p < 0.01, # p < 0.05, ## p < 0.01). C. and D. Transwell assay and tube formation test were performed by applying supernatants from RA-FLS and HDMECs co-culture to HDMECs for 6 h respectively. Results showed that migration and capillary-like structure formation of HDMECs significantly increased after TNF-α (100ng/ml) stimulation ( n = 3, respectively; * p < 0.05), while As 2 O 3 at doses of 1.0 μM ( n = 3) and 2.0 μM ( n = 3) played a significantly opposite role in migration and tube formation with or without TNF-α (* p < 0.05, ** p < 0.01, # p < 0.05, ## p < 0.01), which were also in a dose dependent manner. E. Ex vivo aortic ring angiogenesis assay showed similar changes of microvessel sprouting as demonstrated in migration and tube formation of HDMECs in the transwell assay and tube formation test above ( n = 3, respectively; * p < 0.05, ** p < 0.01, # p < 0.05). Bars = 300μm. Original magnification = ×5. Results are expressed as the mean ± S.E.M. & p < 0.05 versus Veh. * p < 0.05, ** p < 0.01 versus Veh, # p < 0.05, ## p < 0.01 versus TNF-α. Veh = vehicle control under treatment of 1% FBS DMEM alone. TNF-α = control group under treatment of TNF-α (100ng/ml).
Index in PubMed under a CC BY license. PMID: 29088724

Click image to see more details
Increased expression of TSP-1, TGF-β1, CTGF and VEGF in supernatants of RA-FLS and HDMECs co-culture compared to NH-FLS and HDMECs co-culture. Normal human (NH) FLS and rheumatoid arthritis (RA) FLS were co-cultured with HDMECs for 48 h, respectively. A. ELISA analysis demonstrated significant increase in the concentrations of TSP-1, TGF-β1, CTGF and VEGF in supernatants of RA-FLS and HDMECs co-culture ( n = 3) compared with those from NH-FLS and HDMECs co-culture ( n = 3; p < 0.05). B. Real-time PCR analysis showed increased mRNA expression of TSP-1, TGF-β1, CTGF and VEGF in RA-FLS co-cultured ( n = 3) compared to NH-FLS co-cultured ( n = 3; * p < 0.05, ** p < 0.01, *** p < 0.001). C. and D. Transwell assay (C; n = 3) and tube formation test (D; n = 3) for 6 h demonstrated significant up-regulation in migration and capillary-like structure formation of HDMECs respectively under treatment of supernatants from RA-FLS and HDMECs co-culture ( n = 3) compared to those from NH-FLS and HDMECs co-culture ( n = 3; * p < 0.05). E. aortic rings were placed on GFR-Matrigel-coated plates and incubated in 1% FBS EGM-2. On 3 rd day, the EGM-2 were exchanged with supernatants from FLS and HDMECs co-cuture and further incubated for 3 days. Ex vivo aortic ring angiogenesis assay showed significant up-regulation in microvessel sprouting under treatment of supernatants from RA-FLS and HDMECs co-culture ( n = 3) compared to those from NH-FLS and HDMECs co-culture ( n = 3; * p < 0.05). Bars = 300 μm. Original magnification = ×5. Results are expressed as the mean ± S.E.M.
Index in PubMed under a CC BY license. PMID: 29088724

Click image to see more details
Schematic representation of PDGF-BB-primed MSC transplantation by UTMD for infarcted myocardium repair. UTMD enhanced the delivery of MSCs into the infarcted myocardium by upregulating SDF-1 expression. Compared with UTMD alone, UTMD combined with PDGF-BB pretreatment increased the therapeutic effect of grafted cells by improving MSC migration and survival, reducing cardiomyocyte apoptosis, decreasing fibrosis, increasing microvessel density (via upregulation of VEGF, bFGF and IGF-1) and improving cardiac function. PDGF-BB promotes the survival/retention and cardioprotection of engrafted MSCs in rat models of MI via the PI3K/Akt pathway and CXCR4 activation
Index in PubMed under a CC BY license. PMID: 38102643

Click image to see more details
Correlation between IL-17 and IL-6, IL-8, VEGF in human lung adenocarcinoma tissues. IL-17, IL-6, IL-8, VEGF mRNA and protein protein levels were determined in human lung adenocarcinoma tissues by qRT-PCR or IHC, respectively. (A) Spearman’s correlation analysis was performed to analyse the correlation between IL-17 protein expression and IL-6 (a), IL-8 (b), VEGF (c) protein in tumour tissues of patients with lung adenocarcinoma. (B) Pearson’s correlation analysis was used to analyse the relationship between IL-17 mRNA expression and IL-6 (a), IL-8 (b), VEGF (c) mRNA expression in tumour tissues of patients with lung adenocarcinoma.. mRNA expression levels were calculated using the −ΔΔCt method, and target gene expression was normalized to the GAPDH housekeeping gene.
Index in PubMed under a CC BY license. PMID: 27819281

Click image to see more details
STAT1 siRNA reversed IL-17-induced IL-6, IL-8, and VEGF expression in human lung adenocarcinoma cells in vitro . A549/H292 cells (2 × 10 5 cells/well) were transfected with STAT1 siRNA for 48 h. (A) STAT1 protein expression was determined by WB. Then, A549/H292 cells (5 × 10 5 cells/well) were transfected with siRNA for 48 h and subsequently treated with human IL-17 (100 ng/ml) for an additional 6 or 48 h. The IL-6, IL-8, and VEGF mRNA and protein expression levels were determined by qRT-PCR and WB, respectively. (B) IL-6, IL-8, VEGF mRNA levels in A549/H292 cells. mRNA expression levels were calculated using the 2 −ΔΔCt method, and target gene expression was normalized to the GAPDH housekeeping gene. The data are presented as the mean ± SEM of three independent experiments. (C) IL-6, IL-8, and VEGF protein levels in A549/H292 cells and the results are presented as the mean ± SEM of three independent experiments. Comparisons were performed using the t-test. *p < 0.05; **p < 0.01; and ***p < 0.001.
Index in PubMed under a CC BY license. PMID: 27819281

Click image to see more details
The modulation of TSP-1, TGF-β1, CTGF and VEGF expression alongside interventions of TSP-1, TGF-β1, CTGF and VEGF stimulation or knockdown. A. The effects of TSP-1, TGF-β1, CTGF and VEGF stimulation/silencing in RA-FLS on TSP-1, TGF-β1, CTGF, and VEGF proteins expression in the supernatants were determined by ELISA. RA-FLS were stimulated with CTGF (500 ng/ml), TGF-β1 (5ng/ml), TSP-1 (1,000 ng/ml) and VEGF (50 ng/ml) respectively for 48 h. Stimulation ( n = 3)/silencing ( n = 3) of TGF-β1 in RA-FLS resulted in significant increase/decrease in the supernatants protein expression of TSP-1, CTGF, and VEGF ( p < 0.05). Stimulation ( n = 3)/silencing ( n = 3) of VEGF in RA-FLS leaded to similar changes of the other three protein expression in supernatants ( p < 0.05). Addition(n = 3)/silencing( n = 3) of CTGF in RA-FLS caused significant up-/down-regulation in the supernatants protein expression of TSP-1 and VEGF ( p < 0.05). And stimulation ( n = 3)/knockdown ( n = 3) of TSP-1 in RA-FLS didn’t lead to significant increase/decrease in the expression of supernatants protein TGF-β1, CTGF and VEGF. B. TSP-1, TGF-β1, CTGF and VEGF mRNA expression levels were analyzed by real-time PCR after TSP-1, TGF-β1, CTGF and VEGF stimulation/silencing. Results showed similar alterations of TSP-1, TGF-β1, CTGF and VEGF mRNA expression as demonstrated in supernatants protein regulation after TSP-1, TGF-β1, CTGF and VEGF stimulation/silencing ( n = 3 respectively; p < 0.05). Results are expressed as the mean ± S.E.M. * p < 0.05, ** p < 0.01, *** p < 0.001 versus Veh, # p < 0.05, ## p < 0.01, ### p < 0.001 versus Scr siRNA. Veh = vehicle control. Scr siRNA = scramble siRNA.
Index in PubMed under a CC BY license. PMID: 29088724

Click image to see more details
Increased VEGF and VEGFR2 expression in tumors from CD47-deficient mice. ( A ) Representative images of tumor sections stained for VEGF-A (brown). Scale bar, 20 μm. ( B ) Percentages of VEGFR2 + area by counting positive cells in six randomly selected fields (400×) using Image Pro Plus 6.0 software. ( C ) mRNA levels of VEGF-A in tumor samples from WT and CD47 −/− mice ( n = 4 per group). ( D ) Representative images of tumor sections stained for VEGFR2 + (brown). Scale bar, 20 μm. ( E ) Percentages of VEGFR2 + area by counting positive cells in six randomly selected fields (400×) using Image Pro Plus 6.0 software. ( F ) mRNA levels of VEGFR2 in tumor samples from WT and CD47 −/− mice ( n = 4 per group). Data are mean ± SDs. * P < 0.05, ** P < 0.01; *** P < 0.001.
Index in PubMed under a CC BY license. PMID: 27283989

Click image to see more details
The effect of IL-17 on IL-6, IL-8, VEGF expression in human lung adenocarcinoma cells in vitro . A549/H292 cells were incubated with IL-17 or IL-17 (100 ng/ml) for 6 or 48 h. The IL-6, IL-8, and VEGF mRNA and protein levels were determined by qRT-PCR or ELISA, respectively. (A) IL-6, IL-8, and VEGF mRNA levels in A549/H292 cells mRNA expression levels were calculated using the 2 −ΔΔCt method, and target gene expression was normalized to the GAPDH housekeeping gene. The data are presented as the mean ± SEM of three independent experiments. (B) IL-6, IL-8, and VEGF protein levels in A549/H292 cells by ELISA. The results shown are representative of four independent experiments and are presented the mean ± SEM. Comparisons were performed using the t-test. *p < 0.05; **p < 0.01; and ***p < 0.001.
Index in PubMed under a CC BY license. PMID: 27819281

Click image to see more details
RT-PCR analysis of human and chicken angiogenic factors mRNA . Microarray analysis was performed to screen out the angiogenic factors affected by HIF-1α in SCLC cells (table 2). Afterwards, RT-PCR analysis was used to detect the expression of angiogenic factors affected by HIF-1a in the transplantation tumors of CAM in vivo . (A), Human and chicken VEGF-A, TNFAIP6, PDGFC, FN1, MMP28, MMP14, SOCS2 and IGFBP3 mRNA expression: Representative images of three independent experiments (Lane 1: control group-no human mRNA expression, Lane 2: transplantation tumor of NCI-H446 cells transduction by empty vector Ad5-NCI-H446 cells group, Lane 3: ransplantation tumor of NCI-H446 cells with transduction by HIF-1α-NCI-H446/HIF-1α group, Lane 4: transplantation tumor of NCI-H446 cells with transduction by siHIF-1α-NCI-H446/siHIF-1α group). (B and C), Relative expression levels of mRNA in NCI-H446/HIF-1α group and NCI-H446/siHIF-1α group compared with that in control group and NCI-H446 cells group (p < 0.05).
Index in PubMed under a CC BY license. PMID: 21843314

Click image to see more details
As 2 O 3 inhibited angiogenesis by modulating TSP-1, TGF-β1, CTGF and VEGF expression in RA-FLS. RA-FLS and HDMECs co-cultures were respectively treated with As 2 O 3 alone or together with TNF-α (100ng/ml) for 48 h. A. TSP-1, TGF-β1, CTGF and VEGF protein expression in the supernatants from RA-FLS and HDMECs co-cultures were analyzed by ELISA. Results showed that concentrations of TSP-1, TGF-β1, CTGF and VEGF increased significantly after treatment with TNF-α (100 ng/ml) ( n = 3) compared to vehicle control group ( n = 3; & p < 0.05), and then significantly decreased concentrations of TSP-1, TGF-β1, CTGF and VEGF were observed after the treatment of As 2 O 3 at doses of 1.0 μM and 2.0 μM ( n = 3, respectively; # p < 0.05, ## p < 0.01). TSP-1, TGF-β1, CTGF and VEGF protein expression in the supernatants from RA-FLS and HDMECs co-cultures without TNF-α addition also decreased significantly after treatment of As 2 O 3 at doses of 1.0 μM ( n = 3) and 2.0 μM ( n = 3) compared to vehicle control ( n = 3; * p < 0.05). B. mRNA levels of TSP1, TGF-β1, CTGF and VEGF expression in RA-FLS co-cultured were performed by real-time PCR. Results showed similar changes of TSP-1, TGF-β1, CTGF and VEGF mRNA expression as demonstrated in protein regulation after treatment of As 2 O 3 alone ( n = 3) or together with TNF-α (100ng/ml) ( n = 3; * p < 0.05, ** p < 0.01, # p < 0.05, ## p < 0.01). C. and D. Transwell assay and tube formation test were performed by applying supernatants from RA-FLS and HDMECs co-culture to HDMECs for 6 h respectively. Results showed that migration and capillary-like structure formation of HDMECs significantly increased after TNF-α (100ng/ml) stimulation ( n = 3, respectively; * p < 0.05), while As 2 O 3 at doses of 1.0 μM ( n = 3) and 2.0 μM ( n = 3) played a significantly opposite role in migration and tube formation with or without TNF-α (* p < 0.05, ** p < 0.01, # p < 0.05, ## p < 0.01), which were also in a dose dependent manner. E. Ex vivo aortic ring angiogenesis assay showed similar changes of microvessel sprouting as demonstrated in migration and tube formation of HDMECs in the transwell assay and tube formation test above ( n = 3, respectively; * p < 0.05, ** p < 0.01, # p < 0.05). Bars = 300μm. Original magnification = ×5. Results are expressed as the mean ± S.E.M. & p < 0.05 versus Veh. * p < 0.05, ** p < 0.01 versus Veh, # p < 0.05, ## p < 0.01 versus TNF-α. Veh = vehicle control under treatment of 1% FBS DMEM alone. TNF-α = control group under treatment of TNF-α (100ng/ml).
Index in PubMed under a CC BY license. PMID: 29088724

Click image to see more details
A: Effect of AMD3100 on expression of MMP-2, MMP-9 and VEGF in SW480 cells. Protein samples extracted from SW480 cells treated for 26 h with AMD3100 were subjected to Western blotting for MMP-2, MMP-9, VEGF and GAPDH proteins. AMD3100 significantly decreased MMP-9 and VEGF protein expression in SW480 cells in a dose-dependent manner. The level of GAPDH expression was determined as a control for equivalent protein loading; B: RNA samples extracted from SW480 cells treated for 26 h with AMD3100 were subjected to RT-PCR for MMP-2 , MMP-9 , VEGF and β -actin . AMD3100 also significantly decreased expression of MMP-9 and VEGF mRNAs in SW480 cells, and the inhibitory effect was dose-dependent. RT-PCR for β -actin was performed in parallel to show an equal amount of total RNA in the sample.
Index in PubMed under a CC BY license. PMID: 18416455

Click image to see more details
As 2 O 3 inhibited angiogenesis by modulating TSP-1, TGF-β1, CTGF and VEGF expression in RA-FLS. RA-FLS and HDMECs co-cultures were respectively treated with As 2 O 3 alone or together with TNF-α (100ng/ml) for 48 h. A. TSP-1, TGF-β1, CTGF and VEGF protein expression in the supernatants from RA-FLS and HDMECs co-cultures were analyzed by ELISA. Results showed that concentrations of TSP-1, TGF-β1, CTGF and VEGF increased significantly after treatment with TNF-α (100 ng/ml) ( n = 3) compared to vehicle control group ( n = 3; & p < 0.05), and then significantly decreased concentrations of TSP-1, TGF-β1, CTGF and VEGF were observed after the treatment of As 2 O 3 at doses of 1.0 μM and 2.0 μM ( n = 3, respectively; # p < 0.05, ## p < 0.01). TSP-1, TGF-β1, CTGF and VEGF protein expression in the supernatants from RA-FLS and HDMECs co-cultures without TNF-α addition also decreased significantly after treatment of As 2 O 3 at doses of 1.0 μM ( n = 3) and 2.0 μM ( n = 3) compared to vehicle control ( n = 3; * p < 0.05). B. mRNA levels of TSP1, TGF-β1, CTGF and VEGF expression in RA-FLS co-cultured were performed by real-time PCR. Results showed similar changes of TSP-1, TGF-β1, CTGF and VEGF mRNA expression as demonstrated in protein regulation after treatment of As 2 O 3 alone ( n = 3) or together with TNF-α (100ng/ml) ( n = 3; * p < 0.05, ** p < 0.01, # p < 0.05, ## p < 0.01). C. and D. Transwell assay and tube formation test were performed by applying supernatants from RA-FLS and HDMECs co-culture to HDMECs for 6 h respectively. Results showed that migration and capillary-like structure formation of HDMECs significantly increased after TNF-α (100ng/ml) stimulation ( n = 3, respectively; * p < 0.05), while As 2 O 3 at doses of 1.0 μM ( n = 3) and 2.0 μM ( n = 3) played a significantly opposite role in migration and tube formation with or without TNF-α (* p < 0.05, ** p < 0.01, # p < 0.05, ## p < 0.01), which were also in a dose dependent manner. E. Ex vivo aortic ring angiogenesis assay showed similar changes of microvessel sprouting as demonstrated in migration and tube formation of HDMECs in the transwell assay and tube formation test above ( n = 3, respectively; * p < 0.05, ** p < 0.01, # p < 0.05). Bars = 300μm. Original magnification = ×5. Results are expressed as the mean ± S.E.M. & p < 0.05 versus Veh. * p < 0.05, ** p < 0.01 versus Veh, # p < 0.05, ## p < 0.01 versus TNF-α. Veh = vehicle control under treatment of 1% FBS DMEM alone. TNF-α = control group under treatment of TNF-α (100ng/ml).
Index in PubMed under a CC BY license. PMID: 29088724

Click image to see more details
CircPUM1 promotes angiogenesis in ovarian cancer as the form of exosomes. (A) The expression of circPUM1 was positively related with MVD in ovarian cancer tissue. (B) Experimental design schematic (Created in BioRender. Guan, X. (2025) https://BioRender.com/f5br0q0): HUVEC were co-cultured with exosomes derived from circPUM1-overexpressing and control OVCAR3 cells. (C) RT-qPCR showed that circPUM1 was highly expressed in HUVEC after co-cultured with exosomal circPUM1. Exosomal circPUM1 enhanced migration ability (D, E), viability (F), invasiveness (G), and tube formation ability (H) of HUVECs. (I) Circular RNA pull-down assays using biotinylated circPUM1 probes confirmed co-enrichment of circPUM1 and miR-607. (J) Dual-luciferase reporter assays showed miR-607 targeting 3′-UTR in both VEGFA and RAB27B. (K) Western blot revealed that overexpression of circPUM1 upregulated VEGFA and RAB27B, whereas miR-607 downregulated these targets in OVCAR3 cells. Exosomal circPUM1 elevated intracellular VEGFA expression in HUVECs. (L) Molecular schematic (Created in BioRender. Guan, X. (2025) https://BioRender.com/5eldsz5): In ovarian cancer, the highly expressed circPUM1 sponges miR-607, upregulating expression of VEGFA and RAB27B. This dual regulation establishes a pro-tumorigenic cascade through two distinct pathways: (1) RAB27B-mediated secretion of exosomal circPUM1, and (2) VEGFA-induced activation of angiogenic signaling.
Index in PubMed under a CC BY license. PMID: 41050095

Click image to see more details
As 2 O 3 inhibited angiogenesis by modulating TSP-1, TGF-β1, CTGF and VEGF expression in RA-FLS. RA-FLS and HDMECs co-cultures were respectively treated with As 2 O 3 alone or together with TNF-α (100ng/ml) for 48 h. A. TSP-1, TGF-β1, CTGF and VEGF protein expression in the supernatants from RA-FLS and HDMECs co-cultures were analyzed by ELISA. Results showed that concentrations of TSP-1, TGF-β1, CTGF and VEGF increased significantly after treatment with TNF-α (100 ng/ml) ( n = 3) compared to vehicle control group ( n = 3; & p < 0.05), and then significantly decreased concentrations of TSP-1, TGF-β1, CTGF and VEGF were observed after the treatment of As 2 O 3 at doses of 1.0 μM and 2.0 μM ( n = 3, respectively; # p < 0.05, ## p < 0.01). TSP-1, TGF-β1, CTGF and VEGF protein expression in the supernatants from RA-FLS and HDMECs co-cultures without TNF-α addition also decreased significantly after treatment of As 2 O 3 at doses of 1.0 μM ( n = 3) and 2.0 μM ( n = 3) compared to vehicle control ( n = 3; * p < 0.05). B. mRNA levels of TSP1, TGF-β1, CTGF and VEGF expression in RA-FLS co-cultured were performed by real-time PCR. Results showed similar changes of TSP-1, TGF-β1, CTGF and VEGF mRNA expression as demonstrated in protein regulation after treatment of As 2 O 3 alone ( n = 3) or together with TNF-α (100ng/ml) ( n = 3; * p < 0.05, ** p < 0.01, # p < 0.05, ## p < 0.01). C. and D. Transwell assay and tube formation test were performed by applying supernatants from RA-FLS and HDMECs co-culture to HDMECs for 6 h respectively. Results showed that migration and capillary-like structure formation of HDMECs significantly increased after TNF-α (100ng/ml) stimulation ( n = 3, respectively; * p < 0.05), while As 2 O 3 at doses of 1.0 μM ( n = 3) and 2.0 μM ( n = 3) played a significantly opposite role in migration and tube formation with or without TNF-α (* p < 0.05, ** p < 0.01, # p < 0.05, ## p < 0.01), which were also in a dose dependent manner. E. Ex vivo aortic ring angiogenesis assay showed similar changes of microvessel sprouting as demonstrated in migration and tube formation of HDMECs in the transwell assay and tube formation test above ( n = 3, respectively; * p < 0.05, ** p < 0.01, # p < 0.05). Bars = 300μm. Original magnification = ×5. Results are expressed as the mean ± S.E.M. & p < 0.05 versus Veh. * p < 0.05, ** p < 0.01 versus Veh, # p < 0.05, ## p < 0.01 versus TNF-α. Veh = vehicle control under treatment of 1% FBS DMEM alone. TNF-α = control group under treatment of TNF-α (100ng/ml).
Index in PubMed under a CC BY license. PMID: 29088724

Click image to see more details
In vitro anti-angiogenic performance of P-Nb2C@si-circPUM1 in HUVECs. (A) QPCR showed a reduction of circPUM1 levels in exosomes derived from P-Nb2C@si-circPUM1-treated ovarian cancer cells. (B) Intracellular circPUM1 level in HUVEC treated with Exo-P-Nb2C@si-circPUM1 were markedly lower than those in Exo-control and Exo-P-Nb2C@si-scramble groups. CCK-8 and EdU assays demonstrated that Exo-P-Nb2C@si-circPUM1 suppressed cell viability (C) and DNA replication capacity (D, E) in HUVECs. Wound healing, Transwell assay and tube formation assay indicated that Exo-P-Nb2C@si-circPUM1 treatment significantly attenuated HUVEC migration (F), invasion (G), and angiogenic potential (I) compared to control groups. Immunofluorescence (H, J) and Western blot (K) confirmed downregulation of VEGFA in Exo-P-Nb2C@si-circPUM1 treated HUVECs.
Index in PubMed under a CC BY license. PMID: 41050095

Click image to see more details
As 2 O 3 suppressed TSP-1, TGF-β1, CTGF and VEGF expression and microvessel density in synovial tissue of CIA mice. Positive staining appears as brown color. A. - D. , F. Immunohistochemical analysis demonstrated increased percentage (%) of positive cells for CTGF, TGF-β1, TSP-1 and VEGF in synovial tissue of CIA mice ( n = 6; A-D, II, CIA control mice) compared to synovium of normal mice ( n = 6; A-D, I, normal mice; F, *** p < 0.001), while CIA mice treated with As 2 O 3 at a dose of 5.0 mg/kg/day ( n = 6; A-D, III) and MTX 1.5mg/kg/week ( n = 6; A-D, IV) showed decreased % of positive cells for CTGF, TGF-β1, TSP-1 and VEGF in synovial tissue compared to CIA control mice ( n = 6; A-D, II; F, ### p < 0.001). Original magnification = ×40. Bars = 25μm. E. , G. Immunohistochemical analysis for vWF showed a significant increase in number of microvessels in synovial tissue of CIA control mice ( n = 6; E, II) compared to the synovium of normal mice ( n = 6; E, I; G, *** p < 0.001), while CIA mice treated with As 2 O 3 at a dose of 5.0 mg/kg/day ( n = 6; E, III) and MTX 1.5 mg/kg/week ( n = 6; E, IV) demonstrated decreased number of microvessels in synovial tissue compared to CIA control mice ( n = 6; E, II; G, ## p < 0.01). Original magnification = ×40. Bars = 25μm. Data are expressed as the mean ± S.E.M. *** p < 0.001 versus NC, # p < 0.05, ## p < 0.01, ### p < 0.001 versus Con. NC = normal control mice. Con = CIA control mice. MTX = methotrexate.
Index in PubMed under a CC BY license. PMID: 29088724

Click image to see more details
The promotion of NA for the expression of CD31 and VEGF in vivo . (A 1 –A 3 ) Immunofluorescence staining indicating the CD31 expression in the healed skins on 11 days post-treatment. (A 4 ) The semi-quantification of CD31 in vivo on day 11. (B 1 –B 3 ) Immunofluorescence staining indicating the VEGF expression in the healed skins on 11 days post-treatment. (B 4 ) The semi-quantification of VEGF in vivo on day 11. Statistical significance is indicated as ns p ˃ 0.05, **** p < 0.0001 versus the Control group.
Index in PubMed under a CC BY license. PMID: 39502529
Specific Publications For Anti-VEGF/VEGFA Antibody Picoband® (PA1080)
Loading publications
Recommended Resources
Here are featured tools and databases that you might find useful.
- Boster's Pathways Library
- Protein Databases
- Bioscience Research Protocol Resources
- Data Processing & Analysis Software
- Photo Editing Software
- Scientific Literature Resources
- Research Paper Management Tools
- Molecular Biology Software
- Primer Design Tools
- Bioinformatics Tools
- Phylogenetic Tree Analysis
Customer Reviews
Have you used Anti-VEGF/VEGFA Antibody Picoband®?
Share your experimental results or join a short interview to earn up to $1,000 in product credits or other rewards.
0 Reviews For Anti-VEGF/VEGFA Antibody Picoband®
Customer Q&As
Have a question?
Find answers in Q&As, reviews.
Can't find your answer?
Submit your question
18 Customer Q&As for Anti-VEGF/VEGFA Antibody Picoband®
Question
What is the peptide coverage for PA1080?
Verified customer
Asked: 2020-10-09
Answer
The immunogen sequence of the Anti-VEGF/VEGFA Antibody (PA1080) is 33-48aa VDIFQEYPDEIEYIFK.
Boster Scientific Support
Answered: 2020-10-09
Question
Thanks for helping with my inquiry over the phone. Here are the WB image, lot number and protocol we used for lung using anti-VEGF/VEGFA antibody PA1080. Let me know if you need anything else.
Verified Customer
Verified customer
Asked: 2020-03-31
Answer
Thanks for the data. You have provided everything we needed. Our lab team are working to resolve your inquiry as quickly as possible, and we appreciate your patience and understanding! Please let me know if there is anything you need in the meantime.
Boster Scientific Support
Answered: 2020-03-31
Question
We bought anti-VEGF/VEGFA antibody for IHC on mammary gland in a previous experiment. I am using mouse, and We want to use the antibody for WB next. We are interested in examining mammary gland as well as hemangioendothelioma in our next experiment. Could you please give me some suggestion on which antibody would work the best for WB?
Verified Customer
Verified customer
Asked: 2020-02-17
Answer
I took a look at the website and datasheets of our anti-VEGF/VEGFA antibody and it appears that PA1080 has been validated on mouse in both IHC and WB. Thus PA1080 should work for your application. Our Boster satisfaction guarantee will cover this product for WB in mouse even if the specific tissue type has not been validated. We do have a comprehensive range of products for WB detection and you can check out our website bosterbio.com to find out more information about them.
Boster Scientific Support
Answered: 2020-02-17
Question
I am interested in to test anti-VEGF/VEGFA antibody PA1080 on human lung for research purposes, then I may be interested in using anti-VEGF/VEGFA antibody PA1080 for diagnostic purposes as well. Is the antibody suitable for diagnostic purposes?
Verified Customer
Verified customer
Asked: 2020-02-07
Answer
The products we sell, including anti-VEGF/VEGFA antibody PA1080, are only intended for research use. They would not be suitable for use in diagnostic work. If you have the means to develop a product into diagnostic use, and are interested in collaborating with us and develop our product into an IVD product, please contact us for more discussions.
Boster Scientific Support
Answered: 2020-02-07
Question
I was wanting to use your anti-VEGF/VEGFA antibody for IHC for human lung on frozen tissues, but I want to know if it has been validated for this particular application. Has this antibody been validated and is this antibody a good choice for human lung identification?
Verified Customer
Verified customer
Asked: 2020-01-30
Answer
You can see on the product datasheet, PA1080 anti-VEGF/VEGFA antibody has been tested for IHC, WB on human, mouse, rat tissues. We have an innovator award program that if you test this antibody and show it works in human lung in IHC-frozen, you can get your next antibody for free.
Boster Scientific Support
Answered: 2020-01-30
Question
I am interested in using your anti-VEGF/VEGFA antibody for eye photoreceptor cell development studies. Has this antibody been tested with western blotting on lung cancer tissue? We would like to see some validation images before ordering.
Verified Customer
Verified customer
Asked: 2020-01-28
Answer
I appreciate your inquiry. This PA1080 anti-VEGF/VEGFA antibody is tested on lung cancer tissue. It is guaranteed to work for IHC, WB in human, mouse, rat. Our Boster guarantee will cover your intended experiment even if the sample type has not been be directly tested.
Boster Scientific Support
Answered: 2020-01-28
Question
Will anti-VEGF/VEGFA antibody PA1080 work on bovine WB with kidney?
Verified Customer
Verified customer
Asked: 2020-01-01
Answer
Our lab technicians have not validated anti-VEGF/VEGFA antibody PA1080 on bovine. You can run a BLAST between bovine and the immunogen sequence of anti-VEGF/VEGFA antibody PA1080 to see if they may cross-react. If the sequence homology is close, then you can perform a pilot test. Keep in mind that since we have not validated bovine samples, this use of the antibody is not covered by our guarantee. However we have an innovator award program that if you test this antibody and show it works in bovine kidney in WB, you can get your next antibody for free.
Boster Scientific Support
Answered: 2020-01-01
Question
Here is the WB image, lot number and protocol we used for lung using anti-VEGF/VEGFA antibody PA1080. Please let me know if you require anything else.
Verified Customer
Verified customer
Asked: 2019-12-26
Answer
Thank you very much for the data. Our lab team are working to resolve this as quickly as possible, and we appreciate your patience and understanding! You have provided everything we needed. Please let me know if there is anything you need in the meantime.
Boster Scientific Support
Answered: 2019-12-26
Question
We are currently using anti-VEGF/VEGFA antibody PA1080 for rat tissue, and we are happy with the WB results. The species of reactivity given in the datasheet says human, mouse, rat. Is it likely that the antibody can work on pig tissues as well?
Verified Customer
Verified customer
Asked: 2019-10-21
Answer
The anti-VEGF/VEGFA antibody (PA1080) has not been tested for cross reactivity specifically with pig tissues, though there is a good chance of cross reactivity. We have an innovator award program that if you test this antibody and show it works in pig you can get your next antibody for free. Please contact me if I can help you with anything.
Boster Scientific Support
Answered: 2019-10-21
Question
Is a blocking peptide available for product anti-VEGF/VEGFA antibody (PA1080)?
Verified Customer
Verified customer
Asked: 2019-10-17
Answer
We do provide the blocking peptide for product anti-VEGF/VEGFA antibody (PA1080). If you would like to place an order for it please contact support@bosterbio.com and make a special request.
Boster Scientific Support
Answered: 2019-10-17
Question
We have observed staining in mouse kidney. Any tips? Is anti-VEGF/VEGFA antibody supposed to stain kidney positively?
Verified Customer
Verified customer
Asked: 2019-07-23
Answer
According to literature kidney does express VEGFA. According to Uniprot.org, VEGFA is expressed in left lobe of thyroid gland, kidney, mammary gland, renal glomerulus, hemangioendothelioma, heart, lung, retina, among other tissues. Regarding which tissues have VEGFA expression, here are a few articles citing expression in various tissues:
Heart, Pubmed ID: 19054851
Kidney, Pubmed ID: 9878851, 12124351
Lung, Pubmed ID: 15489334
Mammary gland, Pubmed ID: 9450968
Renal glomerulus, Pubmed ID: 10464055
Retina, Pubmed ID: 10067980, 11563986
Boster Scientific Support
Answered: 2019-07-23
Question
I see that the anti-VEGF/VEGFA antibody PA1080 works with IHC, what is the protocol used to produce the result images on the product page?
Verified Customer
Verified customer
Asked: 2018-03-05
Answer
You can find protocols for IHC on the "support/technical resources" section of our navigation menu. If you have any further questions, please send an email to support@bosterbio.com
Boster Scientific Support
Answered: 2018-03-05
Question
Is there a BSA free version of anti-VEGF/VEGFA antibody PA1080 available?
Verified Customer
Verified customer
Asked: 2017-10-17
Answer
Thank you for your recent telephone inquiry. I can confirm that some lots of this anti-VEGF/VEGFA antibody PA1080 are BSA free. For now, these lots are available and we can make a BSA free formula for you free of charge. It will take 3 extra days to prepare. If you require this antibody BSA free again in future, please do not hesitate to contact me and I will be pleased to check which lots we have in stock that are BSA free.
Boster Scientific Support
Answered: 2017-10-17
Question
Our team were well pleased with the WB result of your anti-VEGF/VEGFA antibody. However we have seen positive staining in lung secreted using this antibody. Is that expected? Could you tell me where is VEGFA supposed to be expressed?
Verified Customer
Verified customer
Asked: 2017-08-14
Answer
According to literature, lung does express VEGFA. Generally VEGFA expresses in secreted. Regarding which tissues have VEGFA expression, here are a few articles citing expression in various tissues:
Heart, Pubmed ID: 19054851
Kidney, Pubmed ID: 9878851, 12124351
Lung, Pubmed ID: 15489334
Mammary gland, Pubmed ID: 9450968
Renal glomerulus, Pubmed ID: 10464055
Retina, Pubmed ID: 10067980, 11563986
Boster Scientific Support
Answered: 2017-08-14
Question
Can you help my question with product PA1080, anti-VEGF/VEGFA antibody. I was wondering if it would be possible to conjugate this antibody with biotin. I would need it to be without BSA or sodium azide. I am planning on using a buffer exchange of sodium azide with PBS only. Would there be problems for me to conjugate the antibody and store it in -20 degrees in small aliquots?
M. Baker
Verified customer
Asked: 2017-05-25
Answer
We do not advise storing this antibody with PBS buffer only in -20 degrees. If you want to store it in -20 degrees it is best to add some cryoprotectant like glycerol. If you want carrier free PA1080 anti-VEGF/VEGFA antibody, we can provide it to you in a special formula with trehalose and/or glycerol. These molecules will not interfere with conjugation chemistry and provide a good level of protection for the antibody from degradation. Please be sure to specify this in your purchase order.
Boster Scientific Support
Answered: 2017-05-25
Question
Is this PA1080 anti-VEGF/VEGFA antibody reactive to the isotypes of VEGFA?
P. Kulkarni
Verified customer
Asked: 2016-01-26
Answer
The immunogen of PA1080 anti-VEGF/VEGFA antibody is A synthetic peptide corresponding to a sequence at the N-terminus of human VEGF(33-48aa VDIFQEYPDEIEYIFK), identical to the related mouse and rat sequences. Could you tell me which isotype you are interested in so I can help see if the immunogen is part of this isotype?
Boster Scientific Support
Answered: 2016-01-26
Question
Would PA1080 anti-VEGF/VEGFA antibody work on parafin embedded sections? If so, which fixation method do you recommend we use (PFA, paraformaldehyde, other)?
J. Krishna
Verified customer
Asked: 2014-08-07
Answer
You can see on the product datasheet, PA1080 anti-VEGF/VEGFA antibody as been tested on IHC. It is best to use PFA for fixation because it has better tissue penetration ability. PFA needs to be prepared fresh before use. Long term stored PFA turns into formalin, as the PFA molecules congregate and become formalin.
Boster Scientific Support
Answered: 2014-08-07
Question
Does anti-VEGF/VEGFA antibody PA1080 work for IHC with lung?
K. Roberts
Verified customer
Asked: 2013-03-18
Answer
According to the expression profile of lung, VEGFA is highly expressed in lung. So, it is likely that anti-VEGF/VEGFA antibody PA1080 will work for IHC with lung.
Boster Scientific Support
Answered: 2013-03-18
