Click image to see more details
-

-
-
-
-
+37
Product Info Summary
| SKU: | A00052 |
|---|---|
| Size: | 100 μg/vial |
| Reactive Species: | Human, Mouse, Rat |
| Host: | Rabbit |
| Application: | ELISA, Flow Cytometry, IF, IHC, IHC-F, ICC, WB |
Customers Who Bought This Also Bought

Product info
Product Name
Anti-CD44 Antibody Picoband®
SKU/Catalog Number
A00052
Size
100 μg/vial
Form
Lyophilized
Description
CD44 is a cell-surface adhesion receptor (notably for hyaluronan) that supports cell–cell/ECM interactions and migration, with well-described roles in leukocyte trafficking/inflammation and tumor invasion/metastasis (context-dependent). Assay context: phenotyping by flow cytometry, tissue distribution by IHC (including multi-marker co-localization via multiplex IHC), plus WB/IF/ICC for orthogonal confirmation. Often interpreted alongside other adhesion/immune markers such as ICAM1 and macrophage lineage markers like CD163, or vascular/stem-context assays such as Human CD34 ELISA.
Storage & Handling
Store at -20˚C for one year from date of receipt. After reconstitution, at 4˚C for one month. It can also be aliquotted and stored frozen at -20˚C for six months. Avoid repeated freeze-thaw cycles.
Cite This Product
Anti-CD44 Antibody Picoband® (Boster Biological Technology, Pleasanton CA, USA, Catalog # A00052)
Host
Rabbit
Contents
Each vial contains 4mg Trehalose, 0.9mg NaCl, 0.2mg Na2HPO4, 0.05mg NaN3.
Clonality
Polyclonal
Isotype
Rabbit IgG
Immunogen
E. coli-derived human CD44 recombinant protein (Position: Q21-H259).
Cross-reactivity
No cross-reactivity with other proteins.
Reactive Species
A00052 is reactive to CD44 in Human, Mouse, Rat
Observed Molecular Weight
82 kDa
Calculated molecular weight
81.5 kDa
Background of CD44
CD44 is also known as LHR or MC56. The protein encoded by this gene is a cell-surface glycoprotein involved in cell-cell interactions, cell adhesion and migration. It is a receptor for hyaluronic acid (HA) and can also interact with other ligands, such as osteopontin, collagens, and matrix metalloproteinases (MMPs). This protein participates in a wide variety of cellular functions including lymphocyte activation, recirculation and homing, hematopoiesis, and tumor metastasis. Transcripts for this gene undergo complex alternative splicing that results in many functionally distinct isoforms, however, the full length nature of some of these variants has not been determined. Alternative splicing is the basis for the structural and functional diversity of this protein, and may be related to tumor metastasis.
Antibody Validation
Boster validates all antibodies on WB, IHC, ICC, Immunofluorescence, and ELISA with known positive control and negative samples to ensure specificity and high affinity, including thorough antibody incubations.
Application & Images
Applications
A00052 is guaranteed for ELISA, Flow Cytometry, IF, IHC, IHC-F, ICC, WB Boster Guarantee
Recommend Dilution
| Application | Dilution | Species |
|---|---|---|
| Western blot | 0.1-0.5μg/ml | |
| Immunohistochemistry (Paraffin-embedded Section) | 0.5-1μg/ml | |
| Immunohistochemistry (Frozen Section) | 0.5-1μg/ml | |
| Immunocytochemistry | 0.5-1μg/ml | |
| Immunofluorescence | 2μg/ml | |
| Flow Cytometry (Fixed) | 1-3μg/1x106 cells | |
| ELISA | 0.1-0.5μg/ml |
Tested application
Suggested blocking solution with 5% non-fat milk or BSA; (*)Recommended protein loading: 20-40 µg per lane
Use TE buffer pH 9.0 for antigen retrieval; (*) citrate buffer pH 6.0 is an alternative.
Validation Images & Assay Conditions
Click image to see more details
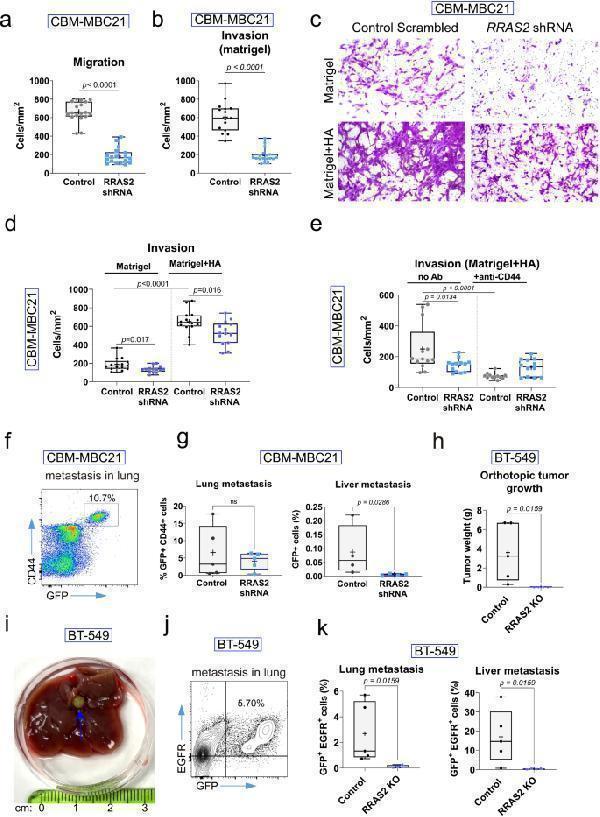
R-RAS2 is downstream of CD44 promoting migratory, invasive and metastatic behavior of breast cancer cells. a , Box and whiskers plot showing all experimental points of a migration assay in Boyden chambers separated by a 8 μm-diameter pore membrane. Cells were incubated overnight (~16 h). Each point represents the mean of cells per surface unit (mm 2 ) of membrane counted. A number of 18 areas of the membrane were counted per experimental condition. Statistical significance was assessed by carrying out a Mann-Whitney test. b , Box and whiskers plot showing all experimental points of a migration assay in Boyden chambers separated by a 8 μm-diameter pore membrane and layered on the upper chamber with 100 μL of Matrigel. Cells were incubated overnight (~16 h). Each point represents the mean of cells per surface unit (mm 2 ) of membrane counted. A number of 18 areas of the membrane were counted per experimental condition. Statistical significance was assessed by carrying out a Mann-Whitney test. c , Light field microscopy of the bottom part of the membrane with 8-μm diameter pores separating an upper Boyden chamber in which CBM-MBC21 control of knockdown cells were seeded in serum-free medium and a lower chamber containing medium with 20% feta bovine serum. In addition, the upper chamber had a layer or either Matrigel or Matrigel + hyaluronic acid directly on top of the membrane. Cells were allowed to migrate for 8 h from the top to the bottom chambers and through the Matrigel or Matrigel + HA layers. The bottom part of the membrane was stained with crystal violet to count the number of migrated cells. d , Box and whiskers plot showing all experimental points of the experiment illustrated in Fig. c. Each point represents the mean of cells per surface unit (mm 2 ) of membrane counted. A number of 14 areas of the membrane were counted per experimental condition. Statistical significance was assessed using unpaired t-tests. e , An invasion assay as this of Fig. 8 b and d, was carried out in Boyden chambers coated in the upper chamber with a layer of Matrigel + hyaluronic acid. Control and knockdown CBM-MBC21 cells were incubated or not (no Ab) with 5 μg/mL of blocking anti-CD44 antibody in the upper chamber for 8 h. Box and whiskers plot showing all experimental points that represent the mean of cells per surface unit (mm 2 ) of membrane counted. A number of 13–14 areas of the membrane were counted per experimental condition. Statistical significance was assessed using a one-way ANOVA Tukey’s multiple comparison test. f , The metastatic capacity of control and knockdown CBM-MBC21 cells 25 days after orthotopic inoculation in the left inguinal mammary gland of female C57BL/6 mice was assessed by flow cytometry of the lungs and liver. The pseudocolor plot shows the identification of metastatic breast cancer cells in the lungs according to the expression of GFP and CD44. g , Box and whiskers plot showing all experimental points calculated as illustrated in Fig. f and Suppl Fig. f referring to BC cell infiltration of lungs and liver, respectively. Each point represents a single mouse. Statistical significance was assessed by carrying out Mann-Whitney tests. h , Box and whiskers plot showing all experimental points indicating primary tumor weight in mice inoculated with BT-549 human BC cells at the day of sacrifice (day 39). Statistical significance was assessed by carrying out a Mann-Whitney test. i , Photograph of the entire liver taken from a mouse inoculated with wild type BT-549, control, BC cells. The blue arrow points at the presence of a green fluorescent BC tumor nodule. j , The metastatic capacity of control and knockdown BT-549 cells 39 days after orthotopic inoculation in the left inguinal mammary gland of female Rag2 −/− γc −/− mice was assessed by flow cytometry of the lungs and liver. The two-color plot shows the identification of metastatic breast cancer cells in the lungs according to the expression of GFP and human EGFR. k , Box and whiskers plot showing all experimental points calculated as illustrated in Fig. j referring to BC cell infiltration of lungs and liver. One out of four liver lobules per animal were processed for flow cytometry analysis. Each point represents a single mouse. Statistical significance was assessed by carrying out Mann-Whitney tests
Index in PubMed under a CC BY license. PMID: 40221767

Click image to see more details
Western blot analysis of CD44 using anti-CD44 antibody (A00052).
Electrophoresis was performed on a 5-20% SDS-PAGE gel at 70V (Stacking gel) / 90V (Resolving gel) for 2-3 hours. The sample well of each lane was loaded with 30 ug of sample under reducing conditions.
Lane 1: human U251 whole cell lysates,
Lane 2: rat lung tissue lysates,
Lane 3: rat small intestine tissue lysates,
Lane 4: mouse lung tissue tissue lysates.
After electrophoresis, proteins were transferred to a nitrocellulose membrane at 150 mA for 50-90 minutes. Blocked the membrane with 5% non-fat milk/TBS for 1.5 hour at RT. The membrane was incubated with rabbit anti-CD44 antigen affinity purified polyclonal antibody (Catalog # A00052) at 0.5 μg/mL overnight at 4°C, then washed with TBS-0.1%Tween 3 times with 5 minutes each and probed with a goat anti-rabbit IgG-HRP secondary antibody at a dilution of 1:5000 for 1.5 hour at RT. The signal is developed using an Enhanced Chemiluminescent detection (ECL) kit (Catalog # EK1002) with Tanon 5200 system. A specific band was detected for CD44 at approximately 82 kDa. The expected band size for CD44 is at 82 kDa.

Click image to see more details
R-RAS2 controls PI3K/Akt, ERK/MAPK and mTORC1 pathway activation in murine RRAS2-overexpressing breast cancer cells. a , Cartoon illustrating RAS/ERK/MAPK, PI3K/Akt and mTORC1 pathway activation by Receptor Tyrosine Kinases (RTKs) like EphaA2, EGFR or HER2, and by amino acid transporters like the CD98hc/CD98lc(LAT1) complex, and by CD44. The positions of some relevant phosphorylated residues are indicated, as well as the putative position of R-RAS2 downstream of the RTKs, CD44 and CD98. b , Western blot analysis of signaling pathway activity based on the phosphorylation of key residues in the elements indicated. Post-nuclear cell lysates of wild type CBM-MBC21 cells and a shRNA-generated RRAS2 knockdown of that cell line were analyzed in the blots. c , Summary of the results generated by Western blot. The inhibitory effect of R-RAS2 depletion is indicated by the number of arrows pointing downwards
Index in PubMed under a CC BY license. PMID: 40221767

Click image to see more details
Representative images of the expression of caspase-3, Bax, Bcl-2, Ki67, VEGFA, VEGFR-2, MDA, CD24, CD44, ALDH1A1, EpCam, H3K4m3, H3K9m3, H4K20m3, H4K16ac in rat carcinoma tissue of mammary gland. For detection, polyclonal caspase-3 antibody (Bioss, Woburn, USA), polyclonal Bax and Bcl-2 antibodies (Santa Cruz Biotechnology, Paso Robles, CA, USA), monoclonal Ki67 antibody (Dako, Glostrup, Denmark), monoclonal VEGFA and VEGFR-2 antibodies (Santa Cruz Biotechnology, Paso Robles, CA, USA), polyclonal CD24 antibody (GeneTex, Irvine, CA, USA), polyclonal CD44 antibody (Boster, Pleasanton, CA, USA), polyclonal ALDH1A1 antibody (ThermoFisher, Rockford, IL, USA), polyclonal MDA, EpCAM, H3K4m, H3K9m3, and H4K20m3 antibodies (Abcam, Cambridge, MA, USA), and monoclonal H4K16ac antibody (Abcam, Cambridge, MA, USA) were applied; final magnification: ×400.
Index in PubMed under a CC BY license. PMID: 39435289

Click image to see more details
R-RAS2 interacts with plasma membrane receptors known to be important for breast cancer. a , Selected list of plasma membrane proteins that interact with R-RAS2 in a murine breast cancer tumor isolated from a Rosa26- RRAS2 fl/fl x Wap-Cre female mouse. Full data can be found in Extended Data Table . The known involvement of these proteins in cancer and breast cancer is briefly summarized, and the Mascot Score for the specific affinity column with anti-hemagglutinin (for hemagglutinin-tagged R-RAS2) and a control isotypic immunoglobulin column is also shown. Protein function and association with cancer data have been retrieved from The Human Protein Atlas: . b , Biological processes and pathways found to be significantly altered after KEGG analysis of the R-RAS2 plasma membrane interactome of Extended Data Table . The x-axis shows the percentage or proteins in the pathway found associated to R-RAS2 and the y-axis the–Log10 of the P adjusted value. Full data is provided in Extended Data Table . c , STRING network of physical and functional interactions among the indicated proteins from Fig. a. Pink lines indicate experimentally-determined interactions; blue lines indicated interactions found in curated databases; green lines indicate interactions found by textmining and black lines indicate co-expression. d , Co-immunoprecipitation of CD44, Epha2 and Slc3a2 (CD98hc) with R-RRAS2 (IP anti-Hag) was studied in detergent lysates of the CBM-MBC21 mouse cell line. The membranes were re-probed with anti-Hag as a control for loading of R-RAS2, and the arrows indicate the positions of the co-immunoprecipitated proteins and those in the whole cell lysate (WCL). The molecular weight markers are shown on the left. e , Co-immunoprecipitation of CD44, Epha2 and Slc3a2 (CD98hc) with R-RRAS2 in detergent lysates of the human breast cancer cell line BT-549 transfected with a Hag-tagged R-RAS2 construct. Legend as in panel d . f , Mid-plane confocal microscopy sections of CBM-MBC21 cells fixed and stained with R-RAS2 (anti-Hag) and anti-CD44 antibodies to show their co-localization at the plasma membrane. The nucleus of the cells is stained with DAPI (blue). Details of 4 areas of the plasma membranes are shown to the right to show the co-localization of R-RAS2 with CD44 in cell protrusions. g , Co-localization of R-RAS2 and CD44 was measured by analysis of all pixels in 23 cell protusions as in the inset of Fig. f and calculating the Pearson’s correlation coefficient. The violin plot shows all data points, the median (= 0.70) and the 75% and 25% percentiles. h , Mid-plane confocal microscopy sections of CBM-MBC21 cells fixed and stained with R-RAS2 (anti-Hag) and anti-CD98hc antibodies to show their co-localization at the plasma membrane. The nucleus of the cells is stained with DAPI (blue). Details of 4 areas of the plasma membranes are shown to the right to show the co-localization of R-RAS2 with CD98hc at the external (apical) plasma membrane of the cell aggregate. i , Co-localization of R-RAS2 and CD98hc was measured by analysis of all pixels in 25 membrane regions as in the inset of Fig. h and calculating the Pearson’s correlation coefficient. The violin plot shows all data points, the median (= 0.69) and the 75% and 25% percentiles
Index in PubMed under a CC BY license. PMID: 40221767

Click image to see more details
R-RAS2 co-localizes with CD44 in F-actin-rich cell protrusions of breast cancer cells. a , Confocal microscopy sections at the plane of contact with the coverslips of CBM-MBC21 control and knockdown cells plated on coverslips coated with poly-L-lysine alone or with poly-L-lysine plus hyaluronic acid (HA). Cells were plated in the presence or absence of a blocking anti-CD44 antibody. After incubation, cells were fixed and stained with R-RAS2 (anti-Hag) and phalloidin to show their co-localization at sites rich in F-actin. The nucleus of the cells is stained with DAPI (blue). b , Co-localization of R-RAS2 and F-actin at cell protrusions was measured by analysis of all pixels in 17–33 cell protrusions and calculating the Pearson’s correlation coefficient. The violin plot shows all data points, the median and the 75% and 25% percentiles for each condition. Statistical significance was assessed using a one-way ANOVA Tukey’s multiple comparison test. ***, p < 0.001, ****, p < 0.0001. c , Cell area at the contact site with the coverslip in the experiment of Fig. a-b, was calculated for 7–28 cells per condition. The violin plot shows all data points, the median and the 75% and 25% percentiles for each condition. Statistical significance was assessed using a one-way ANOVA Tukey’s multiple comparison test. *, p = 0.03; **, p = 0.008; ***, p = 0.0003; ****, p < 0.0001. d , The number and distance to the center of cell protrusions were measured in phalloidin stains by calculating the center of mass and drawing lines (yellow) from the center to the tip of cell protrusions. e , The number of protrusions was calculated as in Fig. d for a minimum of 15 cells per culture condition. The violin plot shows all data points, the median and the 75% and 25% percentiles for each condition. Statistical significance was assessed using a one-way ANOVA Tukey’s multiple comparison test. *, p < 0.05; **, p = 0.002; ****, p < 0.0001. f , The distance to the cell center of mass of protrusions was calculated as in Fig. d for a minimum of 100 cell protrusions per culture condition. The violin plot shows all data points, the median and the 75% and 25% percentiles for each condition. Statistical significance was assessed using a one-way ANOVA Tukey’s multiple comparison test. *, p < 0.05; ****, p < 0.0001
Index in PubMed under a CC BY license. PMID: 40221767

Click image to see more details
CD44 is upregulated in TECs and associated with mitochondrial dysfunction and apoptosis. A UMAP shows cell population in kidneys of sham and IRI at 6 h and day 2. PT proximal tubule, PT-Inj injured PT, PT-R repairing PT, FR-PTC failed repair PT cell, PT-AcInj acute injury PT, DTL descending limb of loop of Henle (LoH), ATL thin ascending limb of LoH, TAL thick ascending limb of LoH, DCT distal convoluted tubule, CNT connecting tubule, PC principal cell of collecting duct, ICA type A intercalated cell of collecting duct, ICB type B intercalated cell of collecting duct, Pod podocyte, EC endothelial cell, Fib fibroblast, Myofib myofibroblast, Ma macrophage (Mφ), B/T immune cell, Uro urothelium. Data from PMID: 36265491. B Graphic presentation of single-cell sequencing analysis shows the expression of CD44 in different cell populations. C Graphic presentation of single-cell sequencing analysis shows the expression of CD44 at different time point. D and E Representative western blot of CD44 ( D ) and graphical presentations ( E ) of protein expressional levels are shown. ** P < 0.01 versus sham group ( n = 5). F Representative micrographs show the expression of CD44 in sham and IRI groups, as indicated. Frozen kidney sections were stained with an antibody against CD44. Arrow indicates positive staining. Scale bar, 50 μm. G Co-localization staining of CD44 and various segment-specific tubular markers in the kidneys of the IRI model. Frozen kidney sections were collected from the mice 1 day after IRI. CD44 (red) and various segment-specific tubular markers (green), including LTL, PNA, and DBA, were detected by immunofluorescence. Arrows indicate positive staining. Scale bar, 50 μm. H GO analysis of CD44-related pathway through STRING ( ). I Co-localization of CD44 and TOMM20 in tubules. Frozen renal sections were subjected to immunostaining of CD44 (red) and TOMM20 (green). Scale bar, 50 μm. J Co-localization of CD44 and cleaved caspase 3 in IRI group. Frozen kidney sections were subjected to immunostaining of CD44 (red) and cleaved caspase 3 (green). Scale bar, 50 μm.
Index in PubMed under a CC BY license. PMID: 39979265

Click image to see more details
The anti-leukemic effect of Ara-C@HSPC-Lipo in Ka539 leukemia model. a Schematic illustration of animal experiment design. Cell membranes were derived from primary isolated HSPCs. Each received approximately 20 μg of liposomes and 10 μg of cell membrane. b Representative flow cytometry plots of leukemia cells (GFP positive cells) in bone marrow. Leukemic mice were euthanized at day 28 to collect bone marrow cells for analysis. c Quantitative analysis of leukemia cells in bone marrow. Data were presented as mean ± s.d. ( n = 5 mice). d Quantitative analysis of leukemia cells in spleen. Data were presented as mean ± s.d. ( n = 5 mice). e Weight of Spleen. Data were presented as mean ± s.d. ( n = 5 mice). f Survival curves of the leukemic mice received different treatments. The statistics and P -values were calculated using the Log-rank (Mantel-Cox) test. ( n = 6 mice for control, HSPC-Lipo and Ara-C group, and n = 8 mice for Ara-C@Lipo, and n = 12 mice for Ara-C@HSPC-Lipo group). Statistical significance of P values was calculated via a two-tailed, unpaired Student’s t test and were indicated as * P < 0.05, ** P < 0.01 and *** P < 0.001. Source data are provided as a Source Data file.
Index in PubMed under a CC BY license. PMID: 38971796

Click image to see more details
Gene ablation of CD44 attenuates renal tubular cell apoptosis and kidney injury upon IRI. A Experimental design: Wild-type mice and CD44 conventional knockout mice were subjected to IRI or sham, respectively, and euthanized 24 h after IRI. B Scr levels in four groups, as indicated. Scr was expressed as milligrams per deciliter. ** P < 0.01 versus wild-type mice upon sham group; ## P < 0.01 versus wild-type mice upon IRI group ( n = 5). C BUN levels in four groups, as indicated. BUN was expressed as milligrams per deciliter. *** P < 0.001 versus wild-type mice upon sham group; ## P < 0.01 versus wild-type mice upon IRI group ( n = 5). D and E Representative western blot of CD44 ( D ) and graphical presentations ( E ) of protein expressional levels are shown. ** P < 0.01 versus wild-type mice upon sham group; ### P < 0.001 versus wild-type mice upon IRI group ( n = 5). F Representative micrographs show the expression of CD44 in different groups, as indicated. Frozen kidney sections were stained with an antibody against CD44. Arrow indicates positive staining. Scale bar, 50 μm. G GO analysis shows CD44 is involved with several important pathways, including MAPK, NF-κB, apoptosis, mitochondria and FAO. H GSEA shows that negative regulation of apoptosis was enriched in CD44 knockout mice versus wild-type mice upon IRI. NES, normalized enrichment score; FDR q-value < 0.25. I–L Representative western blot ( I ) and graphical presentations of J BAX, K BCL2, and L cleaved caspase 3 protein expressional levels are shown. * P < 0.05, *** P < 0.001 versus wild-type mice upon sham group; # P < 0.05, ## P < 0.01, ### P < 0.001 versus wild-type mice upon IRI group ( n = 5). M Representative micrographs show TUNEL assay in different groups, as indicated. Frozen kidney sections were subjected to TUNEL assay. Parrafin sections were performed by immunohistochemistry staining of NGAL. Arrow indicates positive staining. Scale bar, 50 μm. N and O Representative western blot of NGAL ( N ) and graphical presentations ( O ) of protein expressional levels are shown. *** P < 0.001 versus wild-type mice upon sham group; ### P < 0.001 versus wild-type mice upon IRI group ( n = 5).
Index in PubMed under a CC BY license. PMID: 39979265

Click image to see more details
CD44 knockout ameliorates mitochondrial dysfunction and FAO deficiency in IRI mice. A GSEA shows that positive regulation of mitochondrial function and FAO was enriched in CD44 knockout mice versus wild-type mice upon IRI. NES, normalized enrichment score; FDR q -value < 0.25. B Graphic presentation shows the relative levels of renal expression of PGC-1α mRNA in different groups as indicated. *** P < 0.001 versus wild-type mice upon sham group; # P < 0.05 versus wild-type mice upon IRI group ( n = 5). C Graphic presentation shows the relative levels of ATP production in 2 groups as indicated. ** P < 0.01 versus wild-type upon IRI group ( n = 5). D and E Representative western blot ( D ) and graphical presentations of PGC-1α and TOMM20 protein expression levels are shown. ** P < 0.01, *** P < 0.001 versus wild-type mice upon sham group; ## P < 0.01, ### P < 0.001 versus wild-type mice upon IRI group ( n = 5). F Co-localization of CD44 and PGC-1α in CD44 gene ablation mice upon IRI. Frozen kidney sections were subjected to immunostaining of CD44 (red) and PGC-1α (green). Scale bar, 50 μm. G Representative micrographs show the expression of PGC-1α, TOMM20, mitochondrial morphology via TEM, and mitochondrial ROS via MitoSox staining in different groups, as indicated. Arrows indicate positive staining or impaired mitochondria. Scale bar, 50 or 1 μm, as indicated. H Graphic presentation shows the relative mRNA levels of renal expression of PPARα, CPT1, CPT2, and ACOX1 mRNA in different groups as indicated. ** P < 0.01, *** P < 0.001 versus wild-type mice upon sham group; # P < 0.05, ## P < 0.01 versus wild-type mice upon IRI group ( n = 5). I Representative micrographs show the abundance of LDs via TEM in 2 groups, as indicated. Arrows indicate LDs. Scale bar, 1 μm. J and K Representative western blot ( J ) and graphical presentations of CPT1a and PPARα protein expression levels are shown. * P < 0.05, ** P < 0.01 versus wild-type mice upon sham group; # P < 0.05, ## P < 0.01 versus wild-type mice upon IRI group ( n = 5). L Representative micrographs show the expression of PPARα, CPT1a, perilipin 2, and LDs via Oil Red O staining in different groups, as indicated. Arrows indicate positive staining. Frozen kidney sections were subjected to Oil Red O staining or stained with antibodies against PPARα, CPT1a, and perilipin 2. Scale bar, 50 μm.
Index in PubMed under a CC BY license. PMID: 39979265

Click image to see more details
CD44 promotes AKI progression through inducing MAPK and NF-κB p65 signaling. A Representative heatmap gene expression of RNA sequencing analysis shows that CD44 is involved with MAPK and NF-κB signaling pathway. B and C GSEA shows that negative regulation of MAPK and NF-κB pathway was enriched in CD44 knockout mice versus wild-type mice upon IRI. NES, normalized enrichment score; FDR q -value < 0.25. D Representative micrographs show the expression of p-ERK1/2 and p-p38 in different groups, as indicated. Paraffin sections were stained with antibodies against p-ERK1/2 and p-p38. Arrows indicate positive staining. Scale bar, 50 μm. E and F Representative western blot ( E ) and graphical presentations of p-p38/p38 and p-ERK1/2/ERK1/2 protein levels are shown. ** P < 0.01, *** P < 0.001 versus wild-type mice upon sham group; # P < 0.05, ### P < 0.001 versus wild-type mice upon IRI group ( n = 5). G Co-localization of CD44 and p65 in 2 groups, as indicated. Frozen kidney sections were subjected to immunostaining of CD44 (red) and p65 (green). Scale bar, 50 μm. H and I Representative western blot ( H ) and graphical presentations of p-p65, p65, and p-p65/p65 protein levels are shown. ** P < 0.01, *** P < 0.001 versus wild-type mice upon sham group; # P < 0.05, ## P < 0.01, ### P < 0.001 versus wild-type mice upon IRI group ( n = 5).
Index in PubMed under a CC BY license. PMID: 39979265

Click image to see more details
Transcriptome analysis reveals mechanisms of Ara-C@HSPC-Lipo treatment. a Volcano plot of differential gene expression in Ka539 cells. b Heat map of clustering analysis of differential gene in Ka539 cells. c Volcano plot of differential gene expression in C1498 cells. d Heat map of clustering analysis of differential gene in C1498 cells. e GO pathway enrichment analysis in Ka539 cells. f GO pathway enrichment analysis in C1498 cells. g KEGG enrichment analysis in Ka539 cells. h KEGG enrichment analysis in C1498 cells. i Enrichment analysis of GSEA gene set in C1498 cells. The statistical analyzes of P values were derived from a two-sided statistical test ( a, c ) or one-sided statistical test ( e – i ) and without adjustment for multiple comparisons.
Index in PubMed under a CC BY license. PMID: 38971796

Click image to see more details
Ectopic CD44 aggravates tubular cell apoptosis and kidney injury in IRI mice. A Experimental design: Green arrow indicated the injection of pcDNA3 plasmid or p-HA-CD44 overexpression plasmid. Mice were subjected to IRI surgery or sham surgery, respectively, as shown in the red arrow. Mice are euthanized 24 h after surgery. B Scr levels in three groups, as indicated. Scr was expressed as milligrams per deciliter. * P < 0.05 versus sham group; # P < 0.05 versus IRI group injected with pcDNA3 ( n = 5). C BUN levels in three groups, as indicated. BUN was expressed as milligrams per deciliter. ** P < 0.01 versus sham group; # P < 0.05 versus IRI group injected with pcDNA3 ( n = 5). D and E Representative western blot of CD44 ( D ) and graphical presentations ( E ) of protein levels are shown. ** P < 0.01 versus sham group; # P < 0.05 versus IRI group injected with pcDNA3 ( n = 5). F Representative micrographs show the expression of CD44, and TUNEL assay in different groups, as indicated. Arrows indicate positive staining. Frozen kidney sections were subjected to TUNEL assay or stained with an antibody against CD44. Scale bar, 50 μm. G–J Representative western blot ( G ) and graphical presentations of H BCL2, I BAX, and J cleaved caspase 3 protein expression levels are shown. * P < 0.05, ** P < 0.01 versus sham group; # P < 0.05, ### P < 0.001 versus IRI group injected with pcDNA3 ( n = 5). K and L Representative western blot of NGAL ( K ) and graphical presentations ( L ) of protein levels are shown. ** P < 0.01 versus sham group; ## P < 0.01 versus IRI group injected with pcDNA3 ( n = 5). M Representative micrographs show renal tubular morphologic injury and the expression of KIM-1 in different groups, as indicated. Paraffin sections were subjected to PAS staining, and were stained with an antibody against KIM-1. Arrows indicate positive staining. Scale bar, 50 μm.
Index in PubMed under a CC BY license. PMID: 39979265

Click image to see more details
Safety evaluation and analysis of HSPC-Lipo. a Schematic illustration of animal experiment design. b Body weight of mice in different treatment groups. Data represent the mean ± s.d. ( n = 6 mice). c Quantitative analysis of hematopoietic stem progenitor cells in total mononuclear cells. d Quantitative analysis of progenitor cells in total mononuclear cells. e Quantitative analysis of lineage cells in total mononuclear cells. f Quantitative analysis of absolute number of hematopoietic stem progenitor cells per legs of tibia and femur. g Quantitative analysis of absolute number of progenitor cells per legs of tibia and femur. h Quantitative analysis of absolute number of lineage cells per legs of tibia and femur. n = 6 mice ( c - h ). The data represent the mean ± s.d ( c – h ). Statistical significance of P values was calculated via a two-tailed, unpaired Student’s t test and were indicated as * P < 0.05, ** P < 0.01 and *** P < 0.001. Source data are provided as a Source Data file.
Index in PubMed under a CC BY license. PMID: 38971796

Click image to see more details
Ectopic expression of CD44 impairs mitochondrial function and FAO through activating MAPK and NF-κB p65 signaling. A Representative micrographs show the expression of p-ERK1/2 and p-p38 in different groups, as indicated. Paraffin sections were stained with antibodies against p-ERK1/2 and p-p38. Arrows indicate positive staining. Scale bar, 50 μm. B and C Representative western blot ( B ) and graphical presentations of p-ERK1/2/ERK1/2 and p-p38/p38 protein levels are shown. ** P < 0.01, *** P < 0.001 versus sham group; ## P < 0.01, ### P < 0.001 versus IRI group injected with pcDNA3 ( n = 5). D Co-localization of CD44 and p65 in CD44 overexpression mice upon IRI. Frozen renal sections were subjected to immunostaining of CD44 (red) and p65 (green). Scale bar, 50 μm. E and F Representative western blot ( E ) and graphical presentations of p-p65, p65, and p-p65/p65 protein levels are shown. ** P < 0.01, *** P < 0.001 versus sham group; ## P < 0.01, ### P < 0.001 versus IRI group injected with pcDNA3 ( n = 5). G Co-localization of CD44 and PGC-1α in CD44 overexpression mice upon IRI. Frozen renal sections were subjected to immunostaining of CD44 (red) and PGC-1α (green). Scale bar, 50 μm. H and I Representative western blot ( H ) and graphical presentations of PGC-1α, TOMM20, PPARα, and CPT1a protein expression levels are shown. ** P < 0.01, *** P < 0.001 versus sham group; # P < 0.05, ## P < 0.01 versus IRI group injected with pcDNA3 ( n = 5). J Representative micrographs show the expression of perilipin 2, and LDs via Oil Red O staining in different groups, as indicated. Frozen kidney sections were subjected to Oil Red O staining or stained with an antibody against perilipin 2. Arrows indicate positive staining. Scale bar, 50 or 100 μm.
Index in PubMed under a CC BY license. PMID: 39979265

Click image to see more details
Morphology of neuron-like cells derived from rat bone marrow mesenchymal stem cells. (A, D–F) Inverted phase-contrast microscope, × 100; (B, C) immunocytochemical staining, × 400. (A) Passage 3 bone marrow mesenchymal stem cells. (B) Bone marrow mesenchymal stem cells were positive for CD44 (arrow, cytoplasmic staining was brown-yellow). (C) Bone marrow mesenchymal stem cells were negative for CD34. (D) Neuron-like cells (arrow) derived from rat bone marrow mesenchymal stem cell induced by basic fibroblast growth factor 8 and Xiangdan injection for 3 hours. (E) Neuron-like cells (arrow) derived from rat bone marrow mesenchymal stem cells induced by basic fibroblast growth factor 8, all-trans retinoic acid and glial cell line-derived neurotrophic factor for 6 days. (F) Neuron-like cells (arrow) derived from rat bone marrow mesenchymal stem cells induced by basic fibroblast growth factor, sonic hedgehog and fibroblast growth factor 8 for 12 days.
Index in PubMed under a CC BY license. PMID: 25206684

Click image to see more details
CD44 aggravates mitochondrial and FAO dysfunction and drives cell apoptosis through MAPK and NF-κB p65 signaling in vitro. A and B HKC-8 was transfected with Ctrl-shR or CD44-shR and then were incubated in basal culture medium in a 1% O 2 environment for 24 h and then were reoxygenated in normal O 2 for 6 h. Representative western blot ( A ) and graphical presentations of p-p38/p38, p-ERK1/2/ERK1/2, and p-p65 protein expression levels are shown. ** P < 0.01 versus Crtl-shR group; ## P < 0.01, ### P < 0.001 versus H/R with Crtl-shR group ( n = 3). C Representative micrographs show the expression of p-p65 and MitoSox staining in different groups, as indicated. Arrows indicate positive staining. Cells cultured on coverslips were stained with an antibody against p-p65 or were stained with MitoSox. Scale bar, 25 or 50 μm. D Graphic presentation shows the relative mRNA levels of PGC-1α in different groups as indicated. ** P < 0.01 versus Crtl-shR group; ## P < 0.01 versus H/R with Crtl-shR group ( n = 3). E and F Representative western blot ( E ) and graphical representations of PGC-1α, TOMM20, CPT1a, and PPARα protein expression levels are shown. * P < 0.05, ** P < 0.01 versus Crtl-shR group; # P < 0.05, ## P < 0.01 versus H/R with Crtl-shR group ( n = 3). G Representative micrographs show Nile Red staining and TUNEL assay in different groups, as indicated. Arrows indicate positive staining. Cells cultured on coverships were stained with Nile Red or TUNEL assay. Scale bar, 25 or 50 μm. H Co-localization of CD44 and cleaved caspase 3 in HKC-8 after H/R treatment. Cells cultured on coverships were subjected to immunostaining of CD44 (red) and cleaved caspase 3 (green). Scale bar, 50 μm. I and J Representative western blot ( I ) and graphical representations of BCL2, BAX, and cleaved caspase 3 protein expression levels are shown. ** P < 0.01 versus Crtl-shR group; # P < 0.05 versus H/R with Crtl-shR group ( n = 3). K and L HKC-8 was transfected with pcDNA3 or p-HA-CD44 overexpression plasmid and then were incubated in basal culture medium in a 1% O 2 environment for 24 h and then were reoxygenated in normal O 2 for 6 h. Representative western blot ( K ) and graphical representations of CD44, p-ERK1/2/ERK1/2, p-p38/p38 and p-p65 protein expression levels are shown. * P < 0.05, ** P < 0.01, *** P < 0.001 versus pcDNA3 group; # P < 0.05, ## P < 0.01 versus H/R with pcDNA3 group ( n = 3). M and N Representative western blot ( M ) and graphical presentations of PGC-1α, CPT1a, and PPARα protein expression levels are shown. * P < 0.05, *** P < 0.001 versus pcDNA3 group; # P < 0.05 versus H/R with pcDNA3 group ( n = 3). O Representative micrographs show MitoSox staining in different groups, as indicated. Arrow indicates positive staining. Cells cultured on coverships were stained with MitoSox. Scale bar, 25 μm. P and Q Representative western blot ( P ) and graphical representations of BCL2, BAX, and cleaved caspase 3 protein expression levels are shown. * P < 0.05, ** P < 0.01 versus pcDNA3 group; # P < 0.05; ## P < 0.01 versus H/R with pcDNA3 group ( n = 3).
Index in PubMed under a CC BY license. PMID: 39979265

Click image to see more details
CD44 induces tubular cell injury through MAPK-NF-κB p65-silenced PGC-1α signaling. A and B HKC-8 was transfected with pcDNA3 or p-Flag-p65 overexpression plasmid for 24 h. Representative western blot ( A ) and graphical presentations of PGC-1α, CPT1a, BCL2, and cleaved caspase 3 protein expression levels are shown. * P < 0.05, ** P < 0.01, *** P < 0.001 versus pcDNA3 groups ( n = 3). C Quantitative PCR result showing relative mRNA level of PGC-1α. * P < 0.05 versus pcDNA3 groups ( n = 3). D Representative ChIP assay results showing the binding of p65 to PGC-1α gene promoter region. HKC-8 cells were transfected with pcDNA3 or p-Flag-p65 for 24 h. Cell lysates were precipitated with an antibody against p65, histone H3, or nonimmune IgG, and ChIP assay was performed for PGC-1α gene promoters. Total diluted lysate was used as total genomic input DNA. E–I HKC-8 was pre-treated with SB203580, PD98059 or PDTC at 1 h before transfection with pcDNA3 or p-HA-CD44 plasmid for 24 h. Representative western blot ( E ) and graphical presentations of F p-p38/p38, G p-ERK1/2/ERK1/2, H p-p65, and I PGC-1α protein expression levels are shown. ** P < 0.01, *** P < 0.001 versus pcDNA3 group; # P < 0.05, ## P < 0.01 versus pHA-CD44 group; †† P < 0.01, ††† P < 0.001 versus pHA-CD44 group; φφφ P < 0.001 versus pHA-CD44 group ( n = 3). J The heatmap exhibiting differentiated lipids of lipidomics sequencing between H/R with Crtl-shR group and H/R with CD44-shR group.
Index in PubMed under a CC BY license. PMID: 39979265

Click image to see more details
The expression of CD44 in RMG-I and RMG-I-H cells detected by immunocytochemistry (×400) . Panels 1 and 5 are negative controls; panels 2 and 6 are Lewis y antibody-untreated cells; panels 3 and 7 are Lewis y antibody-treated cells; panels 4 and 8 are cells treated by irrelevant isotype-matched control. The expression of CD44 was detected by SABC methods in RMG-I and RMG-I-H cells, and brown color degree by DAB staining indicated the expression level of CD44. It can be seen from the figure that the expression of CD44 in the RMG-I-H cells was stronger than that in RMG-I cells, which was decreased after Lewis y antibody blocking.
Index in PubMed under a CC BY license. PMID: 21294926

Click image to see more details
CD44 promotes tubular cell injury and AKI partially through ferroptosis. A HKC-8 was transfected with Ctrl-shR or CD44-shR plasmid and then treated with 5 μM erastin for 24 h. Representative micrographs show the Fe 2+ content via FerroOrange staining in different groups, as indicated. Scale bar, 25 μm. B and C Quantitative results of QPCR showing relative ( B ) GPX4 and ( C ) ACSL4 mRNA levels among different groups. ** P < 0.01 versus Ctrl-shR group; # P < 0.05 versus erastin with ctrl-shR ( n = 3). D HKC-8 was transfected with pcDNA3 or pHA-CD44 overexpression plasmid and then treated with 5 μM erastin for 24 h. Representative micrographs show the Fe 2+ content via FerroOrange staining in different groups, as indicated. Scale bar, 25 μm. E and F Quantitative result of QPCR showing relative ( E ) GPX4 and ( F ) ACSL4 mRNA levels among different groups. *** P < 0.001 versus pcDNA3 group; # P < 0.05 versus erastin with pcDNA3 ( n = 3). G Representative micrographs show the Fe 2+ content via FerroOrange staining in different groups, as indicated. Scale bar, 25 μm. H and I Quantitative result of QPCR showing relative H GPX4 and I ACSL4 mRNA level among different groups. *** P < 0.001 versus Ctrl-shR group; ## P < 0.01, ### P < 0.001 versus H/R with ctrl-shR ( n = 3). J Quantitative result showing MDA content among different groups. *** P < 0.001 versus Ctrl-shR group; # P < 0.05 versus H/R with ctrl-shR ( n = 3). K and L Quantitative result of QPCR showing relative ( K ) GPX4 and ( L ) ACSL4 mRNA levels among different groups. *** P < 0.001 versus pcDNA3 group; # P < 0.05 versus H/R with pcDNA3 ( n = 3). M Quantitative result showing MDA content among different groups. *** P < 0.001 versus pcDNA3 group; # P < 0.05 versus H/R with pcDNA3 ( n = 3). N Representative micrographs show the Fe 2+ content via FerroOrange staining in different groups, as indicated. Scale bar, 25 μm. O Quantitative result showing total iron content in kidney tissue among different groups. *** P < 0.001 versus wild-type mice upon sham group; ## P < 0.01 versus wild-type mice upon IRI group ( n = 5). P and Q Quantitative result of QPCR showing relative P GPX4 and Q ACSL4 mRNA levels among different groups. ** P < 0.01, *** P < 0.001 versus wild-type mice upon sham group; # P < 0.05, ## P < 0.01 versus wild-type mice upon IRI group ( n = 5). R Quantitative result showing MDA content in kidney tissue among different groups. ** P < 0.01 versus wild-type mice upon sham group; # P < 0.05 versus wild-type mice upon IRI group ( n = 5). S Quantitative result showing total iron content in kidney tissue among different groups. *** P < 0.001 versus sham group; ## P < 0.01 versus IRI group injected with pcDNA3 ( n = 5). T and U Quantitative result of QPCR showing relative S GPX4 and T ACSL4 mRNA level among different groups. *** P < 0.001 versus sham group; # P < 0.05 versus IRI group injected with pcDNA3 ( n = 5). V Quantitative result showing MDA content in kidney tissue among different groups. *** P < 0.001 versus sham group; ### P < 0.001 versus IRI group injected with pcDNA3 ( n = 5).
Index in PubMed under a CC BY license. PMID: 39979265

Click image to see more details
Characterization and bone marrow targeting of HSPC-Lipo. a The representative TEM images of HSPC-Lipo. Scale bar, 100 nm. b The average particle size distribution of HSPC-Lipo. Measured by Dynamic Light Scattering. c The representative immunofluorescence confocal images of co-localization of HSPC cell membrane and liposome. HSPC cell membrane was labeled with DiO (green), liposome was labeled with DiD (red). Scale bar, 5 μm. d Representative fluorescence images of ICG fluorescent labeled different leukocyte membrane-coated liposomes in leukemic mice (Ka539 model). Mice were subjected to in vivo imaging detection at different time intervals (2, 6, 12, 24 hours) after tail vein injection of different liposomes. Each received approximately 20 μg of liposomes and 10 μg of cell membrane (indicated by total cell membrane protein weight). n = 3 mice. e Representative fluorescence images of different leukocyte membrane-coated liposomes in the tibia and femur of mice. Mice were sacrificed at 24 h after tail vein injection of different liposomes, the tibia and femur were taken for in vivo imaging detection. n = 3 mice. f Quantitative analysis of different liposomes in tibia and femur. Data were presented as mean ± s.d. ( n = 3 mice). g Representative immunofluorescence images of HSPC-Lipo in bone marrow. Scale bar, 20 μm. h Quantitative analysis of immunofluorescence results. The data were presented as mean ± s.d. ( n = 3 mice). Statistical significance of P values was calculated via a two-tailed, unpaired Student’s t test and were indicated as * P < 0.05, ** P < 0.01 and *** P < 0.001. Source data are provided as a Source Data file.
Index in PubMed under a CC BY license. PMID: 38971796

Click image to see more details
Co-location of CD44 and Lewis y antigen on RMG-I-H cells observed under confocal laser scanning microscope . Red fluoscence on the upper left panel indicates CD44 expression; green fluoscence on the upper right panel indicates Lewis y antigen expression; blue fluoscence on the upper right panel indicates cell nuclear location; the lower right panel is a merged image of the other three panels. Lewis y antigen CD44 mainly expressed in the cell membrane observed under the confocal laser scanning microscope, and it were seen as yellow fluorescence after the two overlap, suggesting that Lewis y antigen and CD44 co-localizated in the cell membrane.
Index in PubMed under a CC BY license. PMID: 21294926

Click image to see more details
HSPC-Lipo exhibits higher affinity to leukemic cells. a Schematic illustration of Liquid chromatography tandem mass spectrometry (LC-MS/MS) sequencing design of HSPC cell membrane and HSPC-Lipo. The HSPCs cells were isolated from C57BL/6 mice. b Protein type analysis diagram. c Protein pathway enrichment analysis. d Proteins that coexist in HSPC cell membrane and HSPC-Lipo. e Western blot analysis of CD44 and ITGB2. f Determination of hyaluronic acid content in mouse bone marrow. Data were presented as mean ± s.d. ( n = 3 mice). g Representative immunofluorescence images of co-localization of hyaluronic acid and HSPC-Lipo. Scale bar, 10 μm. h Representative fluorescence images of CD44 knockdown HSPC-Lipo at 24 hours after tail vein injection (cell membrane derived from progenitor cell line 32D cells). ( n = 3 mice). i Quantitative analysis of fluorescence images of CD44 knockdown HSPC-Lipo. Data were presented as mean ± s.d. ( n = 3 mice). j Flow cytometry detection of leukemic cell targeting ability of different leukocyte membrane-coated liposomes. Leukemia cells were harvested for detection at 0.5 hours after incubation with different liposomes. n = 3 experimental replicates. k Representative flow cytometry histograms and cytometry plots of ICAM-1 expression on mouse leukemia cells and mouse progenitor cell line (32D). l Quantitative analysis of ICAM-1 expression. n = 3 experimental replicates. m Representative immunofluorescence images of co-localization of ICAM-1 and HSPC-Lipo. Scale bar, 10 μm. n Representative flow cytometry plots of the leukemic cells targeting ability of ITGB2 knockdown HSPC-Lipo (cell membrane derived from mouse progenitor cell line 32D). Leukemic cells were harvested for detection 0.5 hours after incubation with different liposomes. o Quantitative analysis of the leukemic cells targeting ability of ITGB2 knockdown HSPC-Lipo. n = 3 experimental replicates. The data were presented as mean ± s.d. Statistical significance of P values was calculated via a two-tailed, unpaired Student’s t test and were indicated as * P < 0.05, ** P < 0.01 and *** P < 0.001. Source data are provided as a Source Data file.
Index in PubMed under a CC BY license. PMID: 38971796

Click image to see more details
Drug loading and in vitro toxicity against leukemia cells. a Drug release kinetics of HSPC-Lipo. Data were presented as mean ± s.d. ( n = 3 experimental replicates). b Cell viability assay of leukemic cells after different treatments at 48 hours in vitro. Data were presented as mean ± s.d. ( n = 3 experimental replicates). c Representative flow cytometry plots and quantitative analysis of Annexin V positive cells after 48 hours of different treatment in Ka539 leukemia cells. Data were presented as mean ± s.d. ( n = 3 experimental replicates). d Representative flow cytometry plots and quantitative analysis of Annexin V positive cells after 48 hours of different treatment by in C1498 leukemia cells. The leukemia cells were harvested at 48 h after different treatments and displays the same number of cells in each flow cytometry result. Data were presented as mean ± s.d. ( n = 3 experimental replicates). e Representative flow cytometry plots of leukemia stem cells (Sca-1+c-Kit + ) after 48 hours of different treatment in C1498 cells. f Quantitative analysis of LSC in C1498 cells. Data were presented as mean ± s.d. ( n = 3 experimental replicates). g Representative flow cytometry plots of mature cells after 48 hours of different treatment in C1498 cells. h Quantitative analysis of mature cells in C1498 cells. n = 3 experimental replicates. The data were presented as mean ± s.d. Statistical significance of P values was calculated via a two-tailed, unpaired Student’s t test and were indicated as * P < 0.05, ** P < 0.01 and *** P < 0.001. Source data are provided as a Source Data file.
Index in PubMed under a CC BY license. PMID: 38971796

Click image to see more details
The expression of CD44 and Lewis y antigen in RMG-I and RMG-I-H cells . Panel A shows the expression of Lewis y antigen in RMG-I-H cells was higher than that in RMG-I; panel B shows the expression of CD44 in RMG-I-H cells was higher than that in RMG-I; panel C shows that Lewis y antigen, which in RMG-I-H cells was higher than that in RMG-I, was expressed both in RMG-I and RMG-I-H cells after CD44 immunoprecipitation; panel D Quantitative data were expressed as the intensity ratio target genes to beta-actin. ( P < 0.01)
Index in PubMed under a CC BY license. PMID: 21294926

Click image to see more details
The anti-leukemic effect of Ara-C@HSPC-Lipo in MLL-AF9 leukemia model. a Schematic illustration of animal experiment design. Cell membranes were derived from primary isolated HSPCs. Each received approximately 20 μg of liposomes and 10 μg of cell membrane. b Survival curves of the leukemic mice received different treatments. The statistics and P -values were calculated using the Log-rank (Mantel-Cox) test. ( n = 6 mice for control, HSPC-Lipo and Ara-C group, and n = 7 mice for Ara-C@Lipo group, and n = 11 mice for Ara-C@HSPC-Lipo group). c Representative flow cytometry plots of leukemia cells (GFP positive cells) in bone marrow. Leukemic mice were euthanized on the day 21 to collect bone marrow cells for flow cytometry analysis. d Quantitative analysis of leukemia cells in bone marrow. Data were presented as mean ± s.d. ( n = 5 mice). e Representative flow cytometry plots of leukemia stem cells (CD34 + CD16/32 + ) in bone marrow after different treatments. f Quantitative analysis of leukemia stem cells in BM. Data were presented as mean ± s.d. ( n = 5 mice). g Representative flow cytometry plots of leukemic cells (GFP positive cells) in spleen. h Quantitative analysis of leukemia cells in spleen. Data were presented as mean ± s.d. ( n = 5 mice). i Quantitative analysis of leukemic cells (GFP positive cells) in peripheral blood. Data were presented as mean ± s.d. ( n = 5 mice). j Representative spleen images in leukemic mice after different treatment. k Weight of Spleen. n = 5 mice. The data were presented as mean ± s.d. Statistical significance of P values was calculated via a two-tailed, unpaired Student’s t test and were indicated as * P < 0.05, ** P < 0.01 and *** P < 0.001. Source data are provided as a Source Data file.
Index in PubMed under a CC BY license. PMID: 38971796

Click image to see more details
The mRNA expression of CD44 and α1, 2-FT in RMG-I and RMG-I-H cells were tested by quantitative Real-Time RT-PCR . The mRNA level of α1, 2-FT was significantly increased, but the mRNA level of CD44 was almost the same in RMG-1-hFUT cells and RMG-1 cells. (** P < 0.01, * P > 0.05).
Index in PubMed under a CC BY license. PMID: 21294926

Click image to see more details
Depletion of PLCγ1 suppresses growth and metastasis of gastric adenocarcinoma in a nude mouse tumor xenograft model. ( A ) Volume and weight of tumor samples from nude mice. ( B ) The protein levels of PCNA, cleaved-PARP, PARP, and Bcl-2 in the tumor samples were detected by Immunohistochemistry (Magnificationx100, x400) and Western blotting analyses as described in Materials and Methods. ( C ) The levels of MMP2 and MMP9 in the tumor samples were detected by Immunohistochemistry analysis as described in Materials and Methods (Magnificationx100, x400). The protein and mRNA levels of MMP2, MMP9, E-cadherin(CDH1), N-cadherin(CDH2), snail(SNAIL), and slug(SLUG) in the tumor samples were detected by Western Blotting and Real-time PCR analyses as described in Materials and Methods. ( D ) The protein levels of VEGF and CD34 and the mRNA level of VEGF in tumor samples were detected by Immunohistochemistry and Real-time PCR analysis as described in Materials and Methods. The number of microvessels was accounted under OLYPUS x41 microscope (Magnification x100, x400). ( E ) The lymphoid follicles in inguinal lymph nodes of nude mice were observed under OLYPUS x41microscope, and the protein levels of CD44 and GFP in inguinal lymph nodes of nude mice was detected by Immunohistochemistry analysis as described in Materials and Methods (Magnificationx40, x400). Data are reported as means ± S.D. of three independent experiments (* P < 0.05, ** P < 0.01, *** P < 0.001, **** P < 0.0001, vs respective control).
Index in PubMed under a CC BY license. PMID: 26811493

Click image to see more details
MSH2 knockdown increase the sensitivity of glioma cells to cisplatin. (A, B) The expression of stemness‐related proteins including CD44 and SOX2 was detected in shCtrl and shMSH2 groups of U251 (A) and SHG‐44 (B) cells. (C, D) The sphere‐forming abilities of U251 (C) and SHG‐44 (D) cells were assessed by a 3D sphere formation assay. (E, F) The effects of MSH2 on cisplatin IC50 and cisplatin‐induced cell apoptosis were evaluated in U251 (E) and SHG‐44 (F) cells. Data were shown as mean with standard deviation (SD) ( n ≥ 3). p < 0.05 was considered to be statistically significant. * p < 0.05, ** p < 0.01, *** p < 0.001.
Index in PubMed under a CC BY license. PMID: 40589077

Click image to see more details
ASNS shapes the immune landscapes in metastatic TdLN and primary tumor site. Figure 5A-C. LN metastasis model was conducted on C57BL/6 mice with LLC-ASNS WT(n=6), ASNSC2A overexpression cells(n=6) and control group(n=6), primary tumor and popliteal lymph nodes were isolated at the end of the experiment, and primary tumor volume(B) and TdLN volume/tumor volume(C) was measured and analyzed. 5D-F. (D) Representative FACS profiles of CD8+T cells are shown. The percentage(E) and number(F) of CD8+ subset in TIL cells isolated from primary tumor is shown. 5G-I. (G) Representative FACS profiles of the co-expression pattern of CD44 and CD62L, or the co-expression pattern of TCF-1and TOX in CD8+ T cells are shown. The number(H) and percentage(I) of CD44+, CD44+CD62L+, CD44+CD62L-, Tsl and TTSM subset in CD8+T cells isolated from TdLN is shown. 5J-L. (J) Representative FACS profiles of the co-expression pattern of CD44 and CD62L, or the co-expression pattern of TCF-1and TOX in CD8+ T cells are shown. The number(K) and percentage(L) of CD44+, CD44+CD62L+, CD44+CD62L-, Tsl and TTSM subset in CD8+T cells isolated from primary tumor is shown.
Index in PubMed under a CC BY license. PMID: 41208878

Click image to see more details
ASNS-high-expression metastases generated lymphocyte niches enriched with activated T cells, memory T cells, Tsl and TTSM. Figure 6A-C. Representative immunofluorescence staining images of metastatic TdLNs from LN metastasis model. 6D. The number of CD8+ T cells in the metastasis locations within TdLNs (ASNSWT, n=6, ASNSC2A, n=5, and EV, n=4). 6E-F. The number(E) and percentage(F) of CD44+CD8+T cells among all CD8 T cells in the metastasis locations within TdLNs (ASNSWT, n=6, ASNSC2A, n=5, and EV, n=4). 6G-H. The number(G) and percentage(H) of Tsl cells among all CD8 T cells in the metastasis locations within TdLNs (ASNSWT, n=6, ASNSC2A, n=5, and EV, n=4). 6I-J. The number(I) and percentage(J) of TTSM cells among all CD8 T cells in the metastasis locations within TdLNs (ASNSWT, n=5, ASNSC2A, n=4, and EV, n=3). 6K. Quantitative estimates of the distance from ova+ to CD8+CD44+CD62L+TCF+(TTSM) (ASNSWT, n=6, ASNSC2A, n=5, and EV, n=4). 6L-M. Representative immunofluorescence staining images of metastatic TdLNs from NSCLC patients. 6N-O. The number(C) and percentage(D) of CD8+ T cells in the metastasis locations within TdLNs(ASNS high group, n=7, and ASNS low group, n=6). 6P-Q. The number (E) and percentage(F) of CD45RO+CD8+ T cells in CD8+T cells in the metastasis locations within TdLNs(ASNS high group, n=7, and ASNS low group, n=6). 6R-S. The number (G) and percentage(H) of Tsl cells in CD8+T cells in the metastasis locations within TdLNs(ASNS high group, n=7, and ASNS low group, n=6). 6T-U. The number (I) and percentage(J) of TTSM cells in CD8+T cells in the metastasis locations within TdLNs(ASNS high group, n=7, and ASNS low group, n=6).
Index in PubMed under a CC BY license. PMID: 41208878

Click image to see more details
Representative IHC images showing the expression of B2M in primary tumor and LN metastasis
from intrapulmonary implantation mouse model performed on C57BL/6 mice (upper, n=3) and
popliteal lymph node implantation mouse model performed on C57BL/6 mice (below, n=4). 3B.
A549 cells were treated with low asparagine medium for 48 h. The expression of HLA was
determined by western blotting. 3C-E. A549 cells were treated with asparagine (C), creatine (D)
or creatinine (E) for 48 h. The expression of HLA was determined by western blotting. 3F.
Representative FACS profiles are shown. OT-I CD8+T cells were treated with Asn, AABA or both
for 48 h, and of the expression level of CD44 and CD62L was evaluated (n=3).
Index in PubMed under a CC BY license. PMID: 41208878

Click image to see more details
IHC analysis of CD44 using anti-CD44 antibody (A00052).
CD44 was detected in paraffin-embedded section of human colon cancer tissue. Heat mediated antigen retrieval was performed in citrate buffer (pH6, epitope retrieval solution) for 20 mins. The tissue section was blocked with 10% goat serum. The tissue section was then incubated with 1μg/ml rabbit anti-CD44 Antibody (A00052) overnight at 4°C. Biotinylated goat anti-rabbit IgG was used as secondary antibody and incubated for 30 minutes at 37°C. The tissue section was developed using Strepavidin-Biotin-Complex (SABC)(Catalog # SA1022) with DAB as the chromogen.

Click image to see more details
IHC analysis of CD44 using anti-CD44 antibody (A00052).
CD44 was detected in paraffin-embedded section of human placenta tissue . Heat mediated antigen retrieval was performed in citrate buffer (pH6, epitope retrieval solution) for 20 mins. The tissue section was blocked with 10% goat serum. The tissue section was then incubated with 1μg/ml rabbit anti-CD44 Antibody (A00052) overnight at 4°C. Biotinylated goat anti-rabbit IgG was used as secondary antibody and incubated for 30 minutes at 37°C. The tissue section was developed using Strepavidin-Biotin-Complex (SABC)(Catalog # SA1022) with DAB as the chromogen.

Click image to see more details
IHC analysis of CD44 using anti-CD44 antibody (A00052).
CD44 was detected in paraffin-embedded section of mouse kidney tissue . Heat mediated antigen retrieval was performed in citrate buffer (pH6, epitope retrieval solution) for 20 mins. The tissue section was blocked with 10% goat serum. The tissue section was then incubated with 1μg/ml rabbit anti-CD44 Antibody (A00052) overnight at 4°C. Biotinylated goat anti-rabbit IgG was used as secondary antibody and incubated for 30 minutes at 37°C. The tissue section was developed using Strepavidin-Biotin-Complex (SABC)(Catalog # SA1022) with DAB as the chromogen.

Click image to see more details
IHC analysis of CD44 using anti-CD44 antibody (A00052).
CD44 was detected in paraffin-embedded section of rat kidney tissue . Heat mediated antigen retrieval was performed in citrate buffer (pH6, epitope retrieval solution) for 20 mins. The tissue section was blocked with 10% goat serum. The tissue section was then incubated with 1μg/ml rabbit anti-CD44 Antibody (A00052) overnight at 4°C. Biotinylated goat anti-rabbit IgG was used as secondary antibody and incubated for 30 minutes at 37°C. The tissue section was developed using Strepavidin-Biotin-Complex (SABC)(Catalog # SA1022) with DAB as the chromogen.

Click image to see more details
Flow Cytometry analysis of Jurkat cells using anti-CD44 antibody (A00052).
Overlay histogram showing Jurkat cells stained with A00052 (Blue line). To facilitate intracellular staining, cells were fixed with 4% paraformaldehyde and permeabilized with permeabilization buffer. The cells were blocked with 10% normal goat serum. And then incubated with rabbit anti-CD44 Antibody (A00052,1μg/1x106 cells) for 30 min at 20°C. DyLight®488 conjugated goat anti-rabbit IgG (BA1127, 5-10μg/1x106 cells) was used as secondary antibody for 30 minutes at 20°C. Isotype control antibody (Green line) was rabbit IgG (1μg/1x106) used under the same conditions. Unlabelled sample without incubation with primary antibody and secondary antibody (Red line) was used as a blank control.

Click image to see more details
IF analysis of CD44 using anti-CD44 antibody (A00052)
CD44 was detected in paraffin-embedded section of mouse lymphaden tissues. Heat mediated antigen retrieval was performed in citrate buffer (pH6, epitope retrieval solution ) for 20 mins. The tissue section was blocked with 10% goat serum. The tissue section was then incubated with 1μg/mL rabbit anti-CD44 Antibody (A00052) overnight at 4°C. DyLight®488 Conjugated Goat Anti-Rabbit IgG (BA1127) was used as secondary antibody at 1:100 dilution and incubated for 30 minutes at 37°C. The section was counterstained with DAPI. Visualize using a fluorescence microscope and filter sets appropriate for the label used.

Click image to see more details
MSH2 knockdown increase the sensitivity of glioma cells to cisplatin. (A, B) The expression of stemness‐related proteins including CD44 and SOX2 was detected in shCtrl and shMSH2 groups of U251 (A) and SHG‐44 (B) cells. (C, D) The sphere‐forming abilities of U251 (C) and SHG‐44 (D) cells were assessed by a 3D sphere formation assay. (E, F) The effects of MSH2 on cisplatin IC50 and cisplatin‐induced cell apoptosis were evaluated in U251 (E) and SHG‐44 (F) cells. Data were shown as mean with standard deviation (SD) ( n ≥ 3). p < 0.05 was considered to be statistically significant. * p < 0.05, ** p < 0.01, *** p < 0.001.
Index in PubMed under a CC BY license. PMID: 40589077

Click image to see more details
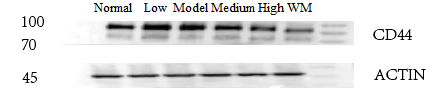
Western blot analysis of CD44 using anti-CD44 antibody (A00052).
Electrophoresis was performed on a 5-20% SDS-PAGE gel at 70V (Stacking gel) / 90V (Resolving gel) for 2-3 hours. The sample well of each lane was loaded with 30 ug of sample under reducing conditions.
Lane 1: Normal group-rat colon tissue lysates,
Lane 2: Triditional Chinese medicine treatment (low dose)-rat colon tissue lysates,
Lane 3: Model group-rat colon tissue lysates,
Lane 4: Triditional Chinese medicine treatment (medium dose)-rat colon tissue lysates,
Lane 5: Triditional Chinese medicine treatment(high dose)-rat colon tissue lysates,
Lane 6: Western medicine treatment-rat colon tissue lysates.
After electrophoresis, proteins were transferred to a nitrocellulose membrane at 150 mA for 50-90 minutes. Blocked the membrane with 5% non-fat milk/TBS for 1.5 hour at RT. The membrane was incubated with rabbit anti-CD44 antigen affinity purified polyclonal antibody (Catalog # A00052) at 1:1000 overnight at 4°C, then washed with TBS-0.1%Tween 3 times with 5 minutes each and probed with a goat anti-rabbit IgG-HRP secondary antibody for 1 hour at RT. The signal is developed using an Enhanced Chemiluminescent detection (ECL) kit (Catalog # EK1002) with ChemiDoc MP system. A specific band was detected for CD44 at approximately 82 kDa. The expected band size for CD44 is at 82 kDa.
Specific Publications For Anti-CD44 Antibody Picoband® (A00052)
Loading publications
Recommended Resources
Here are featured tools and databases that you might find useful.
- Boster's Pathways Library
- Protein Databases
- Bioscience Research Protocol Resources
- Data Processing & Analysis Software
- Photo Editing Software
- Scientific Literature Resources
- Research Paper Management Tools
- Molecular Biology Software
- Primer Design Tools
- Bioinformatics Tools
- Phylogenetic Tree Analysis
Customer Reviews
Have you used Anti-CD44 Antibody Picoband®?
Share your experimental results or join a short interview to earn up to $1,000 in product credits or other rewards.
1 Reviews For Anti-CD44 Antibody Picoband®
This antibody is highly efficient and specific, suitable for Western blot detection of CD44 protein in rat colon tissue, with only minor nonspecific bands.
Excellent
| SKU | A00052 |
|---|---|
| Application | Western Blot |
| Sample | rat colon tissue |
| Sample Processing Description | RIPA lysis buffer with protease inhibitor PMSF (100:1) was used to lyse the sample for 10 minutes, followed by centrifugation at 12,000 rpm for 15 minutes. The supernatant was mixed with 5× loading buffer, denatured at 100°C for 10 minutes, and then loaded onto SDS-PAGE. |
| Other Reagents | Blocking buffer |
| Primary Antibody | Cyclin A2/CCNA2 Antibody Picoband® |
| Primary Incubation | 1:1000, overnight at 4 ℃ |
| Secondary Antibody | HRP Conjugated AffiniPure Goat Anti-Rabbit IgG (H+L) |
| Secondary Incubation | 1 hour in room temperature |
| Detection | Substrate: ECL, Imaging system:ChemiDoc MP |
| Results Summary | The figure shows a schematic of Western blot results for the target protein CCNA2 and the internal control Actin in rat colon across different groups. Expression was increased in the model group. Among the low, medium, and high doses of the herbal treatment, the low-dose group showed the best effect. The target bands are clear, and the experimental results are satisfactory. |
Shiyu Zhang, LUTCM
Verified customer
Submitted 2026-01-06
Customer Q&As
Have a question?
Find answers in Q&As, reviews.
Can't find your answer?
Submit your question
18 Customer Q&As for Anti-CD44 Antibody Picoband®
Question
Have A00052 and PA2160 been validated to react with 80 kd fragment on the M chain?
Verified customer
Asked: 2022-06-22
Answer
The Anti-CD44 Antibody Picoband (A00052) and Anti-Laminin 2 Alpha/LAMA2 Antibody (PA2160) have not been validated to react with 80 kd fragment on the M chain.
Boster Scientific Support
Answered: 2022-06-23
Question
I was wanting to use your anti-CD44 antibody for IHC-P for human parotid gland on frozen tissues, but I want to know if it has been tested for this particular application. Has this antibody been tested and is this antibody a good choice for human parotid gland identification?
Verified Customer
Verified customer
Asked: 2020-04-07
Answer
As indicated on the product datasheet, A00052 anti-CD44 antibody has been validated for ELISA, Flow Cytometry, IF, IHC-P, IHC-F, ICC, WB on human, mouse, rat tissues. We have an innovator award program that if you test this antibody and show it works in human parotid gland in IHC-frozen, you can get your next antibody for free.
Boster Scientific Support
Answered: 2020-04-07
Question
We ordered your anti-CD44 antibody for ICC on t-cell a few years ago. I am using rat, and We want to use the antibody for IHC-P next. We need examining t-cell as well as cervix carcinoma in our next experiment. Could you please give me some suggestion on which antibody would work the best for IHC-P?
Verified Customer
Verified customer
Asked: 2020-01-10
Answer
I have checked the website and datasheets of our anti-CD44 antibody and it appears that A00052 has been tested on rat in both ICC and IHC-P. Thus A00052 should work for your application. Our Boster satisfaction guarantee will cover this product for IHC-P in rat even if the specific tissue type has not been validated. We do have a comprehensive range of products for IHC-P detection and you can check out our website bosterbio.com to find out more information about them.
Boster Scientific Support
Answered: 2020-01-10
Question
Do you have a BSA free version of anti-CD44 antibody A00052 available?
Verified Customer
Verified customer
Asked: 2019-12-09
Answer
We appreciate your recent telephone inquiry. I can confirm that some lots of this anti-CD44 antibody A00052 are BSA free. For now, these lots are available and we can make a BSA free formula for you free of charge. It will take 3 extra days to prepare. If you require this antibody BSA free again in future, please do not hesitate to contact me and I will be pleased to check which lots we have in stock that are BSA free.
Boster Scientific Support
Answered: 2019-12-09
Question
My colleagues were happy with the WB result of your anti-CD44 antibody. However we have observed positive staining in leukemic t-cell cell membrane using this antibody. Is that expected? Could you tell me where is CD44 supposed to be expressed?
R. Johnson
Verified customer
Asked: 2019-10-14
Answer
From what I have seen in literature, leukemic t-cell does express CD44. Generally CD44 expresses in cell membrane. Regarding which tissues have CD44 expression, here are a few articles citing expression in various tissues:
Cervix carcinoma, Pubmed ID: 17081983, 18669648, 18691976, 20068231, 23186163
Foreskin, Pubmed ID: 2007624
Glial tumor, Pubmed ID: 7527301
Keratinocyte, Pubmed ID: 1281868
Leukemic T-cell, Pubmed ID: 19690332
Liver, Pubmed ID: 19159218, 24275569
Lung, Pubmed ID: 1717145, 7528188
Lymphoblast, Pubmed ID: 1465456, 1922057
Mammary carcinoma, Pubmed ID: 8352881
Myeloid leukemia cell, Pubmed ID: 2056274
Pancreas, and Retinal pigment epithelium, Pubmed ID: 15489334
Peripheral blood, Pubmed ID: 7508992
Plasma, Pubmed ID: 16335952
Reticulocyte, Pubmed ID: 1840487
Spinal cord, Pubmed ID: 17974005
T-cell, Pubmed ID: 19367720
Boster Scientific Support
Answered: 2019-10-14
Question
Is this A00052 anti-CD44 antibody reactive to the isotypes of CD44?
Verified Customer
Verified customer
Asked: 2019-08-30
Answer
The immunogen of A00052 anti-CD44 antibody is E. coli-derived human CD44 recombinant protein (Position: Q21-H259). Could you tell me which isotype you are interested in so I can help see if the immunogen is part of this isotype?
Boster Scientific Support
Answered: 2019-08-30
Question
What antibody is recommended to conjugate with biotin?
Verified customer
Asked: 2019-07-10
Answer
Currently, we can only provide biotin conjugated Anti-CD44 Antibody Picoband A00052.
Boster Scientific Support
Answered: 2019-07-15
Question
Is a blocking peptide available for product anti-CD44 antibody (A00052)?
Verified Customer
Verified customer
Asked: 2019-06-04
Answer
We do provide the blocking peptide for product anti-CD44 antibody (A00052). If you would like to place an order for it please contact support@bosterbio.com and make a special request.
Boster Scientific Support
Answered: 2019-06-04
Question
We need using your anti-CD44 antibody for hyaluronan catabolic process studies. Has this antibody been tested with western blotting on mouse kidney tissue? We would like to see some validation images before ordering.
A. Singh
Verified customer
Asked: 2018-11-30
Answer
We appreciate your inquiry. This A00052 anti-CD44 antibody is tested on human placenta tissue, hela cell lysate, rat thymus tissue, spleen tissue, tissue lysate, mouse kidney tissue, colon cancer tissue, jurkat cells. It is guaranteed to work for ELISA, Flow Cytometry, IF, IHC-P, IHC-F, ICC, WB in human, mouse, rat. Our Boster guarantee will cover your intended experiment even if the sample type has not been be directly tested.
Boster Scientific Support
Answered: 2018-11-30
Question
Would A00052 anti-CD44 antibody work on parafin embedded sections? If so, which fixation method do you recommend we use (PFA, paraformaldehyde, other)?
Verified Customer
Verified customer
Asked: 2018-11-06
Answer
It shows on the product datasheet, A00052 anti-CD44 antibody as been tested on IHC-P. It is best to use PFA for fixation because it has better tissue penetration ability. PFA needs to be prepared fresh before use. Long term stored PFA turns into formalin, as the PFA molecules congregate and become formalin.
Boster Scientific Support
Answered: 2018-11-06
Question
Here is the WB image, lot number and protocol we used for parotid gland using anti-CD44 antibody A00052. Please let me know if you require anything else.
B. Krishna
Verified customer
Asked: 2018-09-14
Answer
Thank you very much for the data. Our lab team are working to resolve this as quickly as possible, and we appreciate your patience and understanding! You have provided everything we needed. Please let me know if there is anything you need in the meantime.
Boster Scientific Support
Answered: 2018-09-14
Question
Can you help my question with product A00052, anti-CD44 antibody. I was wondering if it would be possible to conjugate this antibody with biotin. I would need it to be without BSA or sodium azide. I am planning on using a buffer exchange of sodium azide with PBS only. Would there be problems for me to conjugate the antibody and store it in -20 degrees in small aliquots?
D. Anderson
Verified customer
Asked: 2017-10-17
Answer
We do not advise storing this antibody with PBS buffer only in -20 degrees. If you want to store it in -20 degrees it is best to add some cryoprotectant like glycerol. If you want carrier free A00052 anti-CD44 antibody, we can provide it to you in a special formula with trehalose and/or glycerol. These molecules will not interfere with conjugation chemistry and provide a good level of protection for the antibody from degradation. Please be sure to specify this in your purchase order.
Boster Scientific Support
Answered: 2017-10-17
Question
We are currently using anti-CD44 antibody A00052 for human tissue, and we are content with the IF results. The species of reactivity given in the datasheet says human, mouse, rat. Is it possible that the antibody can work on feline tissues as well?
Verified Customer
Verified customer
Asked: 2017-07-26
Answer
The anti-CD44 antibody (A00052) has not been validated for cross reactivity specifically with feline tissues, though there is a good chance of cross reactivity. We have an innovator award program that if you test this antibody and show it works in feline you can get your next antibody for free. Please contact me if I can help you with anything.
Boster Scientific Support
Answered: 2017-07-26
Question
We have been able to see staining in human cervix carcinoma. Are there any suggestions? Is anti-CD44 antibody supposed to stain cervix carcinoma positively?
R. Gonzalez
Verified customer
Asked: 2016-04-01
Answer
Based on literature cervix carcinoma does express CD44. Based on Uniprot.org, CD44 is expressed in parotid gland, reticulocyte, myeloid leukemia cell, keratinocyte, lymphoblast, mammary carcinoma, articular cartilage, colon adenocarcinoma retinal pigment epithelium, spinal cord, pancreas retinal pigment epithelium, glial tumor, peripheral blood, foreskin, lung, plasma, cervix carcinoma, t-cell, liver, leukemic t-cell, among other tissues. Regarding which tissues have CD44 expression, here are a few articles citing expression in various tissues:
Cervix carcinoma, Pubmed ID: 17081983, 18669648, 18691976, 20068231, 23186163
Foreskin, Pubmed ID: 2007624
Glial tumor, Pubmed ID: 7527301
Keratinocyte, Pubmed ID: 1281868
Leukemic T-cell, Pubmed ID: 19690332
Liver, Pubmed ID: 19159218, 24275569
Lung, Pubmed ID: 1717145, 7528188
Lymphoblast, Pubmed ID: 1465456, 1922057
Mammary carcinoma, Pubmed ID: 8352881
Myeloid leukemia cell, Pubmed ID: 2056274
Pancreas, and Retinal pigment epithelium, Pubmed ID: 15489334
Peripheral blood, Pubmed ID: 7508992
Plasma, Pubmed ID: 16335952
Reticulocyte, Pubmed ID: 1840487
Spinal cord, Pubmed ID: 17974005
T-cell, Pubmed ID: 19367720
Boster Scientific Support
Answered: 2016-04-01
Question
I appreciate helping with my inquiry over the phone. Here are the WB image, lot number and protocol we used for parotid gland using anti-CD44 antibody A00052. Let me know if you need anything else.
J. Anderson
Verified customer
Asked: 2015-07-03
Answer
Thank you for the data. You have provided everything we needed. Our lab team are working to resolve your inquiry as quickly as possible, and we appreciate your patience and understanding! Please let me know if there is anything you need in the meantime.
Boster Scientific Support
Answered: 2015-07-03
Question
I see that the anti-CD44 antibody A00052 works with IHC-P, what is the protocol used to produce the result images on the product page?
N. Collins
Verified customer
Asked: 2014-11-26
Answer
You can find protocols for IHC-P on the "support/technical resources" section of our navigation menu. If you have any further questions, please send an email to support@bosterbio.com
Boster Scientific Support
Answered: 2014-11-26
Question
I was wanting to use to test anti-CD44 antibody A00052 on human parotid gland for research purposes, then I may be interested in using anti-CD44 antibody A00052 for diagnostic purposes as well. Is the antibody suitable for diagnostic purposes?
J. Evans
Verified customer
Asked: 2014-10-14
Answer
The products we sell, including anti-CD44 antibody A00052, are only intended for research use. They would not be suitable for use in diagnostic work. If you have the means to develop a product into diagnostic use, and are interested in collaborating with us and develop our product into an IVD product, please contact us for more discussions.
Boster Scientific Support
Answered: 2014-10-14
Question
Does anti-CD44 antibody A00052 work for IHC-P with parotid gland?
G. Williams
Verified customer
Asked: 2013-10-04
Answer
According to the expression profile of parotid gland, CD44 is highly expressed in parotid gland. So, it is likely that anti-CD44 antibody A00052 will work for IHC-P with parotid gland.
Boster Scientific Support
Answered: 2013-10-04
