Boster Bio Life Science Blog

  1. Replicates or Dilutions? Designing ELISA with Limited Sample Volume

    Working with limited ELISA sample volume? Learn how to decide between duplicate wells and multiple dilutions, account for dead volume and matrix effects, and design a practical workflow that makes the most of scarce samples such as CSF or animal serum.
    Read more
  2. Decalcification in IHC: Why Bone Markers Lose Signal

    Bone tissue can look well preserved while IHC staining becomes unexpectedly weak. Learn how decalcification, fixation, and antigen retrieval can affect antigen preservation—and how to tell whether the problem comes from tissue processing or the antibody.
    Read more
  3. ELISA False Positives from Heterophilic Antibodies

    Heterophilic antibodies can create false-positive ELISA signals by interacting with assay antibodies rather than the intended target. Learn how to recognize suspicious results and use dilution, blocking, and alternative antibody pairs to confirm interference.
    Read more
  4. First Well vs. Last Well: Does ELISA Pipetting Time Affect Your Results?

    A 10-minute gap between the first and last well does not always mean your ELISA plate is biased. Learn when pipetting order creates true timing drift, why substrate development is especially sensitive, and how to tell whether a plate should be repeated.
    Read more
  5. Can Western Blot Results from Different Gels Be Compared?

    Can western blot results from different gels or different experimental days be compared? This article explains why raw band intensity values should not be directly compared, and how loading controls, bridge samples, and appropriate normalization strategies can help researchers evaluate relative protein expression changes more reliably.
    Read more
  6. How to Tell If Your ELISA Standard Curve Is Reliable Beyond R²

    A high R² doesn’t always mean your ELISA standard curve is reliable. Learn how residuals, back-calculated standards, weighting, and 4PL vs 5PL models can reveal curve-fit errors and improve quantitative accuracy.
    Read more
  7. Membrane, Nuclear, or Cytoplasmic Staining: Localization Controls for IHC Interpretation

    When an IHC signal appears in the wrong cellular compartment, localization is a warning sign—not a verdict on antibody specificity.

    A membrane protein appears mostly cytoplasmic. A nuclear marker stains outside the nucleus. These patterns deserve attention, but they do not automatically mean the antibody is nonspecific. In fixed tissue, the observed signal reflects the biology of the sample, the antibody, and the assay conditions. [1,2]

    The practical question is not simply whether the stain is in the expected place. It is what evidence can distinguish genuine localization from technical artifact or off-target binding. IHC staining localization controls are most useful when each one is chosen to answer a specific uncertainty.

    In This Article

    1. 1. Start With the Pattern You Actually See
    2. 2. Recheck the Expected Localization
    3. 3. Choose a Control That Answers the Right Question
    4. 4. How to Investigate a Localization Mismatch
    5. 5. Three Common Localization Mismatch Scenarios
    6. 6. Rule Out Technical Causes Before Calling It Biology
    7. 7. When Unexpected Localization May Reflect Real Biology
    8. 8. A Practical Decision Path
    9. Frequently Asked Questions
    10. Takeaway
    11. References

    1. Start With the Pattern You Actually See

    Describe the staining before explaining i...

    Read more
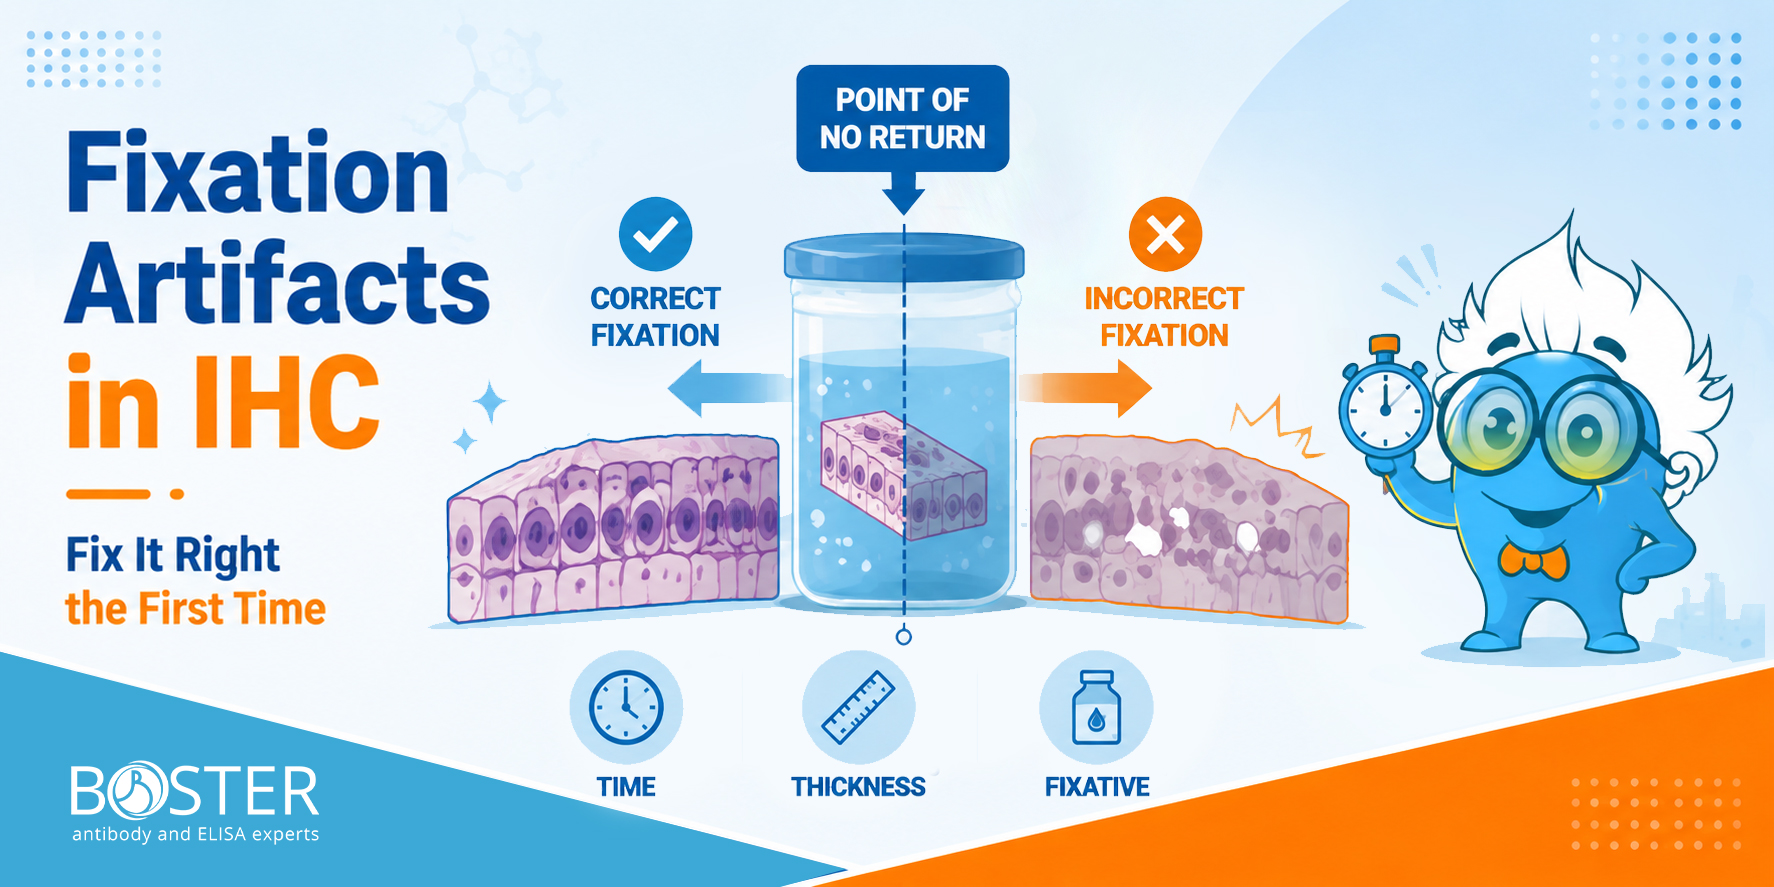
  8. Artifacts Introduced By Improper Fixation

    Fixation artifacts are difficult to reverse and may compromise IHC interpretation. Unlike most laboratory mistakes, poor tissue fixation cannot be corrected downstream. This guide covers every critical variable in the fixation workflow so your IHC biomarker data stays reliable across longitudinal studies.
    In This Article

    1. Why Fixation Artifacts Are a Permanent Problem in IHC
    2. Handle Tissue Gently from the Moment of Excision
    3. Hydration and Ischemic Time: The Two Clocks You Cannot Stop
    4. Balancing Over-Fixation and Under-Fixation Without Sacrificing Either Morphology or Antigenicity
    5. Choosing Fixatives and Conditions Compatible with Your Target Epitopes
    6. Fixative Comparison for IHC Applications
    ...
    Read more
    Artifacts Introduced By Improper Fixation
  9. Reconstituting Cytokines and Growth Factors: Carrier Proteins, Adsorption, and Aliquoting

    A recombinant cytokine can be prepared at the correct calculated concentration and still produce a weaker-than-expected response after dilution or frozen storage. The protein may have lost biological integrity, but another explanation is often overlooked: part of the cytokine may no longer be in the liquid phase because it has adsorbed to tubes, pipette tips, or assay plates. This handling issue matters across many recombinant proteins, particularly when they are used at low concentrations in cell culture or functional assays.

    Expression system, purification, and final formulation can influence how a recombinant protein behaves after reconstitution. Boster’s guide to recombinant protein production provides background on these upstream variables without replacing the handling instructions for the finished product.

    In practice, a reduced experimental response after reconstitution can reflect two different problems:

    • Reduced recovery: less cytokine remains available in solution because some of it has adsorbed to laboratory surfaces.
    • Loss of biological activity: the protein has aggregated, precipitated, unfolded, or otherwise become less functional.

    A carrier protein can help with the first problem when it is compatible with the assay.
    It cannot reliably repair a cytokine that has already aggregated or denatured.

    In This Article

    1. 1. Why Low-Concentration Cytokines Are Vulnerable to Surface Loss
    2. 2. A
    3. ...
    Read more
  10. ELISA Edge Effect: Causes, Plate Maps, and Prevention

    Why outer wells read high or low, how to recognize positional bias, and what to change before the next plate.

    You finish an ELISA, review the optical density values, and notice that the outer wells do not behave like the center. Rows A and H may read higher, columns 1 and 12 may read lower, or the four corner wells may show the largest shift. The immediate question is whether the result reflects biology, evaporation, temperature, washing, dispensing order, or another plate-related artifact.

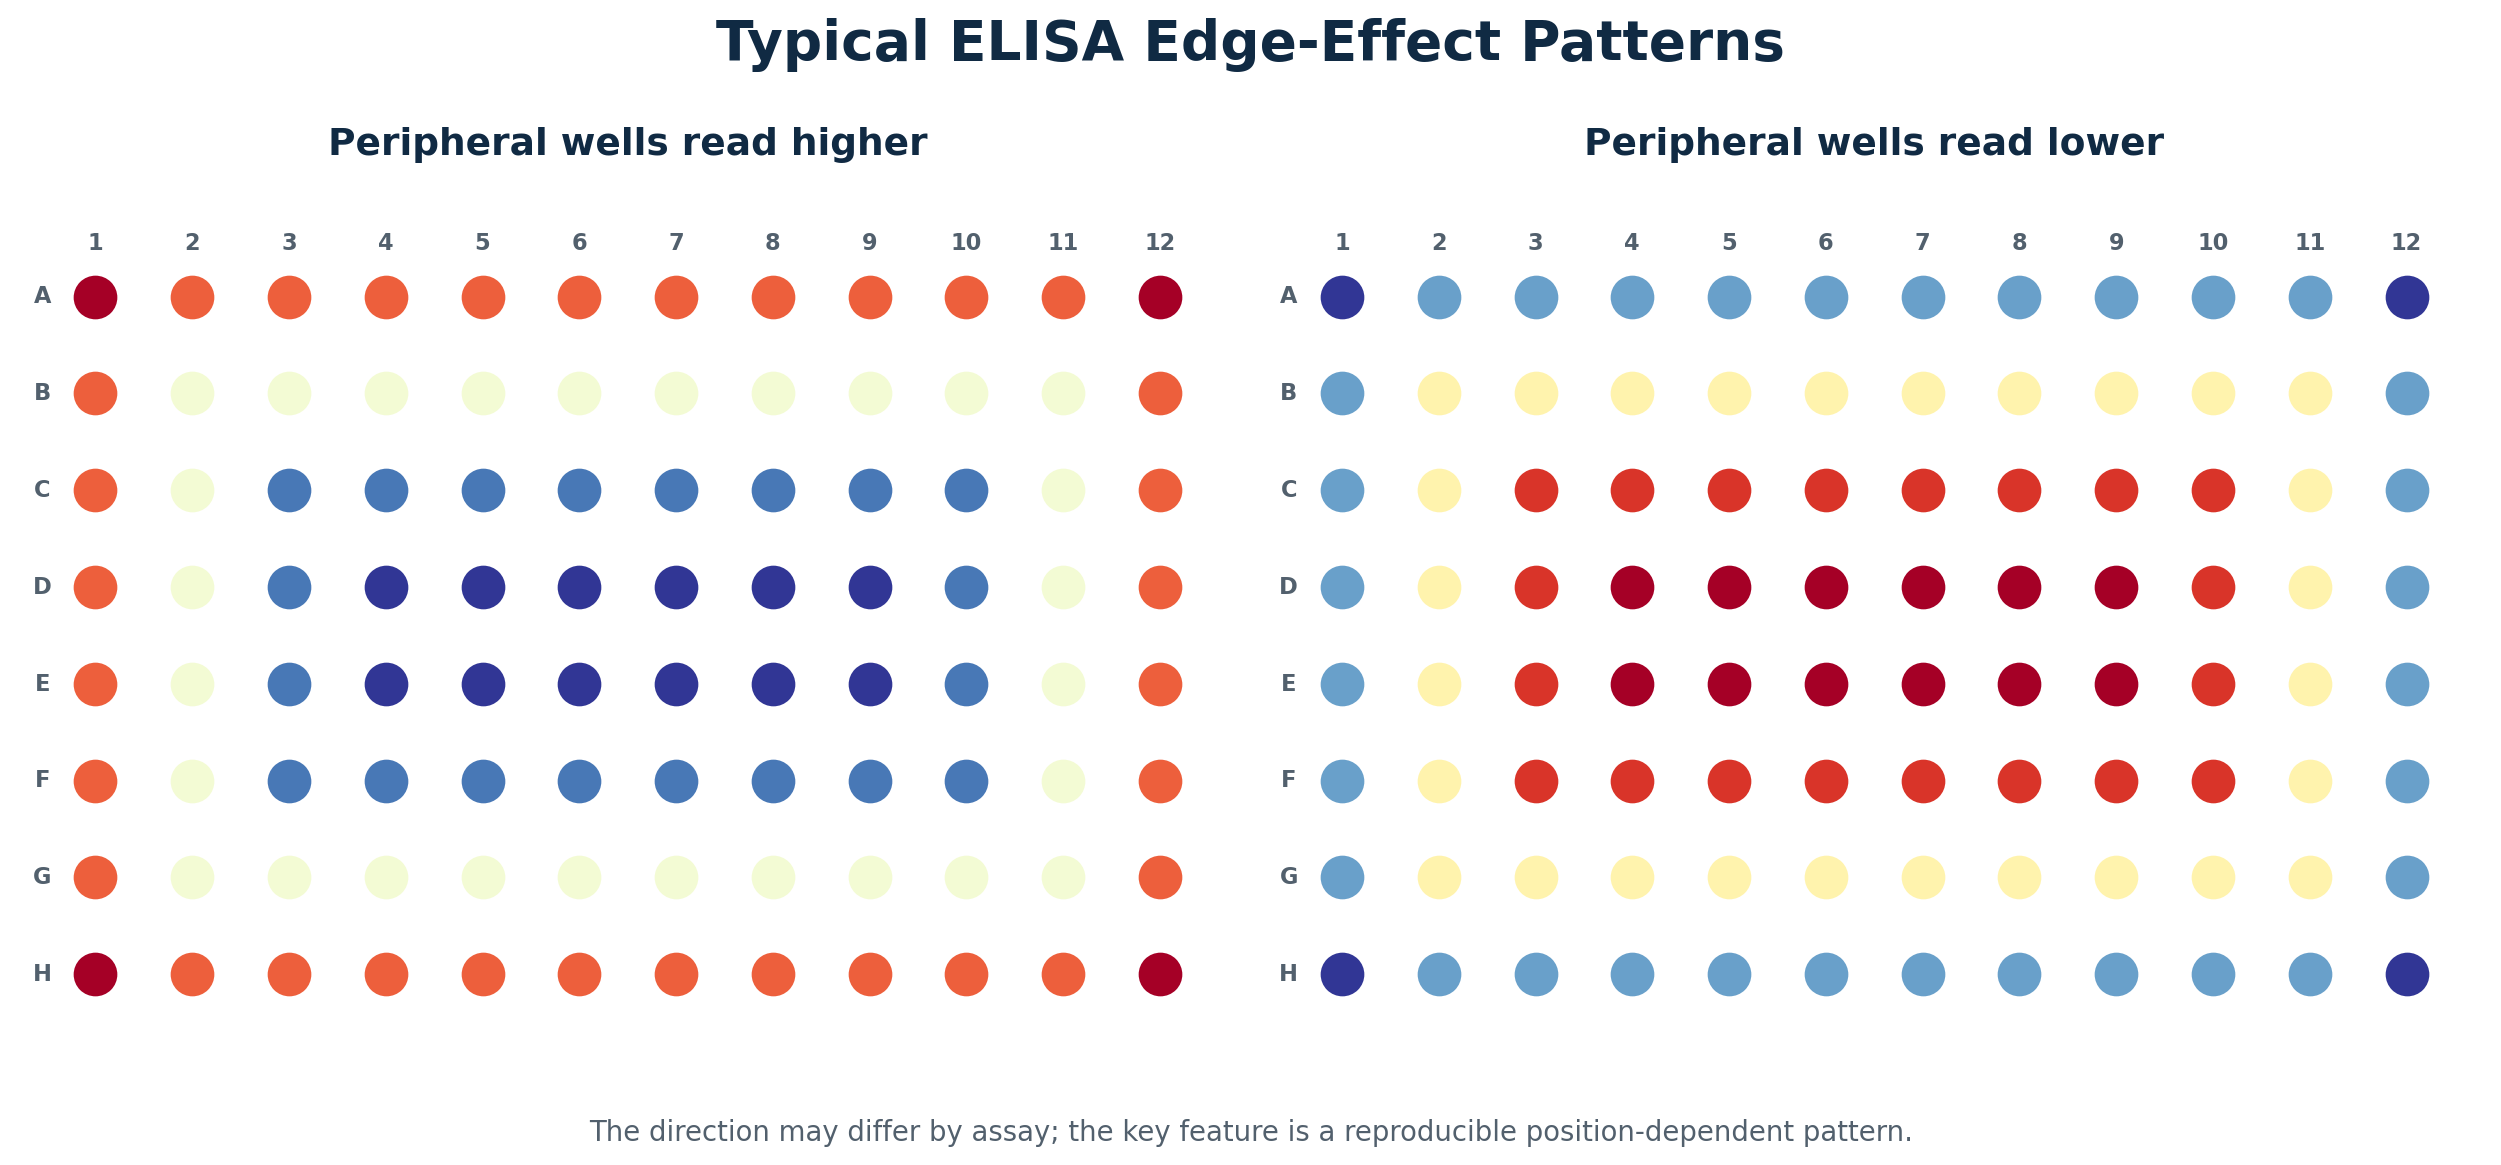
    This position-dependent variation is commonly called the ELISA edge effect. It is not defined by one direction of change: outer wells can read either higher or lower than inner wells. The more useful clue is a repeatable spatial pattern that follows well position rather than sample identity. This guide explains how to recognize that pattern, distinguish it from other artifacts, test likely causes, design diagnostic plate maps, and reduce its impact on ELISA data.

    Quick Answer
    An ELISA edge effect is a systematic difference between peripheral and central wells. A complete outer ring, stronger corner deviations, or a repeatable edge-to-center gradient supports positional bias. High or low OD alone does not identify the cause; review the plate pattern and confirm it with controlled QC placement.

    In This Article

    1. 1. What Does an ELISA Edge Effect Look Like?
    2. 2. Why Do Outer ELISA Wells Read Higher or Lower?
    3. 3. Common Causes of the ELISA Edge Effect
    4. 4. How to Tell Whether the Pattern Is Technical or Biological
    5. 5. Diagnostic Plate Maps for ELISA Edge Effects
    6. 6. How to Prevent ELISA Edge Effects
    7. 7. Can You Use Data From a Plate With an Edge Effect?
    8. 8. How Edge Effects Distort Standard Curves and Validation
    9. Frequently Asked Questions
    10. Conclusion
    11. References

    1. What Does an ELISA Edge Effect Look Like?

    The clearest way to recognize an edge effect is to map raw OD values to their physical well positions before relying on calculated concentrations. Typical signs include:

    • Row A, row H, column 1, or column 12 consistently differing from central wells;
    • Corner wells showing a larger deviation than other perimeter wells;
    • A gradual change from the outside of the plate toward the center;
    • The same spatial pattern appearing in repeated plates or operators;
    • The same QC material producing different values depending on where it is placed.

    The direction can vary by assay. Some plates show a high-OD perimeter, while others show lower edge values. Position dependence and reproducibility are more informative than the direction of the shift.
    Two ELISA plate heatmaps showing peripheral wells reading higher or lower than central wells

    Figure 1. Typical high- and low-perimeter edge-effect patterns. The exact direction is assay-dependent; the diagnostic feature is a reproducible relationship with plate position.

    Edge effect or another plate artifact?

    Not every abnormal outer well is a classic edge effect. The spatial pattern often points to the step that should be investigated first.

    Pattern on the plate More likely explanation
    Complete perimeter ring, often strongest at corners Temperature, evaporation, sealing, or plate-position effects
    One side of the plate differs Directional environmental exposure, incomplete sealing, or reader-related bias
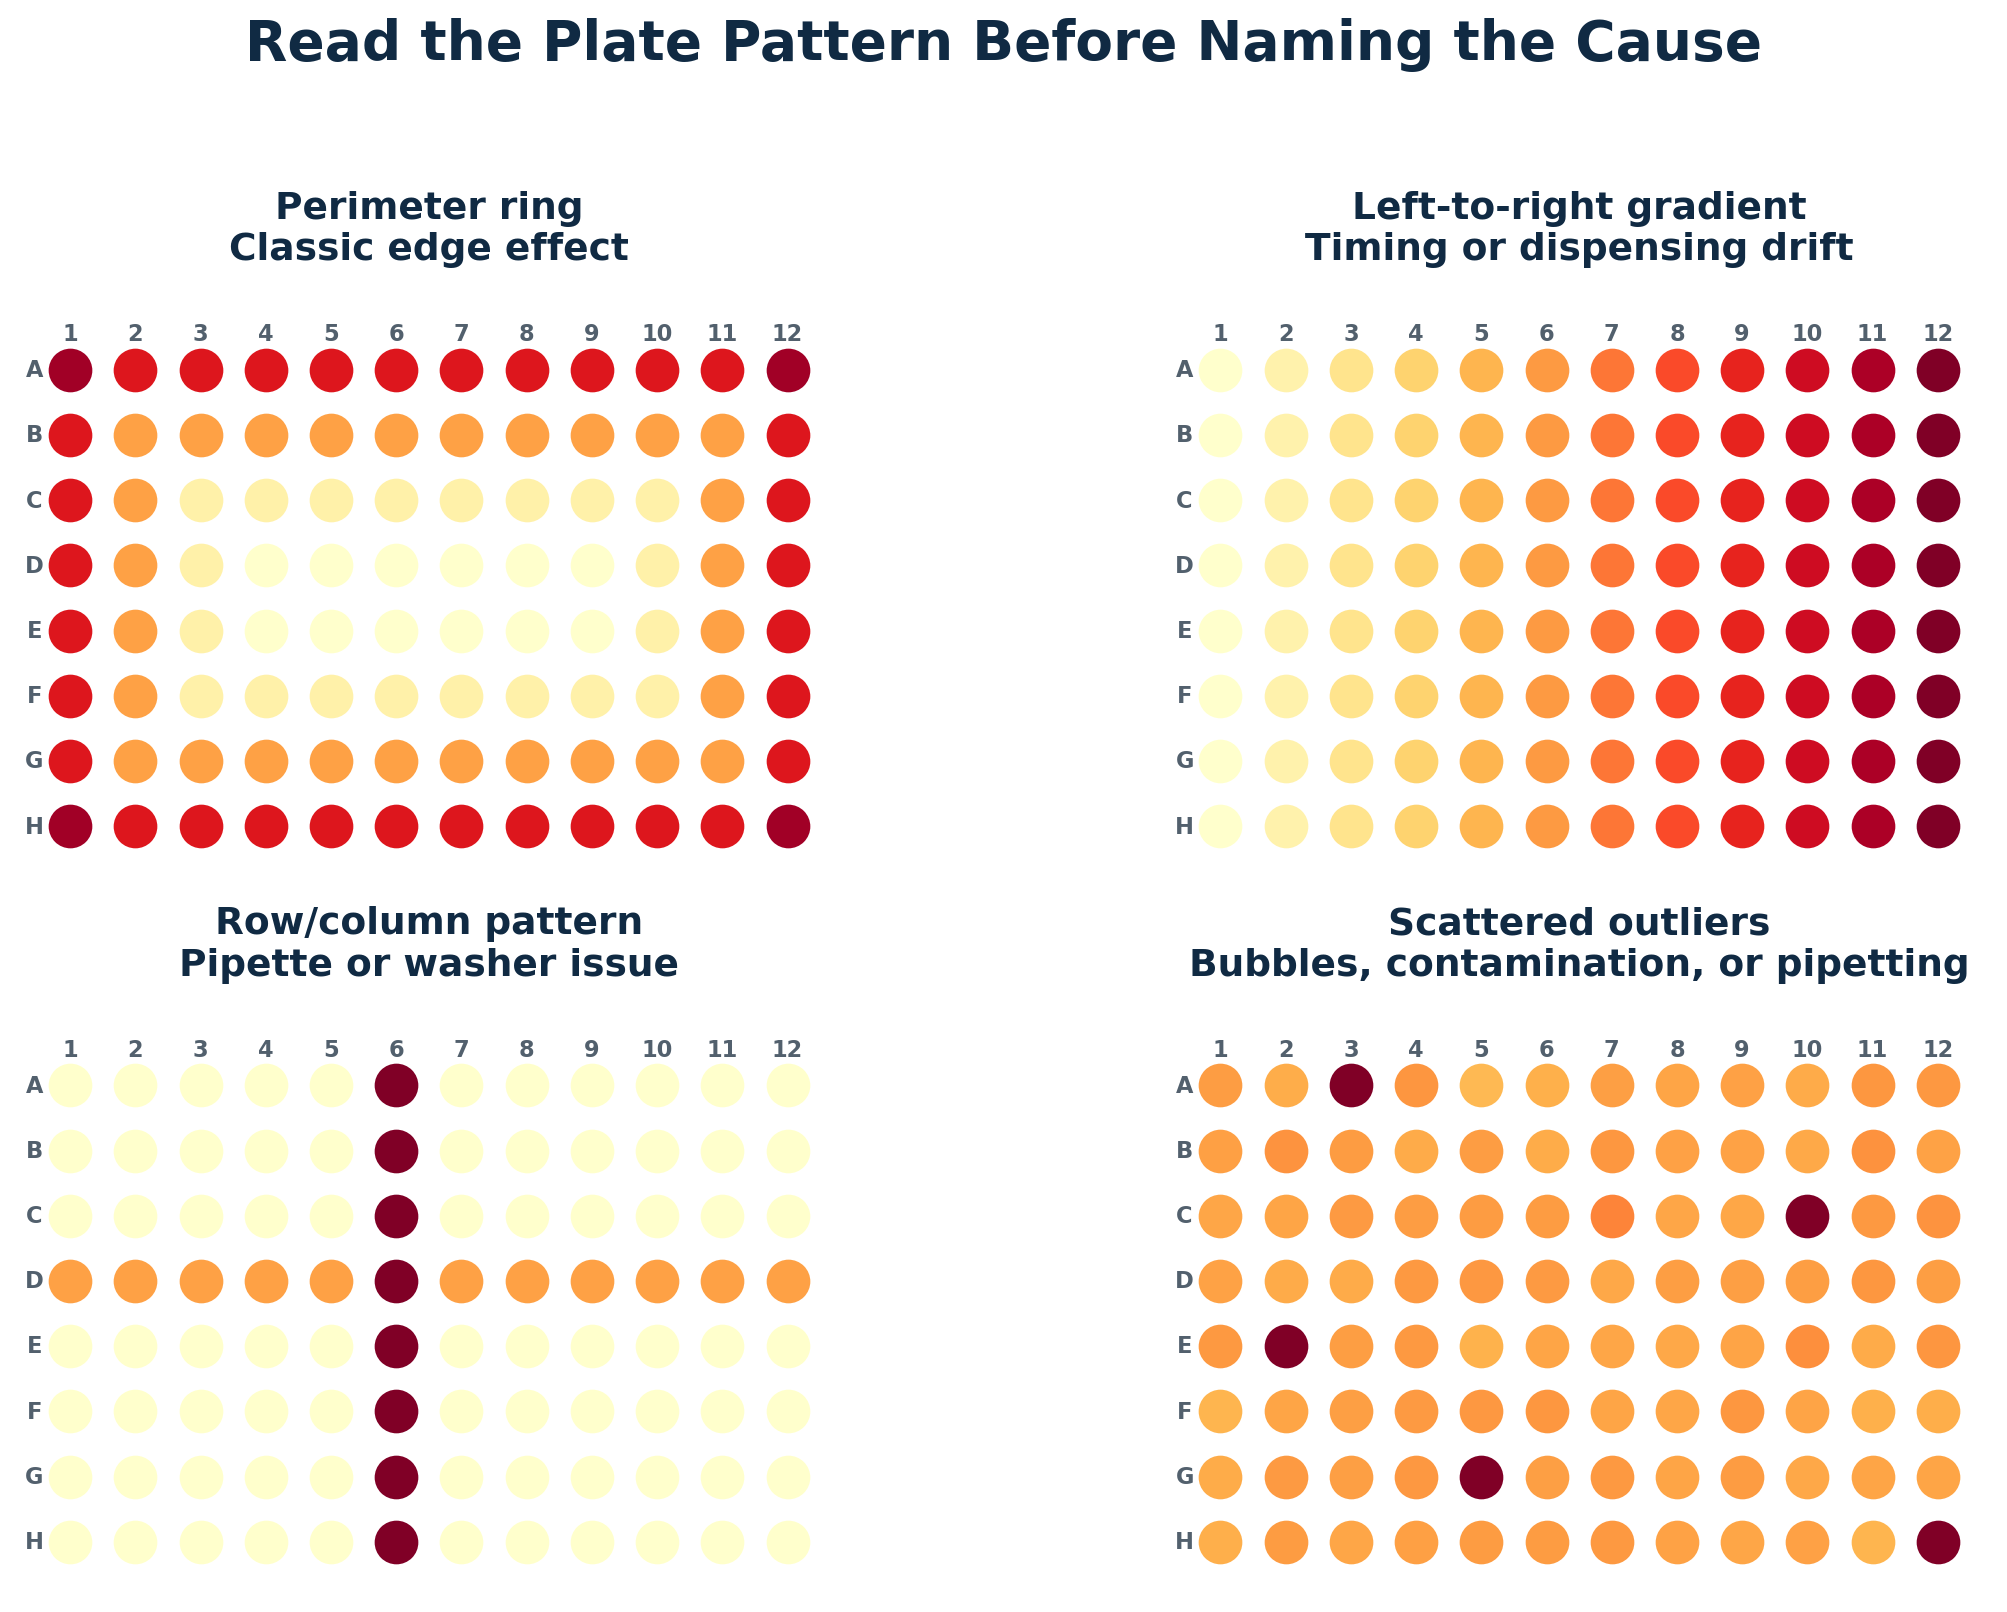
    Gradual left-to-right or top-to-bottom change Dispensing, substrate, stop-solution, or reading-time drift
    One entire row or column differs Multichannel pipette or plate-washer issue
    Irregular local cluster Contamination, bubbles, splashing, or local washing problem
    Scattered isolated wells Pipetting error, bubbles, or particulate material
    Same experimental group differs after randomized placement Biological variation becomes more plausible

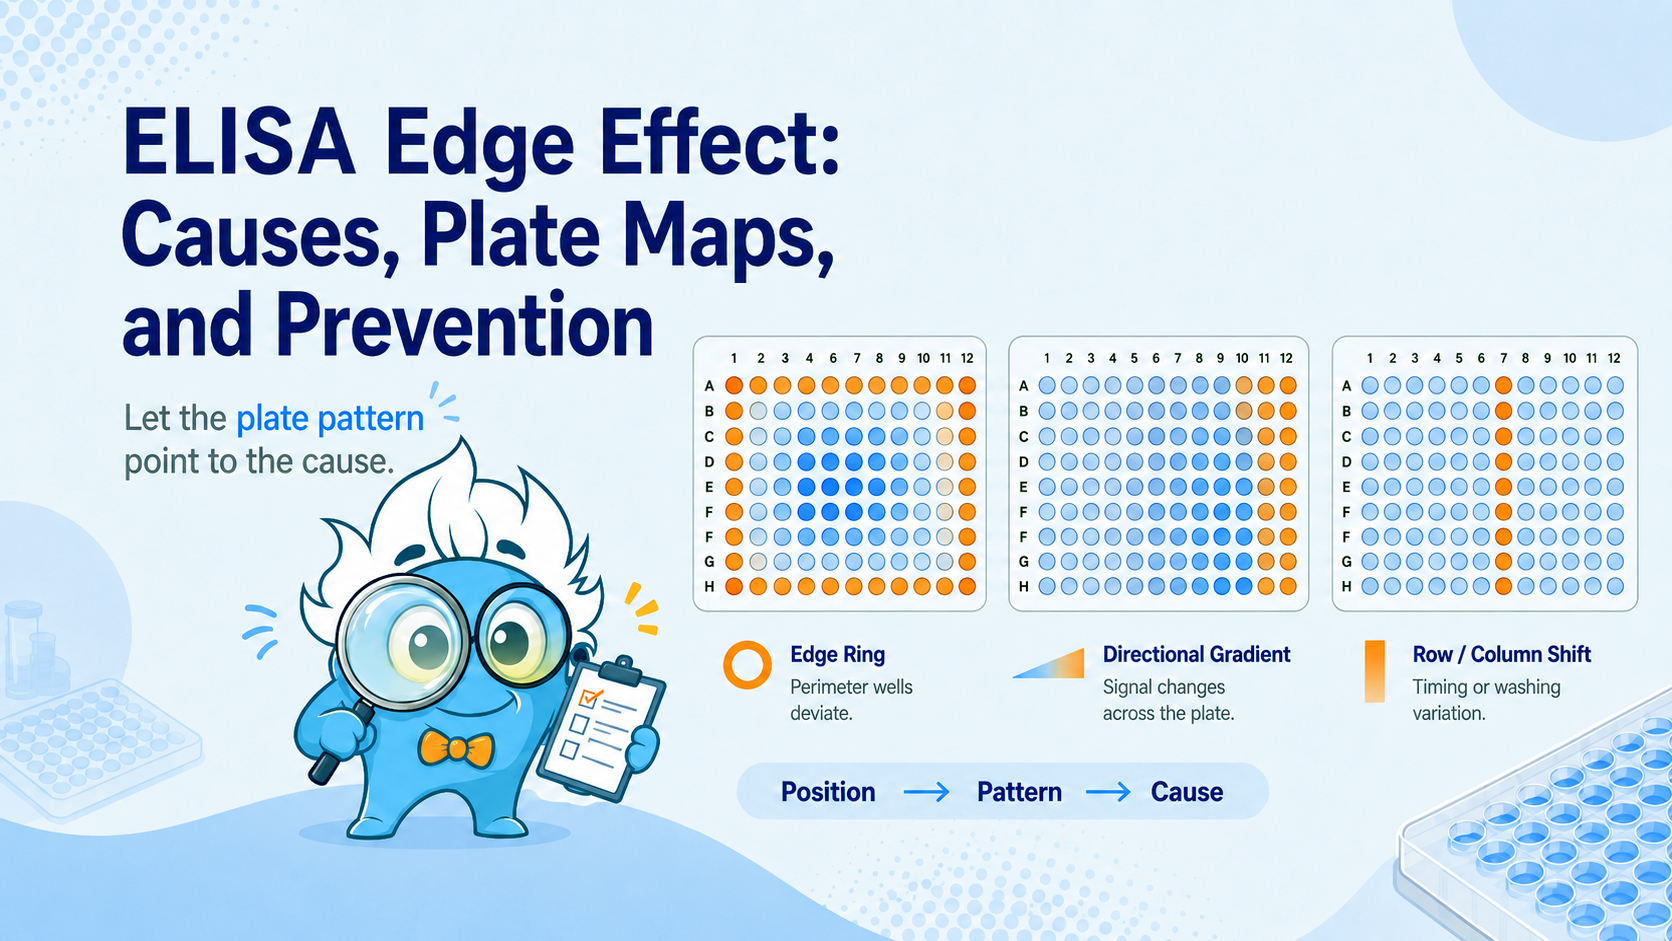
    Four ELISA plate maps comparing a perimeter ring, directional gradient, row or column artifact, and scattered outliers

    Figure 2. Four common plate patterns. A perimeter ring is different from directional timing drift, row/column artifacts, and scattered outliers.

    For a broader checklist covering weak signal, high background, poor replicates, and inconsistent runs, use Boster Bio’s ELISA troubleshooting guide.

    2. Why Do Outer ELISA Wells Read Higher or Lower?

    Several mechanisms can act at the same time. The dominant factor depends on assay format, incubation conditions, sealing, plate material, washing, and the stage at which the pattern develops.
    Why outer wells may read higher

    • Faster or different temperature equilibration. Peripheral wells may experience different thermal conditions from inner wells. Historical studies of microtiter plates documented measurable edge-to-center temperature differences and linked them to rim-shaped assay variation. [1,2]
    • Evaporation-related concentration changes. Loss of liquid can change the effective concentration of analyte, conjugate, s
    • ...
    Read more
    ELISA Edge Effect: Causes, Plate Maps, and Prevention