Click image to see more details
-

-
-
-
-
+36
Product Info Summary
| SKU: | PA2140-1 |
|---|---|
| Size: | 100 μg/vial |
| Reactive Species: | Human, Mouse |
| Host: | Rabbit |
| Application: | IHC, WB |
Customers Who Bought This Also Bought

Product info
Product Name
Anti-Collagen I/COL1A1 Antibody Picoband®
SKU/Catalog Number
PA2140-1
BA0325 is an alternative SKU for this antibody, used in previous lots.
Size
100 μg/vial
Form
Lyophilized
Description
Boster Bio Anti-Collagen I/COL1A1 Antibody catalog # PA2140-1. Tested in IHC, WB applications. This antibody reacts with Human, Mouse The brand Picoband indicates this is a premium antibody that guarantees superior quality, high affinity, and strong signals with minimal background in Western blot applications. Only our best-performing antibodies are designated as Picoband, ensuring unmatched performance. COL1A1 encodes the pro-α1 chain of type I collagen, described as the major fibrillar collagen component of most connective tissues (abundant in bone, cornea, dermis, tendon); the type I triple helix comprises two α1 chains and one α2 chain. Assay context: antibody validated for IHC and WB; reactive to COL1A1 in human/mouse; reported observed MW ~180–200 kDa with stated no cross-reactivity. Commonly used to frame extracellular-matrix deposition/fibrosis and tissue remodeling (putative), frequently interpreted with stromal regulators such as POSTN and vascular components such as CD34 (putative); spatial quantification and clinical-style interpretation are often built around IHC and, when needed, pathology review.
Storage & Handling
At -20°C for one year from date of receipt. After reconstitution, at 4°C for one month. It can also be aliquotted and stored frozen at -20°C for six months. Avoid repeated freezing and thawing.
Cite This Product
Anti-Collagen I/COL1A1 Antibody Picoband® (Boster Biological Technology, Pleasanton CA, USA, Catalog # PA2140-1)
Host
Rabbit
Contents
Each vial contains 4 mg Trehalose, 0.9 mg NaCl and 0.2 mg Na2HPO4.
Clonality
Polyclonal
Isotype
Rabbit IgG
Immunogen
A synthetic peptide corresponding to a sequence at the C-terminus of human Collagen I, different from the related rat and mouse sequences by two amino acids.
Cross-reactivity
No cross-reactivity with other proteins
Reactive Species
PA2140-1 is reactive to COL1A1 in Human, Mouse
Observed Molecular Weight
180-200 kDa
Calculated molecular weight
138.9 kDa
Background of COL1A1
Collagen, type I, alpha 1, also known as COL1A1, is a human gene that encodes the major component of type I collagen, the fibrillar collagen found in most connective tissues, including cartilage. This gene is mapped to 17q21.33. This gene encodes the pro-alpha1 chains of type I collagen whose triple helix comprises two alpha1 chains and one alpha2 chain. Type I is a fibril-forming collagen found in most connective tissues and is abundant in bone, cornea, dermis and tendon. Mutations in this gene are associated with osteogenesis imperfecta types I-IV, Ehlers-Danlos syndrome type VIIA, Ehlers-Danlos syndrome Classical type, Caffey Disease and idiopathic osteoporosis.
Antibody Validation
Boster validates all antibodies on WB, IHC, ICC, Immunofluorescence, and ELISA with known positive control and negative samples to ensure specificity and high affinity, including thorough antibody incubations.
Application & Images
Applications
PA2140-1 is guaranteed for IHC, WB Boster Guarantee
Recommend Dilution
| Application | Dilution | Species |
|---|---|---|
| Western blot | 0.25-0.5μg/ml | Human, Mouse |
| Immunohistochemistry (Paraffin-embedded Section) | 2-5μg/ml | Human |
Tested application
Suggested blocking solution with 5% non-fat milk or BSA; (*)Recommended protein loading: 20-40 µg per lane
Use TE buffer pH 9.0 for antigen retrieval; (*) citrate buffer pH 6.0 is an alternative.
Validation Images & Assay Conditions
Click image to see more details
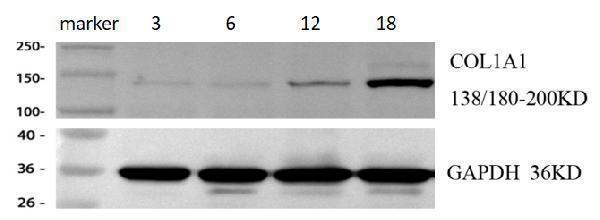
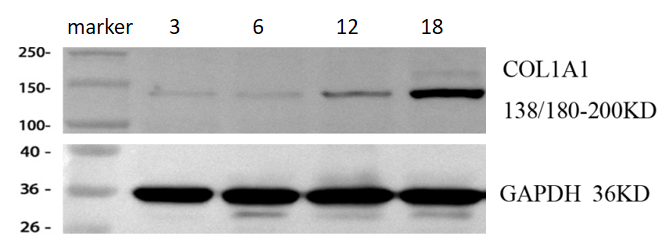
Western blot analysis of COL1A1 using anti-COL1A1 antibody (PA2140-1).
Electrophoresis was performed on a 5-20% SDS-PAGE gel at 70V (Stacking gel) / 90V (Resolving gel) for 2-3 hours. The sample well of each lane was loaded with 30 ug of sample under reducing conditions.
Lane 1: cardiac tissue lysates from 3-month-old mice,
Lane 2: cardiac tissue lysates from 6-month-old mice,
Lane 3: cardiac tissue lysates from 12-month-old mice,
Lane 4: cardiac tissue lysates from 18-month-old mice.
After electrophoresis, proteins were transferred to a nitrocellulose membrane at 150 mA for 50-90 minutes. Blocked the membrane with 5% non-fat milk/TBS for 1.5 hour at RT. The membrane was incubated with rabbit anti-COL1A1 antigen affinity purified polyclonal antibody (Catalog # PA2140-1) at 1:2000 overnight at 4°C, then washed with TBS-0.1%Tween 3 times with 5 minutes each and probed with a goat anti-rabbit IgG-HRP secondary antibody at a dilution of 1:10000 for 1 hour at RT. The signal is developed using an Enhanced Chemiluminescent detection (ECL) kit (Catalog # EK1002) with ChemiDoc MP system. A specific band was detected for COL1A1 at approximately 138 kDa. The expected band size for COL1A1 is at 138 kDa.

Click image to see more details
RAL preserved the matrix of cartilage and bone and inhibited the overexpression of TGF-β1 and catabolic factors. Expression of aggrecan, Col-II, MMP-13, ADAMTS-5, Col-X, TGF-β1, and Col-I (scale bar, 100 μm). Col-II: Collagen type II; MMP-13: Matrix metalloproteinase-13; ADAMTS-5: A disintegrin and metalloproteinase with thrombospondin motifs-5; Col-X: Collagen type X; TGF-β1: Transforming growth factor-beta 1; Col-I: Collagen type I.
Index in PubMed under a CC BY license. PMID: 33259777

Click image to see more details
TRPM8 inhibitor mitigates liver fibrosis in CCl 4 -treated mice. A H&E, Sirius Red, Masson’s trichrome, and IHC staining for α-SMA and COL1A1 in liver sections of CCl 4 -treated mice (n = 5 per group). Image J was used to quantify positively stained areas. Scale bars, 100 μm. B Serum levels of ALT and AST were measured in mice (n = 5 per group). C Expressions of α-SMA and COL1A1 were detected by immunoblotting (n = 3 per group). D Hepatic mRNAs of fibrogenic genes were measured by qRT-PCR assays in mice treated with M8-B or DMSO after CCl 4 induction (n = 5 per group). The results are expressed as mean ± SD. * P < 0.05, ** P < 0.01
Index in PubMed under a CC BY license. PMID: 35525986

Click image to see more details
Liver fibrosis is attenuated in TRPM8 −/− mice after CCl 4 treatment. A Representative histology of H&E, Sirius Red, Masson’s trichrome, and IHC staining for α-SMA and COL1A1 in the liver of WT and TRPM8 −/− mice induced by CCl 4 (n = 5 per group). Positive staining areas were quantified by by Image J software. Scale bars, 100 μm. B Liver function was assessed by measuring the serum levels of ALT and AST in mice (n = 5 per group). C Immunoblotting analyses of α-SMA and COL1A1 expression in the liver (n = 3 per group). D Hepatic mRNA levels of fibrogenic genes were measured by qRT-PCR (n = 5 per group). The results are expressed as the mean ± SD. * P < 0.05, ** P < 0.01, *** P < 0.001, **** P < 0.0001
Index in PubMed under a CC BY license. PMID: 35525986

Click image to see more details
MiR-619-5p is down-regulated and inhibits osteogenesis during osteogenic induction of hBMSCs. (A) The relative expression levels of miR-619-5p before and after osteogenic differentiation were determined by qRT-PCR. (B) Correlation analysis of LINC01485 and miR-619-5p expression levels during osteogenic differentiation. (C, D) The mRNA level of miR-619-5p in hBMSCs transfected with miR-199a-5p mimic (C) and miR-199a-5p inhibitor (D) by qRT-PCR. (E–I) Western blot analysis of the RUNX2 (E, F) , COL1A1 (E, G) , OSX (E, H) , and OPN (E, I) protein expression in hBMSCs transfected with miR-619-5p mimic, miRNA mimic NC, miR-619-5p inhibitor, and miRNA inhibitor NC after osteogenic induction and the corresponding gray value quantitative analysis. (J) ALP staining analysis of hBMSCs transfected with miR-619-5p mimic, miRNA mimic NC, miR-619-5p inhibitor, and miRNA inhibitor NC after osteogenic induction. * p < 0.05, ** p < 0.01, *** p < 0.001.
Index in PubMed under a CC BY license. PMID: 35663324

Click image to see more details
LNC01485 expression was up-regulated during osteogenic differentiation of hBMSCs. (A, C) ALP staining (A) and ALP activity assay (C) of hBMSCs before osteogenic induction and 7 days after induction. (B, D) hBMSCs were stained with Alizarin Red S (B) before osteogenic induction and at 14 days after induction, and the staining results were analyzed semi-quantitatively (D) . (E-I) The protein expression levels of RUNX2 (E, F) , COL1A1 (E, G) , OSX (E, H) , and OPN (E, I) level on Days 0, 7, 14, and 21 of osteogenic induction were detected by Western blot and quantified analysis by normalized to GAPDH. (J-O) The mRNA expression levels of RUNX2 (J) , OPN (K) , OCN (L) , COL1A1 (M) , OSX (N) , and LINC01485 (O) before and after osteogenic differentiation were determined by qRT-PCR. (P-R) Expression correlation analysis between LINC01485 and osteogenic genes RUNX2 (P) , OPN (Q) , and OCN (R) during osteogenic differentiation. * p < 0.05, ** p < 0.01, *** p < 0.001.
Index in PubMed under a CC BY license. PMID: 35663324

Click image to see more details
Western blot analysis of COL1A1 using anti-COL1A1 antibody (PA2140-1).
Electrophoresis was performed on a 5-20% SDS-PAGE gel at 70V (Stacking gel) / 90V (Resolving gel) for 2-3 hours. The sample well of each lane was loaded with 30 ug of sample under reducing conditions.
Lane 1: human HK2 whole cell lysates,
Lane 2: human HCC tissue lysates,
Lane 3: mouse NIH/3T3 whole cell lysates.
After electrophoresis, proteins were transferred to a nitrocellulose membrane at 150 mA for 50-90 minutes. Blocked the membrane with 5% non-fat milk/TBS for 1.5 hour at RT. The membrane was incubated with rabbit anti-COL1A1 antigen affinity purified polyclonal antibody (Catalog # PA2140-1) at 0.5 μg/mL overnight at 4°C, then washed with TBS-0.1%Tween 3 times with 5 minutes each and probed with a goat anti-rabbit IgG-HRP secondary antibody at a dilution of 1:5000 for 1.5 hour at RT. The signal is developed using an Enhanced Chemiluminescent detection (ECL) kit (Catalog # EK1002) with Tanon 5200 system. A specific band was detected for COL1A1 at approximately 180-200 kDa. The expected band size for COL1A1 is at 138 kDa.

Click image to see more details
Effect of KCNMA1-AS1 on osteogenic differentiation of hBMSCs with the SMAD9 signaling pathway activation. A and B- Protein levels of total SMAD9 and p-SMAD9 in lentivirus-transfected hBMSCs treated with DMSO or LDN193189 (100nM) detected by western blot after one week of osteogenic induction. GAPDH as the internal reference. C and D- The expression levels of COL1A1, RUNX2, OSX, and OPN in lentivirus-transfected hBMSCs treated with DMSO or LDN193189 (100nM) detected by western blot after one week of osteogenic induction. GAPDH as the reference. E and F- ALP staining ( E ) and ALP activity ( F ) in lentivirus-transfected hBMSCs treated with DMSO or LDN193189 (100nM) after one week of osteogenic induction. Scale bar of microscopical images, 100 μm. G and H- ARS staining ( G ) and ARS quantification ( H ) in lentivirus-transfected hBMSCs treated with DMSO or LDN193189 (100nM) after 14 days of osteogenic induction. Scale bar of microscopical images, 100 μm. **** P < 0.0001, compared with KCNMA1-AS1 + DMSO.
Index in PubMed under a CC BY license. PMID: 38017487

Click image to see more details
IHC analysis of COL1A1 using anti-COL1A1 antibody (PA2140-1).
COL1A1 was detected in a paraffin-embedded section of human colon adenocarcinoma tissue. Heat mediated antigen retrieval was performed in EDTA buffer (pH 8.0, epitope retrieval solution). The tissue section was blocked with 10% goat serum. The tissue section was then incubated with 2 μg/ml rabbit anti-COL1A1 Antibody (PA2140-1) overnight at 4°C. Biotinylated goat anti-rabbit IgG was used as secondary antibody and incubated for 30 minutes at 37°C. The tissue section was developed using Strepavidin-Biotin-Complex (SABC) (Catalog # SA1022) with DAB as the chromogen.

Click image to see more details
Verification of Hub Genes (A).Barplot of mRNA expression levels of THBS2 between IPF and control group. (B).Barplot of mRNA expression levels of THBS2 between RA-UIP and control group. (C).Barplot of mRNA expression levels of TIMP1 between IPF and control group. (D).Barplot of mRNA expression levels of TIMP1 between RA-UIP and control group. (E).Barplot of mRNA expression levels of POSTN between IPF and control group. (F).Barplot of mRNA expression levels of POSTN between RA-UIP and control group. (G).Barplot of mRNA expression levels of CD19 between the IPF and control group. (H).Barplot of mRNA expression levels of CD19 between RA-UIP and control group. (I).Barplot of mRNA expression levels of α-SMA, COL1A1, and hub genes between TGF-β1-stimulated fibroblast group and control group. (J).Images of H&E staining (H&Ex200) and immunohistochemical staining (DABx200) of bleomycin-induced mouse group and control group. (K).Scatter plots of positive immunostained area proportions of α-SMA, COL1A1, and hub genes between bleomycin-induced mouse group and control group. (L).Boxplot of mRNA expression levels of hub genes between IPF and control group on dataset GSE150910. (M).Boxplot of mRNA expression levels of hub genes between RA and control group on dataset GSE89408.
Index in PubMed under a CC BY license. PMID: 38571583

Click image to see more details
IHC analysis of COL1A1 using anti-COL1A1 antibody (PA2140-1).
COL1A1 was detected in a paraffin-embedded section of human gastric carcinomaa tissue. Heat mediated antigen retrieval was performed in EDTA buffer (pH 8.0, epitope retrieval solution). The tissue section was blocked with 10% goat serum. The tissue section was then incubated with 2 μg/ml rabbit anti-COL1A1 Antibody (PA2140-1) overnight at 4°C. Biotinylated goat anti-rabbit IgG was used as secondary antibody and incubated for 30 minutes at 37°C. The tissue section was developed using Strepavidin-Biotin-Complex (SABC) (Catalog # SA1022) with DAB as the chromogen.

Click image to see more details
Increased expression of HIF-1α and ANGPTL4 in CKD rats. A Immunohistochemical staining to assess the expression of HIF-1α, ANGPTL4, α-SMA, and Col-I in the renal tissues of the two groups (× 200 magnification, scale bar = 50 µm). B – E Quantification of immunohistochemical staining (n = 5/group). F – I qRT‒PCR analysis of the expression of Hif-1α , Angptl4 , α-sma , and Col-I mRNA in the renal tissues of the two groups of rats. All the data are presented as the mean ± standard deviation; * P < 0.05, ** P < 0.01 vs. the corresponding control group at the same time point
Index in PubMed under a CC BY license. PMID: 38992710

Click image to see more details
IHC analysis of COL1A1 using anti-COL1A1 antibody (PA2140-1).
COL1A1 was detected in a paraffin-embedded section of human spleen tissue. Heat mediated antigen retrieval was performed in EDTA buffer (pH 8.0, epitope retrieval solution). The tissue section was blocked with 10% goat serum. The tissue section was then incubated with 2 μg/ml rabbit anti-COL1A1 Antibody (PA2140-1) overnight at 4°C. Biotinylated goat anti-rabbit IgG was used as secondary antibody and incubated for 30 minutes at 37°C. The tissue section was developed using Strepavidin-Biotin-Complex (SABC) (Catalog # SA1022) with DAB as the chromogen.

Click image to see more details
In situ dural mater regeneration enhanced by Janus SIS in a rat spinal dural defect model. a Experimental design include MRI, histological analysis and immunology evaluations. b Macroscopic photographs of spinal tissues at 8 weeks after operation, including the normal control (without injury), control group, SIS group and Janus SIS group. c , d Histological evaluation (H&E and Masson’s trichrome staining) of spinal dural mater repair in different groups. The blue arrow indicates the normal spinal dura mater. The red arrow indicates newborn dura mater-like tissue. The green arrow indicates fibrotic tissue. The black arrow indicates residual SFMA microgroove coating. e Immunohistochemical staining of α-SMA and collagen I at the focal area of epidural tissues in different groups. f Quantitative analysis of newborn collagen tissue in the defect area. g , h Quantitative analysis of α-SMA positive cells and collagen I expression in histological sections. One-way analysis of variance (ANOVA) with a Tukey’s post hoc test was used for multiple comparisons. Values in ( f , g , and h ) represent the mean ± SD (three independent replicates ( n = 3)). Source data and exact P -values are provided as a source data file. (* P < 0.05, ** P < 0.01, *** P < 0.001).
Index in PubMed under a CC BY license. PMID: 39955276

Click image to see more details
The morphology, proliferation, and collagen I expression of fibroblasts cultured on silk-based coatings. a , b CLSM and SEM images of the cytoskeleton and morphology of NIH3T3 fibroblasts on the unmodified SIS, SFMA-SIS, SFMA microgrooved surface, and HAMA-SilMA surface. c Immunofluorescence staining of collagen I secreted by fibroblasts on the unmodified SIS, SFMA-SIS, and SFMA microgrooved surfaces. d Cell proliferation analysis on different surfaces using the CCK-8 Kit. Values in ( d ) represent the mean ± SD (three independent replicates ( n = 3)). One-way analysis of variance (ANOVA) with a Tukey’s post hoc test was used for multiple comparisons. Source data and exact P -values are provided as a source data file. (* P < 0.05, ** P < 0.01, *** P < 0.001).
Index in PubMed under a CC BY license. PMID: 39955276

Click image to see more details
IF staining images of (a) BMP-2, (b) COL-1, (c) OCN, and (d) OPN in BMSCs (red: osteogenic proteins and genes; green: cytoskeleton; blue: nucleus).
Index in PubMed under a CC BY license. PMID: 10.1142/S1793545824420021

Click image to see more details
GCLC was dramatically decreased in liver tissues of patients with HCV-related liver fibrosis. Liver tissues from healthy liver transplant donor ( n = 5) and patients with HCV-related liver fibrosis ( n = 8) were detected. (A) Liver fibrosis was evaluated with Masson staining, and expression of α-SMA, COL1, and GCLC were detected by IHC. Positive staining was indicated by brown color. (B–D) Expression of α-SMA, COL1, and GCLC in liver tissues of HCV patients was detected by qRT-PCR (B) and Western blot (C,D) . (E–G) Expression of ER stress-related genes in liver tissues of HCV patients was detected by qRT-PCR (E) and Western blot (F,G) . (H–J) Expression of inflammatory factor NF-κB, IKKB, and TNFα in liver tissues of HCV patients was detected by qRT-PCR (H) and Western blot (I,J) . (K–M) Expression of fibrotic genes such as TGFβ1, MMP2, and TIMP1 in liver tissues of HCV patients was detected by qRT-PCR (K) and Western blot (L,M) . * P < 0.05, ** P < 0.01. HC: healthy control.
Index in PubMed under a CC BY license. PMID: 33015132

Click image to see more details
Overexpression of GCLC could suppress the activation of HSC. (A–C) Expression of GCLC, α-SMA, COL1, TGFβ1, MMP2, and TIMP1 in LX-2 cells transfected by puc19, puc19-hGCLC, and GCLC-expressing LX-2 cells treated with L-BSO was detected by qRT-PCR (A) and Western blot (B,C) . (D–F) The level of total GSH (D) , GSH (E) , and 2GSH/GSSG ratio (F) was increased in LX-2 cells transfected with the puc19-hGCLC plasmid. (G–H) ROS-DCF was dramatically decreased in LX-2 cells transfected with the puc19-hGCLC plasmid. (I–K) Expression of ER stress-related gene GRP78, CHOP, and IRE1 in LX-2 cells transfected with puc19 and puc19-hGCLC plasmid was detected by qRT-PCR (I) and Western blot (J,K) . (L–N) Expression of inflammatory factors NF-κB, IKKB, and TNFα mRNA and protein was detected by qRT-PCR (L) and Western blot (M,N) . * P < 0.05, ** P < 0.01; # P < 0.05, ## P < 0.01.
Index in PubMed under a CC BY license. PMID: 33015132

Click image to see more details
The HIF-1α-ANGPTL4 pathway is activated in hypoxia-induced HK2 cell fibrosis. After 24 h of hypoxia induction in HK2 cells, an in vivo model of RIF induction was established. A Western blot analysis was conducted to assess the protein levels of HIF-1α, ANGPTL4, α-SMA, and Col-I, and the protein levels were quantified using ImageJ software (n = 3/group) ( B – E ). F – I qRT‒PCR was used to measure the mRNA expression of HIF-1α , ANGPTL4 , α-SMA , and COL-I in each group. J – L Immunofluorescence staining for HIF-1α and ANGPTL4 (× 200 magnification, scale bar = 100 µm). All the data are presented as the mean ± standard deviation. * P < 0.05, ** P < 0.01 vs. the control group
Index in PubMed under a CC BY license. PMID: 38992710

Click image to see more details
Panx1 knockout mitigates renal fibrosis in a murine model of unilateral ischemia‒reperfusion injury. a Relative mRNA levels of Collagen I , Fibronectin , and αSMA in the renal tissue. b , c Representative immunoblots and quantification of Collagen I and α-SMA in renal tissue. Representative images and quantification of d , e Sirius Red, f Collagen I, and g Fibronectin staining in renal tissue. Scale bars, 50 µm (Sirius Red); 20 µm (Collagen I, Fibronectin). For all panels, data are from WT Sham (n = 6), K/O Sham (n = 6), WT d14-IRI (n = 8), K/O d14-IRI (n = 7), WT d28-IRI (n = 8), K/O d28-IRI (n = 8) mice. Data are presented as means ± SD. P values were determined by one-way ANOVA with Dunnet’s correction for multiple comparisons. Exact P values are provided in the Source Data file. *P < 0.05, **P < 0.01, ***P < 0.001.
Index in PubMed under a CC BY license. PMID: 40825974

Click image to see more details
Impact of HIF-1α inhibitors on the levels of ANGPTL4 and fibrosis. HK2 cells were subjected to 2-MeOE2 (5 μmol/L) pretreatment for 12 h, followed by 24 h of hypoxia. A Western blot analysis was used to assess the protein levels of HIF-1α, ANGPTL4, α-SMA, and Col-I, and the protein levels were quantified using ImageJ software (n = 3/group) ( B – E) . F – I qRT‒PCR was utilized to evaluate the mRNA expression of HIF-1α , ANGPTL4 , α-SMA , and COL-I in each group. All the data are presented as the mean ± standard deviation. * P < 0.05, ** P < 0.01 vs. the control group; # P < 0.05, ## P < 0.01 vs. the model group
Index in PubMed under a CC BY license. PMID: 38992710

Click image to see more details
Reducing or overexpressing ANGPTL4 affects HK2 cell fibrosis. HK2 cells were transfected with ANGPTL4 siRNA for 24 h, followed by hypoxia-induced fibrosis for an additional 24 h. A Western blotting analysis was conducted to assess the protein levels of ANGPTL4, HIF-1α, α-SMA, and Col-I, and the protein levels were quantified using ImageJ software (n = 3/group) ( B – E ). F – I qRT‒PCR was used to evaluate the mRNA levels of ANGPTL4 , HIF-1α , α-SMA , and COL-I in each group. HK2 cells were transfected with the ANGPTL4 plasmid for 48 h. J Western blotting analysis was used to evaluate the protein levels of ANGPTL4, HIF-1α, α-SMA, and Col-I, and quantitative analysis was carried out using ImageJ software ( K – N ). O – R qRT‒PCR was utilized to examine the mRNA expression of ANGPTL4 , HIF-1α , α-SMA , and COL-I in each group. All the data are presented as the mean ± standard deviation. * P < 0.05, ** P < 0.01 compared to the control group; # P < 0.05, ## P < 0.01 compared to the scrambled siRNA ( +) or pcDNA3.1 ( +) group; ns: not significant
Index in PubMed under a CC BY license. PMID: 38992710

Click image to see more details
LINC01485 regulates osteogenic differentiation of hBMSCs. (A, B) The overexpression (A) and interference (B) efficiency of LINC01485 was determined by qRT-PCR in hBMSCs after transduction with LV-LINC01485 and sh-LINC01485. (C–F) The mRNA levels of RUNX2 (C) , COL1A1 (D) , OSX (E) , and OCN (F) after 14 days of osteogenic induction in hBMSC infected with lentivirus by qRT-PCR. (G, H) Western blot analysis of the RUNX2 (G, I) , COL1A1 (G, I) , OSX (G, J) , and OPN (G, K) protein expression in hBMSCs infected with lentivirus after osteogenic induction 14 days later and the corresponding gray value quantitative analysis. (L, M) ALP staining (L) and ALP activity (M) of hBMSC cells infected with lentivirus after 7 days of osteogenic induction. (N, O) Alizarin Red S staining (N) and semi-quantitative analysis (O) of infected hBMSCs with lentivirus after 14 days osteogenic induction. * p < 0.05, ** p < 0.01, *** p < 0.001.
Index in PubMed under a CC BY license. PMID: 35663324

Click image to see more details
Wnt upregulation is associated with macrophages polarization and activation in vitro . ( A ) Characterization of the isolated bone marrow-derived macrophage (BMDM). Immunofluorescence staining for F4/80 showed the purity of cultured BMDMs. Scale bar, 25 µm. ( B ) BMDMs were induced to M1 polarization using of IFN-γ and LPS, and the expressions of various Wnts were detected by qRT-PCR. ( C ) BMDMs were induced to M2 polarization by IL-4, and the expressions of various Wnts were detected by qRT-PCR. ( D ) Western blot analyses showed that Wnts mixture induced M1 polarization by upregulating CD86 and TNF-α. ( E - F ) Quantitative data of CD86 and TNF-α in different groups as indicated. * P < 0.05 versus controls (n=3). ( G - I ) qRT-PCR showed that Wnts induced the mRNA expression of M1 polarization markers such as iNOS, IL-1β and CD86. ( J ) Western blotting showed that Wnts induced M2 polarization markers mannose receptor (MR) and arginase-1. ( K , L ) Quantitative data of MR and arginase 1 proteins. * P < 0.05 versus controls (n=3). ( M , N ) qRT-PCR showed that Wnts induced the mRNA expression of MR and TGF-β1. ( O ) Western blotting showed that Wnts induced fibrosis-related proteins such as fibronectin, collagen I and α-SMA in BMDMs. ( P ) Quantitative data of fibronectin (FN), collagen I (Col I) and α-smooth muscle actin (α-SMA) proteins. * P < 0.05 versus controls (n=3). ( Q ) qRT-PCR showed that Wnts induced the mRNA expression of FN, Col I and α-SMA. * P < 0.05 versus controls (n=3).
Index in PubMed under a CC BY license. PMID: 38617540

Click image to see more details
LINC01485 acts as a ceRNA of miR-619-5p to regulate RUNX2 and osteogenic differentiation. (A–E) Western blot analysis of the RUNX2 (A, B) , COL1A1 (A, C) , OSX (A, D) , and OPN (A, E) protein expression in hBMSCs infected with sh-NC or sh-LINC01485 lentivirus along with miRNA inhibitor NC or miR-619-5p inhibitor after osteogenic induction and the corresponding gray value quantitative analysis. (F) ALP staining analysis of hBMSCs infected with sh-NC or sh-LINC01485 lentivirus along with miRNA inhibitor NC or miR-619-5p inhibitor after osteogenic induction. (G) ALP staining analysis of hBMSCs infected with LV-NC or LV-LINC01485 lentivirus along with miRNA mimic NC or miR-619-5p mimic after osteogenic induction. (H) Luciferase activity of RUNX2-WT upon transfection of pcDNA3.1, pcDNA3.1-LINC01485, or miR-619-5p mimic into HEK293T cells. ns, none significance. * p < 0.05, ** p < 0.01, *** p < 0.001.
Index in PubMed under a CC BY license. PMID: 35663324

Click image to see more details
FAK inhibitor decreased collagen deposition and inhibited CAF activation. A Diagram depicting treated time schedule with FAK inhibitors for the subcutaneous KL tumor model. B IHC staining for p-FAK in KL tumors treated with FAK inhibitor at different time points (Day 3, 7,14). Scale bars, 200 μm. C GO analysis for significantly downregulated genes in KL tumors treated with FAK inhibitors at Day14 compared to control (left) and treated with FAK inhibitors at Day14 compared to Day7. Representative IHC or immunofluorescent staining and quantification of D Collagen I, scale bars, 200 μm. E Collagen III, scale bars, 200 μm. F FAP, scale bars, 50 μm. G α-SMA, scale bars, 50 μm, in KL tumors treated with FAK inhibitor at different time points (Day 3, 7,14). Red, FAP staining; green, α-SMA staining; blue, DAPI staining. Unpaired Student’s t -test was performed and results in each group were presented as mean ± SEM. *p < 0.05, **p < 0.01, ***p < 0.001, and ns p-values with no statistical difference. KL, KRAS G12D LKB1 −/− ; CAF, cancer-associated fibroblast; FAK, focal adhesion kinase; FAP, fibroblast activation protein; SMA, smooth muscle actin; IHC, immunohistochemistry; BP, biological process; CC, cellular component; MF, molecular function; SEM, standard error of mean
Index in PubMed under a CC BY license. PMID: 38291516

Click image to see more details
TRPM8 deficiency alleviates BDL-induced liver fibrosis in mice. A Representative images of H&E, Sirius Red, Masson’s trichrome, and IHC staining for α-SMA and COL1A1 in the liver of WT and TRPM8 −/− mice operated with BDL (n = 5 per group). Positive staining areas were quantified by Image J software. Scale bars, 100 μm. B Liver function was assessed by measuring the serum levels of ALT and AST in mice (n = 5 per group). C Immunoblotting analyses of α-SMA and COL1A1 expression in the liver (n = 3 per group). D Hepatic mRNA levels of fibrogenic genes were measured by qRT-PCR (n = 5 per group). The results are expressed as the mean ± SD. * P < 0.05, ** P < 0.01, *** P < 0.001, **** P < 0.0001
Index in PubMed under a CC BY license. PMID: 35525986

Click image to see more details
KL tumors had excessive collagen deposition and collagen blocks T cell infiltration into tumor nest. A GO analysis for significantly upregulated genes in KL tumors compared to KP tumors. Representative and related GO signal pathways among top 30 upregulated pathways were listed here. B Reactome analysis for significantly upregulated genes in KL tumors compared to KP tumors. Representative and related Reactome signal pathways among top 20 upregulated pathways were listed here. C GSEA analysis for ECM-receptor interaction and GAP junction in KL and KP tumors. D Heatmap of RNA-seq showing collagen-related genes statistically significant (FDR < 0.05) differentially expressed in KL subcutaneous tumors. E Representative images and quantification of area performed by Masson, Siruis Red, Collagen I and Collagen III. Unpaired Student’s t-test was used to compare the statistical significance between two groups. Scale bars, 100 μm. inset scale bars, 50 μm. F Representative images showing spatial relations between collagen deposition and CD8 + TILs infiltration. Scale bars, 100 μm. inset scale bars, 20 μm. G Representative images and quantification of CD8 + TILs infiltrated in tumor nest and stroma in two groups. Scale bars, 100 μm. Results in each group were presented as mean ± SEM. *p < 0.05, **p < 0.01, ***p < 0.001, and ns p-values with no statistical difference. KL, KRAS G12D LKB1 −/− ; KP, KRAS G12D TP53 −/− ; BP, biological process; CC, cellular component; MF, molecular function; ECM, extracelluar matrix; TIL, tumor infiltrating lymphocyte; SEM, standard error of mean
Index in PubMed under a CC BY license. PMID: 38291516

Click image to see more details
Characterization and trilineage differential potency of SMSCs from osteoarthritis (OA) keen synovium. (A) Surface marker expression of synovial mesenchymal stem cells (SMSCs). Results showed negativity for hematopoietic marker (CD34) and macrophage marker (CD68) and showed positivity for mesenchymal stem cell (MSC) markers like CD105 and CD90. (B) Multi-directional differentiation of SMSCs; chondrogenesis was accessed by safranin O staining (SO), osteogenesis was accessed by alizarin red S staining (ARS), and adipogenesis was accessed by Oil red O staining. (C) The EdU staining of SMSCs after the treatment of different concentrations of nocodazole (N) (5, 10, 25, 50, 100 nM) and docetaxel (D) (0.5, 1, 2.5, 5, 10 nM) in chondrogenic medium (CM) for 1 week. Scale bar, 100 μm. (D) Quantification of the data of (C) . n = 5. (E) The cell viability of SMSCs after the treatment of different concentrations of nocodazole (N) (5, 10, 25, 50, 100 nM) and docetaxel (D) (0.5, 1, 2.5, 5, 10 nM) in chondrogenic medium (CM) for 1 week. (F) Crystal violet staining of SMSCs after the treatment of different concentrations of nocodazole (N) (5, 10, 25, 50, 100 nM) and docetaxel (D) (0.5, 1, 2.5, 5, 10 nM) in chondrogenic medium (CM) for 1 week. Scale bar, 100 μm. (G) RT-qPCR analyses of SOX9 , COL2A1 , ACAN , RUNX2 , COL1A1 , and COL10A1 in SMSCs treated with nocodazole (N) and docetaxel (D) in chondrogenic medium (CM) for 1 week. 2.5 nM of docetaxel had significant effects on chondrogenesis in SMSCs. Data are represented as the mean ± SEM. * p < 0.05, ** p < 0.01, *** p < 0.001.
Index in PubMed under a CC BY license. PMID: 34746145

Click image to see more details
Impact of combining FAK inhibitor and PD-1 blockade on TME in KL mouse model. A Representative IHC staining of collagen I and quantification of collagen I staining area in different treatment schedule shown in Fig. A). Scale bars, 200 μm. B Representative IF staining of α-SMA and quantification of α-SMA staining area in different treatment schedule shown in Fig. A). Scale bars, 100 μm. C Representative IF staining of FAP and quantification of FAP staining area in different treatment schedule shown in Fig. A). Scale bars, 100 μm. D Quantification of CD8 + TILs and ratio of CD8 + T cells to Treg in each group. E Representative CD8 IHC staining and quantification of intratumoral primary tumor regions in each group. Scale bars, 100 μm. F Representative CD8 IHC staining and quantification of metastatic lung tumor regions in each group. Scale bars, 100 μm. Inset scale bars, 50 μm. Unpaired Student’s t -test was performed and results in each group were presented as mean ± SEM. *p < 0.05, **p < 0.01, ***p < 0.001, and ns p-values with no statistical difference. FAK, focal adhesion kinase; PD-1, programmed death-1; TME, tumor microenvironment; IHC, immunohistochemistry; IF, immunofluorescence; FAP, fibroblast activation protein; TIL, tumor infiltrating lymphocyte; Treg, regulatory T cell; SEM, standard error of mean
Index in PubMed under a CC BY license. PMID: 38291516

Click image to see more details
Statistical analysis of the results of immunohistochemistry. The quantified protein levels are listed as follows (IOD/mm 2 ): (A) Aggrecan; (B) Col-II; (C) MMP-13; (D) ADAMTS-5; (E) Col-X; (F) TGF-β1; and (G) Col-I. ^ p < 0.05 versus the ACLT + OVX group;* p < 0.05 versus the sham group. Col-II: Collagen type II; MMP-13: Matrix metalloproteinase-13; ADAMTS-5: A disintegrin and metalloproteinase with thrombospondin motifs-5; Col-X: Collagen type X; TGF-β1: Transforming growth factor-beta 1; Col-I: Collagen type I; IOD: Integrated optical density.
Index in PubMed under a CC BY license. PMID: 33259777

Click image to see more details
Activated CAF were abundant in KL tumors and fibroblastic FAK was hyperactivated. A The correlation between CAF infiltration and COL1A1 or COL3A1 via TIMER2.0. B The correlation between markers of activated CAF (FAP or α-SMA) and COL1A1 or COL3A1 via TIMER2.0. C Computed method calculating infiltrating levels of CAF in KP and KL subcutaneous tumors (n = 3 per each group) [ ]. D Expression levels of FAP in L929 cells, after co-cultured with KL or KP tumors cells for 72 h by RT-qPCR. The gene expression data of 72 h treated L929 cells were normalized to the DMEM control group. Additional TGF-β was used as positive control for activating CAF. Data represents mean ± SEM from three independent experiments. *p < 0.05, **p < 0.01, ***p < 0.001, and ns represents p-values with no statistical difference. E Representative immunofluorescent staining of sections from KL or KP tumors. Red, FAP staining; green, α-SMA staining; blue, DAPI staining. Scale bars, 200 μm. magnified scale bars,100 μm. F KEGG analysis for significantly upregulated genes in KL tumors compared to KP tumors. Representative and related KEGG signal pathways among top 30 upregulated pathways were listed here. G Immunofluorescence staining and IHC staining co-localizing CAF and activated FAK. Scale bars, 100 μm. magnified scale bars, 20 μm. KL, KRAS G12D LKB1 −/− ; KP, KRAS G12D TP53 −/− ; CAF, cancer-associated fibroblast; FAK, focal adhesion kinase; FAP, fibroblast activation protein; SMA, smooth muscle actin; IHC, immunohistochemistry; TGF-β, transforming growth factor-beta; DMEM, dulbecco's modified eagle's medium; SEM, standard error of mean
Index in PubMed under a CC BY license. PMID: 38291516

Click image to see more details
GCLC was decreased in activated HSC induced by condition medium from LO2-CORE and HepG2-CORE. (A1–C1) Expression of α-SMA, COL1, and GCLC in activated HSC induced by CM from LO2-CORE was detected by qRT-PCR (A1) and Western blot (B1,C1) . (A2–C2) Expression of ER stress-related genes GRP78, CHOP, and IRE1 in activated HSC was detected by qRT-PCR (A2) and Western blot (B2,C2) . (A3–C3) Expression of inflammatory factor NF-κB, IKKB, and TNFα in activated HSC was detected by qRT-PCR (A3) and Western blot (B3,C3) . (A4–C4) Expression of fibrotic genes such as TGFβ1, MMP2, and TIMP1 in activated HSC was detected by qRT-PCR (A4) and Western blot (B4,C4) . (D1–F1) Expression of α-SMA, COL1, and GCLC in activated HSC induced by CM from HepG2-CORE was detected by qRT-PCR (D1) and Western blot (E1,F1) . (D2–F2) Expression of ER stress-related genes in activated HSC was detected by qRT-PCR (D2) and Western blot (E2,F2) . (D3–F3) Expression of inflammatory factors in activated HSC was detected by qRT-PCR (D3) and Western blot (E3,F3) . (D4–F4) Expression of fibrotic genes in activated HSC was detected by qRT-PCR (D4) and Western blot (E4,F4) . * P < 0.05, ** P < 0.01. CM: conditioned medium.
Index in PubMed under a CC BY license. PMID: 33015132

Click image to see more details
KCNMA1-AS1 is upregulated when hBMSCs undergo osteogenic differentiation. A- Differentially expressed lncRNAs analyzed by qPCR after 14 days of osteogenic induction. B- Relative expression levels of KCNMA1-AS1 were measured using qPCR, and Glyceraldehyde 3-phosphate dehydrogenase (GAPDH) was used for normalization. C-F- Relative mRNA levels of COL1A1 ( C ), RUNX2 ( D ), OSX ( E ), and OPN ( F ) measured through qPCR, normalized to GAPDH. G and H- The protein levels of COL1A1, RUNX2, OSX, and OPN were detected by western blot. The internal reference is GAPDH. I and J- ALP staining ( I ) and ALP activity ( J ). hBMSCs cultured in osteogenic medium (OM) or growth medium (GM) for a week. Scale bar of microscopic images, 100 μm. K and L- ARS staining ( K ) and ARS quantification ( L ). hBMSCs were grown in an osteogenic medium (OM) or growth medium (GM) for two weeks. Scale bar of microscopical images, 100 μm. M-O- Correlation of the expression of KCNMA1-AS1 with that of COL1A1 ( M ), RUNX2 ( N ), and OSX ( O ) during osteogenic differentiation. ns: not significant, * P < 0.05, ** P < 0.01, *** P < 0.001, **** P < 0.0001, compared with 0 day/GM.
Index in PubMed under a CC BY license. PMID: 38017487

Click image to see more details
Ang II via NF- κ B and Smad pathways increases CTGF production and CTGF is involved in Ang II-induced ECM accumulation in LX-2 cells. Serum-starved LX-2 cells were preincubated for 0.5 h with BAY11-7082 (a specific NF- κ B inhibitor; 10 −6 M), or SIS3 (a specific Smad3 inhibitor, 10 −6 M) alone or simultaneously in the presence or absence of Ang II (10 −7 M) stimulation for 4 h (to detect CTGF) or 24 h (to detect type I collagen and fibronectin). Whole cell lysates were immunoblotted with antibodies against CTGF, type I collagen and fibronectin, respectively. β -Actin level served as a control for equal protein loading. ( A ) Representative immunoblot bands are shown for the indicated antibodies. ( B,C ) The histogram represents results of the densitometric scans for the protein bands of CTGF, type I collagen and fibronectin after normalization with β -actin. ( D ) CTGF concentrations in the cell supernatants were determined by ELISA, and the value in the vehicle control group was defined as 1.0. ( E ) Serum-starved LX-2 cells transiently transfected with scrambled siRNA or CTGF siRNA were treated with Ang II (10 −7 M) for 4 h (to detect CTGF) or 24 h (to detect type I collagen and fibronectin), respectively. After treatment, aliquots of whole cell lysates were subjected to immunoblotting with specific antibodies as indicated. β -Actin was used as an internal control. ( E ) The experiments were repeated thrice with similar results and representative immunoblot bands for CTGF, type I collagen and fibronectin are shown. ( F,G ) Fold-change in relative protein level of each protein is shown after normalizing with β -actin. All data are presented as mean ± SD of 3 independent experiments. # P < 0.05 versus vehicle- or scrambled siRNA-treated control cells; * P < 0.05 versus Ang II- or Ang II + scrambled siRNA-treated cells.
Index in PubMed under a CC BY license. PMID: 28798388

Click image to see more details
KCNMA1-AS1 promotes osteogenic differentiation of hBMSCs in vitro. A- Transfection efficiency of KCNMA1-AS1 overexpression and KCNMA1-AS1 knockdown was measured by qPCR, normalized to GAPDH. B-E- Relative mRNA levels of COL1A1 ( B ), RUNX2 ( C ), OSX ( D ), and OPN ( E ) in hBMSCs transfected with lentivirus measured by qPCR after one week of osteogenic induction, normalized to GAPDH. F and G- The protein levels of COLA1, RUNX2, OSX, and OPN in hBMSCs transfected with lentivirus detected by western blot after one week of osteogenic induction. GAPDH was used as the internal reference. H and I ALP staining ( H ) and ALP activity ( I ) in hBMSCs transfected with lentivirus after one week of osteogenic induction. Scale bar of microscopical images, 100 μm. J and K- ARS staining ( J ) and ARS quantification ( K ) in hBMSCs transfected with lentivirus after two weeks of osteogenic induction. Scale bar of microscopical images, 100 μm. * P < 0.05, ** P < 0.01, *** P < 0.001, **** P < 0.0001, in comparison to NC/sh-NC.
Index in PubMed under a CC BY license. PMID: 38017487

Click image to see more details
Kidney injury caused by hyperuricemia (HUA) in UNx mice. (A) The flowchart of the animal experiment. (B–D) Alteration of serum creatinine(scr), urea (SUN), and uric acid (SUA) in three groups of mice. The data are expressed as mean ± SEM (n = 6). (E) Representative images (40×) for hematoxylin and eosin(H&E) staining of kidney tissues and score of renal injury; green arrow points to renal interstitial inflammatory changes, the black arrow points to vacuolization and atrophy of the renal tubules. (F) Immunohistochemical staining of α-smooth muscle actin(α-SMA) in kidney tissues and percentage of α-SMA positive area. (G) immunohistochemical staining of collagen I in kidney tissues and percentage of collagen I positive area. (H-I) Concentrations of malondialdehyde(MDA) and superoxide dismutase(SOD) in kidney tissue; (J–L) Western blotting detection of expression of microtubule-associated protein 1 light chain 3 I/II(LC3I/II) and Beclin I in kidney tissue and histogram analysis. ns, not significant; *p < 0.05; **p < 0.01; ***p < 0.001. Analysis was performed by ANOVA followed by Tukey’s multiple comparison test. Sham, sham operations group; UNx, unilateral nephrectomy group; UNx + HPD, unilateral nephrectomy + adenine and potassium oxinate diet.
Index in PubMed under a CC BY license. PMID: 39132829

Click image to see more details
KCNMA1-AS1 promotes in vivo bone formation from hBMSCs. A- Xenograft tissue removed from the nude mice. B- Representative Micro CT scanning images of xenograft tissues. Scale bar, 500 μm. C-G- Bone volume or tissue volume (BV/TV) ( C ), bone surface/ tissue volume (BS/TV) ( D ), trabecular thickness (Tb.Th) ( E ), trabecular number (Tb.N) ( F ) and bone mineral density (BMD) ( G ) analyzed in xenograft tissues. H and I- HE staining ( H ) and Masson’s trichrome staining ( I ) of xenograft tissues. Scale bar, 50 μm. J-L - The expression levels of COL1A1 ( J ), RUNX2 ( K ), and OPN ( L ) in xenograft tissues evaluated by immunohistochemistry. Scale bar, 50 μm. * P < 0.05, ** P < 0.01, in comparison to NC/sh-NC.
Index in PubMed under a CC BY license. PMID: 38017487

Click image to see more details
Downregulation of circBNC2 promotes epithelial cell G2/M arrest after injury. a Western blots showing DHX9 expression in lysates from HK2 cells exposed to hypoxia or AA for 24 h. b, c The primer sets designed in the pre-mRNA of BNC2 precursor ( b ) and the transcript abundance of amplicons a-d relative to input, detected by RNA immunoprecipitation with anti-DHX9 in lysates from HK2 cells treated with hypoxia for 24 h, followed by qRT-PCR assay ( c ). d qRT-PCR showing DHX9, circBNC2, lBNC2 and pre-mRNA of BNC2 (pmBNC2) expression in 24-h hypoxia-treated HK2 cells transfected with siRNAs targeting DHX9. e The top 10 significantly enriched Gene Ontology (GO) terms of the differentially expressed genes in mRNA sequencing of circBNC2-KO HK2 cells compared to wild-type (WT). f – h Cell cycle analysis by flow cytometry in HK2 cells, showing knockout of circBNC2 induced G2/M cell cycle arrest ( f , g ), especially G2 phase cell ( h ). i , j Immunofluorescence staining for p-H3 in circBNC2-KO HK2 cells showing increase in G2 phase positive cells ( i ) and the quantification data ( j ). See also Supplementary Fig. . k , l Western blots showing cyclin B1 and cyclin D1 expression in circBNC2-KO HK2 cells ( k ) and the ratio of cyclin B1/cyclin D1 ( l ). m , n Secretion of TGF-β1 ( m ) and CTGF ( n ) by circBNC2-KO HK2 cells was examined by ELISA. o qRT-PCR showing mRNA levels of αSMA , COL1A1 , FN , TGFB1 and CTGF expression in circBNC2-KO HK2 cells. p , q Western blots showing protein levels of αSMA, Col I, and FN in circBNC2-KO HK2 cells ( p ), and the quantification data ( q ). r The top 10 significantly enriched Gene Ontology (GO) terms of the differentially expressed genes in mRNA sequencing of circBNC2-KO L-02 cells compared to wild-type. s – u Cell cycle analysis by flow cytometry in L-02 cells showing knockout of circBNC2 induced G2/M cell cycle arrest ( s, t ), especially G2 phase cell cycle arrest ( u ). While overexpression of circBNC2 partially rescued the G2/M cell cycle arrest in circBNC2-KO cells. v Levels of TGF-β1 in supernatants of circBNC2-KO L-02 cells, examined by ELISA. w – y Western blots showing protein levels of αSMA and Col I in LX-2 cells incubated with conditional medium (C.M.) from circBNC2-KO L-02 cells or WT L-02 cells for 24 or 48 h. For c , d , g , h , j , l – o , q , t – v , x , y , n = 3 biologically independent cells. Data are expressed as means ± SD. Two-sided T -test was used for the comparison of two groups ( c , h , j , l , m , n , o , q , u , v , x , y ). One-way ANOVA with Bonferroni post hoc test was used for comparison among multiple groups ( d , g , t ). Source data are provided as a file.
Index in PubMed under a CC BY license. PMID: 36316334

Click image to see more details
IF analysis of COL1A1 using anti-COL1A1 antibody (PA2140-1).
COL1A1 was detected in a paraffin-embedded section of human endometrial cancer tissue. Heat mediated antigen retrieval was performed in EDTA buffer (pH 8.0, epitope retrieval solution). The tissue section was blocked with 10% goat serum. The tissue section was then incubated with 5 μg/mL rabbit anti-COL1A1 Antibody (PA2140-1) overnight at 4°C. DyLight®550 Conjugated Goat Anti-Rabbit IgG (BA1135) was used as secondary antibody at 1:500 dilution and incubated for 30 minutes at 37°C. The section was counterstained with DAPI. Visualize using a fluorescence microscope and filter sets appropriate for the label used.
Specific Publications For Anti-Collagen I/COL1A1 Antibody Picoband® (PA2140-1)
Loading publications
Recommended Resources
Here are featured tools and databases that you might find useful.
- Boster's Pathways Library
- Protein Databases
- Bioscience Research Protocol Resources
- Data Processing & Analysis Software
- Photo Editing Software
- Scientific Literature Resources
- Research Paper Management Tools
- Molecular Biology Software
- Primer Design Tools
- Bioinformatics Tools
- Phylogenetic Tree Analysis
Customer Reviews
Have you used Anti-Collagen I/COL1A1 Antibody Picoband®?
Share your experimental results or join a short interview to earn up to $1,000 in product credits or other rewards.
1 Reviews For Anti-Collagen I/COL1A1 Antibody Picoband®
WB of COL1A1 (Cat# PA2140-1) in mouse cardiac tissues from 3-, 6-, 12-, and 18-month-old mice shows that COL1A1 levels clearly increase with age.
Excellent
| SKU | PA2140-1 |
|---|---|
| Application | Western Blot |
| Sample | mouse cardiac tissue |
| Sample Processing Description | Total protein was extracted from mouse cardiac tissues at 3, 6, 12, and 18 months of age. |
| Other Reagents | RIPA lysis buffer, Protease inhibitor, Running buffer, Transfer buffer, Blocking buffer |
| Primary Antibody | Collagen I/COL1A1 Antibody Picoband® |
| Primary Incubation | 1:2000, overnight at 4 ℃ |
| Secondary Antibody | HRP Conjugated AffiniPure Goat Anti-Rabbit IgG (H+L) (BA1054) |
| Secondary Incubation | 1:10000, 1 h in RT |
| Detection | Substrate: ECL substrate, Image system: ChemiDoc MP |
| Results Summary | This experiment aimed to investigate changes in COL1A1 expression in mouse cardiac tissues from 3-, 6-, 12-, and 18-month-old mice (representing young, middle-aged, middle-old, and old stages), and the results show that COL1A1 levels clearly increase with age. |
Huanping Qian, Ningxia Medical University
Verified customer
Submitted 2026-03-24
Customer Q&As
Have a question?
Find answers in Q&As, reviews.
Can't find your answer?
Submit your question
