This website uses cookies to ensure you get the best experience on our website.


- Table of Contents
An ELISA result can seem contradictory: a sample expected to contain a high concentration of the target produces a lower signal than a diluted sample. One possible explanation is the high-dose hook effect, an analytical interference that can cause some immunoassays to underestimate very high analyte concentrations.
A low optical density (OD), however, does not automatically indicate a hook effect. The sample may be outside the assay’s validated measuring range, affected by matrix interference, or subject to another analytical problem. The key is to examine how the signal changes with dilution and whether the resulting concentration estimates are consistent with the assay’s validated performance.
| Observation | What it may indicate | Next step |
|---|---|---|
| Undiluted sample has unexpectedly low signal; a dilution gives a stronger signal | Possible high-dose interference, but not proof | Test additional suitable dilutions and compare corrected concentrations |
| Signal approaches a plateau at the upper end | Possible upper-range limitation or saturation | Do not extrapolate beyond the validated range |
| Dilution-corrected concentrations disagree | Dilution behavior is not yet consistent | Review matrix effects, recovery, and procedural factors |
| Controls or replicates are also abnormal | A broader assay or procedural issue may be present | Review run conditions, reagents, and controls |
This quick check helps prioritize troubleshooting; it is not a standalone diagnostic test. The interpretation must follow the assay’s validated measuring range and acceptance criteria.
For a broader troubleshooting checklist, see Boster’s ELISA troubleshooting guide for saturated signals.
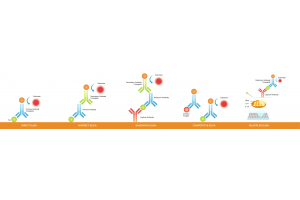
In a typical sandwich ELISA, a capture antibody binds the target analyte, while a detection antibody binds another accessible site on the target. The resulting antibody–analyte–antibody complex is detected through an enzyme-linked or other signal-generating system. Within the assay’s validated measuring range, the signal follows the method’s calibration response.
At extremely high analyte concentrations, some sandwich immunoassays can behave differently. Target molecules may bind capture and detection antibodies separately, reducing formation of complete sandwich complexes. The measured signal can then be lower than expected, potentially producing a falsely low concentration estimate. This is known as the high-dose hook effect, also called the prozone effect in some immunoassay contexts [1,2].
The effect is assay-dependent. A 2018 study demonstrated a high-dose hook effect in an ELISA measuring urinary decoy receptor 2 (DcR2), while a 2022 evaluation of 14 prolactin immunoassays found a marked effect in only one of the tested methods [1,2]. These findings show why susceptibility should be evaluated for the specific method rather than assumed for every ELISA.
A signal that approaches a plateau is not the same as a hook effect. The distinction matters because the two patterns do not support the same conclusion.
| Situation | Typical signal pattern | Interpretation |
|---|---|---|
| Within the validated range | Signal follows the calibration response | Quantification may be valid if other acceptance criteria are met |
| Signal plateau or upper-range limitation | Signal stops increasing proportionally or approaches a maximum | The sample may exceed the reliable quantification range |
| Possible high-dose hook effect | Signal decreases at very high analyte concentrations | The assay may underestimate concentration; investigate dilution behavior |
| Other analytical interference | Signal may be unexpectedly low, high, or inconsistent | The pattern alone cannot identify the cause |
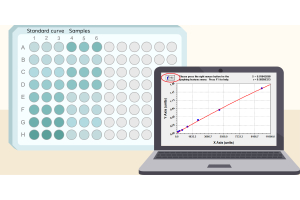
A result outside the standard curve is not proof of a hook effect. The calibration curve defines the range over which the method has been characterized; it does not establish how the assay behaves at every concentration above that range. A low OD should not be interpreted as a low analyte concentration if high-dose interference is plausible [1,3].
For a wider framework covering controls, dilution planning, and assay setup, see the ELISA experimental design checklist.
One important clue is a mismatch between the undiluted sample and a diluted aliquot. If the original sample produces a low signal but an appropriate dilution produces a stronger signal within the assay’s measuring range, high-dose interference becomes a possibility.
The dilution-corrected concentration is also important. If the concentration calculated from a diluted sample, after accounting for the dilution factor, is substantially higher than the estimate from the undiluted sample, the original measurement may have been affected by interference. A 2023 report of a semiquantitative SARS-CoV-2 antispike antibody assay described specimens that yielded higher results after dilution [3]. This is evidence from a specific assay, not a prevalence estimate for ELISA kits generally.
Biological expectations alone cannot diagnose a hook effect. Matrix effects, analyte stability, and differences between analytical methods can also contribute to discrepancies. A single low reading or one dilution is usually insufficient to identify the cause confidently.
When matrix interference is a concern, Boster’s guide to ELISA controls, dilution linearity, and spike-and-recovery explains how complementary checks answer different questions.
Serial dilution is a practical way to investigate whether a high-concentration sample is producing an unexpectedly low response. The dilution series should be designed around the assay instructions, expected concentration, available sample volume, and validated measuring range. There is no single dilution factor suitable for every ELISA.
For practical help choosing a starting dilution, see How to Decide ELISA Dilution Ratio.
Measure the original sample and appropriate dilutions using the assay’s recommended procedure. For each result that falls within the validated quantification range, calculate the concentration from the calibration curve and multiply it by the dilution factor to obtain the dilution-corrected concentration. Then compare corrected concentrations across the valid dilutions.
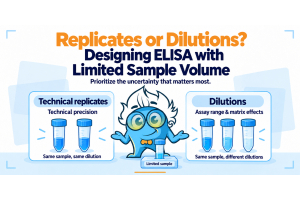
If sample volume is limited, this guide compares the trade-offs between replicates and multiple dilutions.
| What to review | Why it matters | How to interpret it |
|---|---|---|
| Raw OD or signal | Shows how the response changes with dilution | A rising signal raises suspicion but is not proof |
| Position relative to the validated range | Out-of-range results may not be reliably quantified | Prioritize results within the method’s supported range |
| Dilution-corrected concentration | Tests whether different dilutions yield comparable estimates | Agreement supports dilutional consistency |
| Replicates and controls | Help identify technical variability or broader assay problems | Poor agreement may prevent a confident conclusion |
Illustrative example only: an undiluted sample produces a low response, while a diluted aliquot produces a signal within the calibration range. If the diluted result, corrected for dilution, is substantially higher than the undiluted estimate, the pattern is consistent with possible high-dose interference. It is not conclusive by itself because dilution can also reduce matrix effects.
A 2022 ELISA methodology review identifies dilution-linearity experiments as a strategy for preventing or detecting the prozone (hook) effect [4]. Use the assay’s established acceptance criteria for dilutional linearity, recovery, and replicate performance where available. Do not invent a universal percentage agreement or automatically accept the highest calculated concentration.
For standard preparation and curve setup, see How to Perfect Your ELISA Standards.
A 2025 study developing and validating a recombinant human TNF-α-based ELISA for quantifying adalimumab also assessed high-concentration samples by diluting them into the assay’s linear range and evaluating dilution integrity [5]. This supports assay-specific evaluation, not a universal dilution factor or acceptance threshold.
A calibration curve does not support reliable quantification at every possible concentration. If a sample response falls outside the validated range, the reported concentration may be uncertain even without a hook effect. Follow the assay’s instructions for dilution and repeat measurement rather than extrapolating far beyond the curve [4,5].
For guidance on interpolation, dilution-factor correction, and result reporting, see How to Analyze ELISA Data and Calculate Results.
Sample components can affect assay response. Dilution may reduce some matrix effects as well as reduce analyte concentration, so a signal increase after dilution is not uniquely diagnostic of a hook effect. Dilution-linearity and spike-and-recovery experiments, when appropriate, can help assess whether sample behavior is compatible with the method [4].
Unexpectedly low signals may also reflect sample degradation, reagent problems, incorrect incubation conditions, washing errors, or other deviations from the validated procedure. These are troubleshooting possibilities, not causes that can be inferred from the OD pattern alone. Review sample storage, reagent preparation, incubation timing, washing, and plate-reader settings, and examine controls and replicates before assigning a mechanism.
Boster’s ELISA sample preparation guide covers handling considerations for common sample types.
The most useful safeguard is to establish how the assay handles samples that may exceed its routine measuring range. Where high concentrations are plausible, use dilution procedures supported by the assay documentation or verify suitable dilutions experimentally.
Before selecting an assay, review its format, validated range, and sample compatibility with How to Choose a Good ELISA Kit.
A dilution-corrected concentration should be reported only when the measured diluted sample falls within the assay’s supported quantification range and the dilution procedure is acceptable for that method.
When multiple dilutions produce comparable corrected estimates, that consistency supports the result. It does not, by itself, prove that the original low reading was caused by a hook effect. If corrected estimates differ substantially, investigate dilutional linearity, matrix interference, recovery, and procedural factors rather than reporting a single unqualified concentration.
For reports and publications, document the dilution used, the measured result within the calibration range, the dilution-corrected concentration, and any relevant limitations. If results remain inconsistent, state that further investigation is needed rather than selecting the value that best matches expectations.
For a step-by-step view of the assay workflow, refer to Boster’s ELISA protocol and troubleshooting guide.
The high-dose hook effect is an important possible explanation for unexpectedly low ELISA results from highly concentrated samples, but it should not be diagnosed from a single low OD. Distinguish a falling signal from a plateau or an out-of-range result, then investigate dilution behavior using the assay’s validated procedure.
Compare raw signal with dilution-corrected concentrations, assess whether results fall within the supported measuring range, and consider matrix and procedural effects. When corrected results remain inconsistent, further investigation is more defensible than reporting an unsupported concentration.
[1] Chen J, Chen KH, Wang LM, et al. High-dose HOOK effect in urinary DcR2 assay in patients with chronic kidney disease. Clinical Biochemistry. 2018;58:32–36. doi:10.1016/j.clinbiochem.2018.06.001. PubMed
[2] Raverot V, Perrin P, Chanson P, et al. Prolactin immunoassay: does the high-dose hook effect still exist? Pituitary. 2022;25(4):653–657. doi:10.1007/s11102-022-01246-8. PubMed
[3] Benirschke RC, Lee HK. Hook Effect in Semiquantitative SARS-CoV-2 Antispike Total Antibody Assay. American Journal of Clinical Pathology. 2023;160(3):225–228. doi:10.1093/ajcp/aqad043. PubMed
[4] Borges L, Dermargos A, Hatanaka E. Technical bioanalytical considerations for detection and quantification of cytokines in ELISA assays. Cytokine. 2022;151:155615. doi:10.1016/j.cyto.2021.155615. PubMed
[5] Saini DK, Devaramani MS, Shanmugavel H, et al. Development and validation of a recombinant human TNF-α based ELISA to detect and quantify adalimumab. Biochemistry and Biophysics Reports. 2025;42:102005. doi:10.1016/j.bbrep.2025.102005. PubMed