This website uses cookies to ensure you get the best experience on our website.


- Table of Contents
You return to the same field of view, take another image, and notice that the fluorescence is dimmer. It is tempting to interpret the change as a weaker biological signal, but the image alone cannot tell you why the intensity fell. Photobleaching is one possibility; changes in focus, illumination, sample position, or—in live-cell experiments—cell behavior can also affect what the camera records.
Photobleaching is an irreversible loss of fluorescence caused by light-induced changes in a fluorophore. Repeated exposure can therefore reduce measured intensity even when the amount of labeled target has not changed. The practical challenge is to determine whether acquisition-related signal loss could affect the comparison you want to make, and to design imaging conditions that keep that risk under control [1,2].
For the staining workflow and sample-handling steps that precede imaging, see Boster’s IHC/ICC/IF protocol resource.
Fluorophores absorb excitation light and emit fluorescence, but illumination can also drive photochemical reactions that permanently reduce their ability to fluoresce. This is photobleaching. It can occur in fixed specimens as well as live-cell imaging; fixation does not make a fluorescent label immune to light damage [1,2].
Not every fluctuation in fluorescence is irreversible bleaching. Some fluorophores temporarily enter non-emissive states, and measured intensity can also change when the sample moves, focus shifts, or acquisition settings vary. These possibilities can look similar in a sequence of images, so a dimmer frame should be treated as an observation to investigate rather than proof of one mechanism.
For live samples, another distinction matters: excitation light can cause phototoxicity as well as photobleaching. Phototoxicity means light exposure perturbs or damages the specimen; it may alter cell behavior and compromise the biological process being measured. It is related to illumination, but it is not the same as fluorescence loss [3].
The amount of excitation light reaching a specimen affects fluorescence and can influence the rate of photobleaching. Exposure time, scan duration, repeated imaging, and fluorescence illumination used while locating or focusing on a field all contribute to the sample’s light exposure. A laser-power percentage or exposure-time setting is not a universal measure of the light dose at the specimen; the result depends on the instrument, optical path, and acquisition configuration [1,2].
For channel planning and fluorophore properties, see How to Choose Fluorophores for Multiplex IF.
Signal loss can begin before the first saved image. Repeatedly searching for a field under fluorescence illumination or leaving the excitation source on between captures adds exposure that may not be obvious from the image files. When intensity is the measurement, these steps should be considered part of the acquisition history, not incidental handling.
Fluorophores differ in photostability, and their behavior can depend on the sample environment. Sample preparation and mounting conditions may affect fluorescence stability, but the effect is not identical for every label or specimen [2,4]. Antifade mounting media can help in some fixed-sample workflows; they do not prevent all photobleaching and should be chosen for compatibility with the fluorophores and preparation being used.
Boster’s overview of staining dyes and mounting considerations also covers counterstains and fluorescence fading.
This related guide discusses fluorescent labels and mounting considerations in tissue staining: How to Choose the Right Fluorophore for IHC.
Acquisition settings can also create an apparent change. If illumination, exposure or dwell time, detector gain, or other relevant settings differ between images, brightness cannot be attributed to photobleaching alone. For quantitative comparisons, record and keep the relevant settings consistent [1,2].
Start with the acquisition history. If fluorescence decreases as the same field receives repeated illumination, photobleaching is plausible. The pattern is suggestive, not conclusive: focus drift, sample movement, illumination changes, and live-cell responses can also change measured intensity.
A reference region or control sample can help, provided it is expected to remain stable and has experienced comparable imaging conditions. If both the target region and a suitable reference decline, a shared technical factor becomes more plausible. If only the target region changes, do not immediately conclude that the change is biological; local bleaching can vary with labeling intensity and exposure, while a real local change may also be possible. Reference-based comparisons are only as reliable as the reference itself and the assumptions behind it [1,2].
For additional guidance on imaging controls and troubleshooting fluorescence artifacts, see How to Troubleshoot Multiplex IF.
For fixed specimens, a rapid decline during repeated imaging is a reason to investigate acquisition-related effects before interpreting the change as altered biology. For live cells, the distinction is harder because illumination can bleach fluorophores and perturb cell function at the same time. If the experiment measures cell dynamics, include a way to assess cell health or behavior and consider whether the imaging regime could be changing the process under study [3].
A useful check is to test the intended imaging sequence on a representative field before collecting the full dataset. Record signal over the planned imaging period using the same settings intended for the experiment. This reveals whether signal loss is large enough to threaten the measurement. It does not, by itself, prove that all observed decline is due to photobleaching.
Use the lowest illumination and shortest exposure or dwell time that still provide sufficient signal-to-noise for the scientific question. Reducing exposure can limit bleaching, but an image that is too dim or noisy may be unsuitable for quantification. The aim is not to minimize every setting indiscriminately; it is to avoid unnecessary light while retaining enough information to measure the signal reliably [1,2].
Where practical, locate fields and focus using transmitted light or another mode that does not excite the fluorophore. Switch to fluorescence illumination when ready to acquire the image, and avoid leaving excitation light on between captures if the instrument allows it. Plan the order of acquisition so that one group of samples does not consistently receive more pre-imaging exposure than another [1,2].
Keep relevant acquisition settings consistent across samples being compared, including illumination, exposure or dwell time, detector settings, scan strategy, and acquisition order. For fixed samples, choose a mounting medium compatible with the fluorophore and workflow. For live-cell imaging, reducing unnecessary illumination and monitoring phototoxicity are more relevant than using a fixed-sample antifade medium [3,4].
Boster’s IHC principle guide provides further background on fluorescent antibody detection and imaging controls.
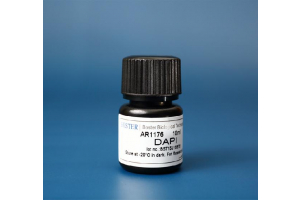
For an example of a fluorescence stain with an antifade recommendation, see the DAPI staining solution protocol.
When fluorescence intensity is used as a proxy for target abundance, bleaching can introduce a decline that is unrelated to the biological quantity being measured. This matters when comparing fields, samples, or time points that have experienced different illumination histories. Even fixed specimens can lose signal during acquisition [1,2].
Background subtraction and reference regions can help address some sources of variation, but they cannot recover fluorescence that has been irreversibly lost. Normalization also cannot automatically distinguish bleaching from a genuine biological change. Retain raw images and acquisition metadata so that intensity differences can be interpreted in context.
Bleaching correction may be useful for time-lapse data when a suitable decay pattern can be estimated and the assumptions of the correction method fit the experiment. ImageJ/Fiji tools include approaches such as ratio-based correction and curve fitting, but these methods make different assumptions and can introduce error when the model does not match the data [5].
Correction should be assessed against the experimental design and appropriate controls, not selected simply because it makes an intensity curve look more stable. If the signal itself is changing biologically, an algorithm may remove part of that change along with the technical decline. Whenever possible, reduce and characterize bleaching during acquisition before relying on post-processing.
| Observation | What to check next | Important limitation |
|---|---|---|
| The same field becomes dimmer after repeated illumination | Review cumulative exposure, scan duration, and time spent focusing or searching | Consistent with bleaching, but not proof on its own |
| Target and reference regions both decline | Check whether both received comparable illumination and whether settings changed | Only informative if the reference is expected to remain stable |
| Different fields start at different brightness levels | Compare sample heterogeneity, focus, labeling, and pre-imaging exposure | Different starting intensities do not establish bleaching |
| Live-cell signal changes along with cell behavior | Consider bleaching, phototoxicity, movement, and biological dynamics | Intensity alone cannot separate these effects |
| Signal continues to decline despite consistent settings | Review fluorophore stability, sample conditions, and cumulative light exposure | Further controls may be needed before quantitative interpretation |
Use this as a way to prioritize checks, not as a diagnostic test. Review the acquisition record first, compare an appropriate reference if one exists, and test the planned imaging sequence under consistent conditions. If the observed decline could change the comparison between samples, reduce unnecessary exposure or evaluate a correction method that is appropriate for the data. Do not infer biological change from raw intensity alone when acquisition-related loss has not been assessed.
Photobleaching can make an immunofluorescence image grow dimmer even when the labeled target has not changed. The extent of signal loss depends on the fluorophore, sample conditions, and cumulative illumination, while live-cell experiments also need to account for phototoxicity.
For reliable intensity comparisons, limit unnecessary exposure, keep acquisition conditions consistent, record the imaging history, and use controls that fit the biological question. Apply bleaching correction only when its assumptions are appropriate and its effect on the result can be evaluated.
[1] Jonkman J, Brown CM, Wright GD, et al. Tutorial: guidance for quantitative confocal microscopy. Nature Protocols. 2020;15:1585–1611. doi:10.1038/s41596-020-0313-9. Journal article
[2] Montero Llopis P, Senft RA, Ross-Elliott TJ, et al. Best practices and tools for reporting reproducible fluorescence microscopy methods. Nature Methods. 2021;18(12):1463–1476. doi:10.1038/s41592-021-01156-w. Journal article
[3] Laissue PP, Alghamdi RA, Tomancak P, Reynaud EG, Shroff H. Assessing phototoxicity in live fluorescence imaging. Nature Methods. 2017;14:657–661. doi:10.1038/nmeth.4344. Journal article
[4] Reiche MA, Aaron JS, Boehm U, et al. When light meets biology—how the specimen affects quantitative microscopy. Journal of Cell Science. 2022;135(6):jcs259656. doi:10.1242/jcs.259656. Journal article
[5] Miura K. Bleach correction ImageJ plugin for compensating the photobleaching of time-lapse sequences. F1000Research. 2020;9:1494. doi:10.12688/f1000research.27171.1. Journal article